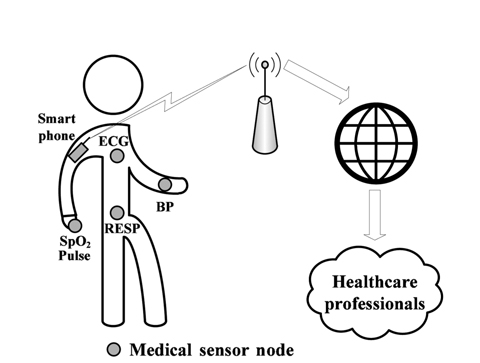
In medical applications, implementations of specialized wireless sensor networks (WSNs), known as wireless body area networks (WBANs), are composed of numerous small wireless devices attached to or implanted in the body of a patient to collect various vital signs and to transmit collected data to a central device (i.e., base station, smart phone, etc.) for processing. It triggers medical alarms for emergency medical services upon detection of anomalies in the gathered physiological data, to quickly react by taking the appropriate actions [1, 2]. This allows real-time monitoring and early detection of clinical deterioration [2-4].
The medical applications of WSNs are closely related to vital-sign monitoring and real-time detection of lifethreatening emergencies within a few seconds, like heart attacks or sudden falls by elderly people, or to monitor individuals for early detection of chronic illnesses and cognitive disorders (e.g., cardiovascular, Alzheimer disease, Parkinson disease, diabetes, epilepsy, asthma). For example, high blood pressure is an important indicator for cardiovascular diseases. WBANs are also used in kinematic for rehabilitation assessment and to collect environmental parameters (temperature, humidity, light, exposure to radiation, etc.) of the monitored patient.
At present, many existing medical wireless devices are available in the market (i.e., MICAz, MICA2, Tmote Sky, TelosB, IRIS, Imote2, Shimmer, etc.) and can be used to collect various vital signs [5], such as heart rate (HR), pulse, oxygen saturation (SpO2), respiration rate, body temperature (T°), electrocardiogram (ECG), electromyogram, blood pressure, blood glucose levels, galvanic skin response, etc. These small devices will improve the life quality of patients by allowing in-home and remote monitoring for the elderly, the immobile, and people with long-term diseases. Wearable and invasive medical sensors provide mobility and freedom by allowing monitored persons to continue their daily life activities while being monitored. They also reduce the healthcare costs (overcapacity, waiting, sojourn time, number of nurses, etc.) through reducing the number of occupied beds in hospital by patients under monitoring.
Patients in hospitals or elderly at home are under-monitored (with about 3 checkups per day) [6] and 6,000 a year die due to poor patient monitoring [7]. The use of WSNs will reduce the healthcare costs by triggering an alarm for caregivers when the health of remotely monitored patients enters a critical phase. For example, when the blood pressure of a diabetes patient is above 130/80, he must be treated immediately because of the high risk of heart attack. Similarly, low SpO2 is a symptom of heart and lung problems.
However, with the small size and weight of these devices, their underlying constrained resources (such as limited energy, small memory, reduced processing power, limited transmission range, etc.) make them susceptible to various sources of environmental noise—e.g., communication interference, transmission malfunctions, signal fading, short hardware fault, errors, malicious attacks through data injection/modification, replaying attacks [1], or simply the energy outage of the used sensor. These sources of environmental noise may lead to unreliable measurements [8], faulty diagnosis results, false alarms, and an unreliable monitoring [9, 10]. Medical applications have strict requirements for reliability, security, and privacy [2]. The sensor measurements should be accurate to avoid false alarms and misdetections. Anomalous data (also called outliers) from badly attached or compromised sensors must be identified and isolated to ensure reliable operations. A medical WSN will be rejected by healthcare personnel and patients if results are not reliable [3].
Consequently, faulty measurements heavily affect the monitoring and medical diagnosis results. The false alarms may threat the life of monitored patient and affect the credibility of such monitoring application, where reliability is extremely important to ensure accuracy in the medical domain [11]. For example, an improperly attached pulse oximeter clip or an external fluorescent light may produce erroneous readings.
The sensing components are the first source of unreliability in medical WSNs, not networking issues [3]. Therefore, abrupt deviations in collected data must be detected and processed in real-time to distinguish between a clinical emergency and faulty measurements, in order to reduce false alarms. Both cases induce anomalous measurements and should be accurately detected. Therefore, an anomaly detection mechanism is required to identify abnormal patterns and to distinguish between sick patients and faulty measurements, thus reducing false alarms and unnecessary intervention by healthcare professionals. The physiological parameters are heavily correlated, where changes occur in at least two or more parameters, and the spatial correlation between monitored attributes can be exploited to distinguish faulty measurements from patient health degradation state.
Anomaly detection algorithms in sensor measurement can be classified into two approaches: parametric and non-parametric. Parametric methods assume a known underlying distribution of collected measurements. The parameters of the distribution function are calculated in a training phase and are used in a test phase to determine if the observation has been emitted by the associated distribution function. However, this assumption is unrealistic in medical applications for monitoring the variations of physiological attributes. Many physiological parameters are highly dynamic and do not have a matching statistical distribution, e.g., the HR can vary from person to person, and even for the same individual, the HR changes with physical activities.
The non-parametric approach does not require any prior knowledge (or assumptions) on the data distribution and uses the distance between test instances (or observations) and the established model to detect deviations in data patterns through the use of thresholds. The most widely used approaches are the kernel density estimator (KDE) and histograms. KDE uses kernel functions to estimate the probability density function (PDF). The test instance with low probability with respect to established PDFs is considered as abnormal. The histogram method is based on the frequency of occurrence of data and determines which category the test instance belongs to. The accuracy of these methods heavily depends on the used threshold.
These approaches assume the existence of training data without anomalies. In reality, training data is a challenging problem. Usually, unlabeled samples are used to build an initial model, and data from a sliding window are used to update the model. The training data is not free from anomalies, which may induce masking (hiding second outliers) and swamping (where normal values are considered as anomalies).
In this paper, we aim to accurately identify abnormal measurements in the data gathered by medical WSNs. We consider a scenario where many sensors are attached to the patient, in order to monitor some physiological parameters, and transmit the data to a smart phone which must analyze the collected data, and raise alarms to the caregiver only when the patient health degrades. We seek to detect and to remove outliers in order to reduce false alarms triggered by inconsistent sensor readings which significantly deviate from the normal data measurements. The objective is to raise alarms only when the patient's health is abnormal (illness).
The proposed anomaly detection framework is based on the Mahalanobis distance (MD) [12] and the KDE [13]. The MD takes advantage of the correlation between monitored attributes to detect deviations. Only when the MD is greater than a pre-defined threshold, the KDE is activated to detect temporal outliers and to pinpoint responsible attributes. We have applied our anomaly detection approach on real physiological datasets with anomalies. Our experimental results show the effectiveness of our proposed approach for accurate detection with low false alarm rate.
The objective of our proposed framework is to provide reliability in medical WSNs and to distinguish between faulty measurements and critical health degradation. We seek to reduce the false alarm rate triggered by inconsistent sensor readings. Data processing is realized on the base station (smart phone), which has a global view for spatio-temporal analysis.
The rest of this paper is organized as follows. In Section Ⅱ, we review the related work. In Section Ⅲ, a brief overview of the techniques used in our approach is presented. Section Ⅳ describes the proposed approach for the intrusion detection system. In Section Ⅴ, experimental results are presented to demonstrate the effectiveness of the propose approach. Finally, Section Ⅵ concludes the paper.
Several medical applications for WSNs have been proposed for health monitoring. An accelerometer-based method was used to detect patient inactivity at home and to trigger an alarm for an immobile patient for a long time [14]. Another approach [15] deals with a wearable accelerometer to detect falls by elderly people under remote monitoring.
Many other architectures for medical sensor networks have been proposed and deployed to monitor patients and to raise alarms in case of medical emergencies, such as MEDiSN [4] and CodeBlue [16, 17] for monitoring HR, ECG, SpO2, and pulse, LifeGuard [18] for ECG, respiration, pulse oximeter, and blood pressure, AlarmNet [19] and Medical MoteCare [20] for physiological (pulse and SpO2) and environmental parameters (temperature and light), Vital and Jacket [21] for ECG and HR. Surveys of medical applications using WSNs are available [22, 23].
However, the data collected by WSNs have low quality and poor reliability [10] due to their limited resources. Data filtering techniques are used to reduce noise level and retain good data. However, it may change and reduce the shape of variation rather than only cleaning datasets by removing outliers. Therefore, anomaly-based intrusion detection systems are used to build a normal data model and detect unusual deviations. Different approaches for anomaly detection have been proposed and applied in WSNs to detect abnormal deviations in collected data and have been analyzed in terms of their detection accuracy and false alarm ratio [24, 25]. Machine learning [26] algorithms for classification and data mining [26] techniques for clustering have been widely applied, such as neural networks, Naive Bayes, decision trees (C4.5) [27], support vector machines (SVMs) [28-31], self-organizing maps [32], k-means [33], k-nearest neighbor [34], expectation maximization, hierarchical clustering, fuzzy Cmeans, and Gaussian mixture model [35], etc. Various classification and clustering techniques have been comprehensively studied [26].
Logistic regression modeling with a static threshold was used to evaluate the reliability of a WSN in the industrial field with a large number of sensors [36]. However, they do not update the parameters of the established model to be able to identify the cause of potential loss of reliability. On the same scale of large sensor networks, a diagnosis method based on the enhanced C4.5 (J48 or decision tree algorithm) was proposed, which merges the local classifiers into a large spanning tree to answer for the whole network accuracy [27]. The physical activity of a person was monitored using Sun SPOT sensors attached to the thighs [37]. They used the Naive Bayes algorithm to determine if the person is sitting, standing, lying down, or walking. However, they did not take into consideration that the values can be corrupted due to faulty hardware. Similarly, another system was able to distinguish between mental stress states and relaxation states using logistic regression based on the HR variability [38].
The SVM classifier has gained popularity due to its optimum solution and its simple numerical comparison for data classification. Several SVM-based approaches have been proposed [29, 30, 39] for anomaly detection in WSNs. Moreover, many nonlinear versions of SVMs (kernel-based) have been investigated to find a boundary (or hyperplane) that encompasses the majority of normal data in the training phase. When the decision boundary is established, any new data outside the boundary is classified as abnormal.
However, machine learning algorithms need a preclassified (or labeled) training data set, which is often skewed or unavailable in the real world. Skewed (unbalanced) labeled data occurs when one class is over-represented (e.g., 99% of data are normal), and anomalies are almost not available in the training data set. Constructing a labeled training set is often a laborious and expensive task. To resolve these problems of training data in machine learning methods, data mining (or unsupervised) techniques group similar data in one cluster, and flag the small-size clusters (containing less than
A survey of different techniques for outlier detection in WSNs was proposed, with a comparative guideline to select a suitable technique based on the characteristics of the used data set [25]. Linear regression was used to predict missing data with low error in WSNs [40]. Different approaches were used for anomaly detection in WSNs, such as fixed and dynamic thresholds, linear least squares estimation, auto regressive integrated moving average, hidden Markov model, etc. [41].
A distance-based method was used to identify insider malicious sensors, while assuming neighbor nodes monitor the same attributes [42]. Each sensor monitors its onehop neighbors and uses the MD between measured and received multivariate instances to detect an anomaly. However, it is impractical in medical applications to exploit promiscuous modes and to place redundant sensors for monitoring the same parameters. MD has been used to classify electronic products as healthy or unhealthy [43].
A score-based approach was used for anomaly detection in collected data by sensors [44]. The proposed approach was based on a Hampel filter and KDE to identify outliers, but it did not take into account the correlation between attributes. Only limited research has used spatial and temporal correlation for outlier detection [10]. The temporal dependency means that the current attribute measurement depends on readings at the previous time instants, while the spatial dependency means that the observations from different attributes are correlated.
In health monitoring, the physiological parameters are heavily correlated. To increase the accuracy of anomaly detection systems, our proposed approach exploits the spatial and temporal dependencies among the monitored physiological parameters to distinguish between faulty measurements and medical emergencies. The objective is to ensure reliable operations of sensors and accurate medical diagnosis results. Sensor measurements tend to be correlated in time and space, and errors are usually uncorrelated uncorrelated with other attributes.
The first attempt to capture spatio-temporal correlations was introduced [10] using regression to build two models using previous observations. However, as the model keeps a sliding window of the past collected instances, the model is subject to false alarms if outliers are not discarded from the training data.
Our proposed framework measures the spatial dissimilarity between multivariate vectors (p-dimensional), through the use of MD to detect abnormal instances. When an abnormal instance is detected, the KDE is activated to detect the change point (temporal deviation). As the physiological parameters are heavily correlated, clinical emergency induces changes in many attributes (at least
In this paper, we propose a simple and lightweight approach for online anomaly detection in collected data by medical wireless sensors. The proposed approach is based on MD for spatial analysis and KDE for temporal analysis. The objective is to reduce false alarms resulting from faulty measurements, thus enhancing the reliability and the accuracy of the monitoring system.
In this section, we briefly review the MD and the KDE used in our framework.
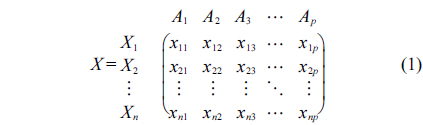
The MD is a commonly used method for outlier detection in multivariate data. Let
The MD measures the distance between attributes while taking into account the correlation between them:
where
A large value of
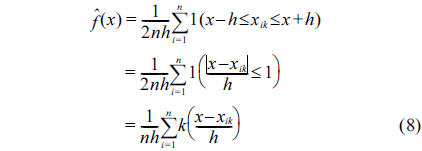
The KDE is a nonparametric method used to estimate the PDF for statistical analysis. Let
To estimate the density , we consider the discrete derivative (for a small
which can be written as:
where:
K(.) is the kernel of uniform density function on [−1,1], and
and the optimal bandwidth:
where
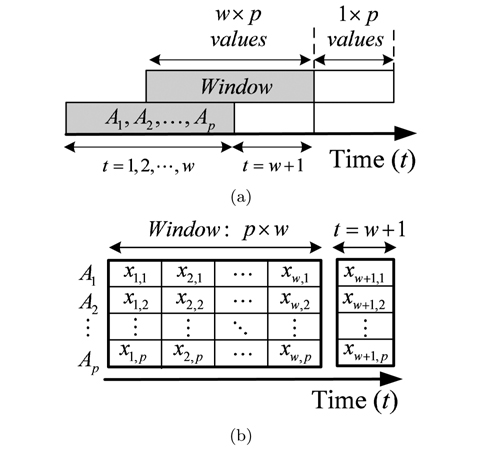
We consider a general medical deployment scenario, where
Sensor measurements are sent periodically every discrete time interval
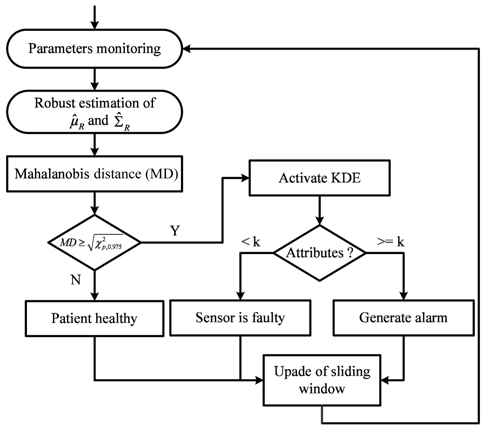
After the arrival of a new instance, MD is calculated between the training data in the sliding window and the current attributes values. If
However, the data in the sliding window is not reliable and may contain outliers, which disrupt the estimated values for these statistical parameters. When outliers are in the training set, they dominate and pull the statistical parameters toward them, and this inappropriately leads to a large value of MD for normal data (swamping), or a small value of MD for outliers (masking or misdetection). To provide accurate results of MD, the used data in the sliding window must be cleaned to guarantee anomaly- free training data.
Many robust estimation methods for mean and covariance matrixes of multivariate data have been proposed and used to remove outliers, e.g., minimum volume ellipsoid, orthogonalized Gnanadesikan-Kettenring [45], minimum covariance matrix (MCD) [46], fast-MCD [47], and deterministic MCD [47]. These methods seek to find a subset
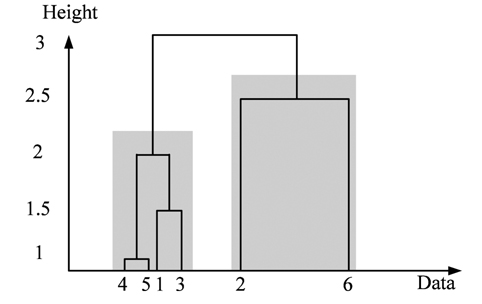
To achieve this objective, we use the hierarchical agglomerative clustering to aggregate data points with low distance (or resemblance coefficient) in one cluster. The resemblance matrix containing the distance between each point and whole others is used to identify the minimal coefficient and merge the two data points into one cluster. This procedure is repeated to build the dendrogram (or cluster tree) shown in Fig. 4. Clustering is obtained by cutting the dendrogram at a desired level. In this paper, when the distance between clusters (intercluster distance) becomes large enough (at least 3 times the previous distance), we stop the aggregation procedure. The stop point will determine the number of clusters, and the cluster containing the majority of data points is used to robustly estimate the statistical parameters ( and ).
After the robust estimation of mean () and covariance (), MD is used to detect deviations using the threshold in Eq. (5). If MD is larger than a threshold (
However, KDE is also sensitive to outliers through the bandwidth, which is directly proportional to standard deviation ( in Eq. (11)). To overcome this problem and to provide training data without anomalies and without additional computational complexity, we use the subset of values in a sliding window with weight equal to one in the reweighted estimator as a reference:
For a new observation
When only one attribute is anomalous, the measurement is considered faulty, and no alarm will be raised. However, if at least
In this section, we present the application results of the proposed framework for online anomaly detection in gathered data by medical WSNs. We use a real medical dataset from the PhysioNet database (MIMIC Database) [48]. The dataset contains 7 attributes: mean values of blood pressure (BPmean), systolic blood pressure, diastolic blood pressure, HR, pulse, respiration rate (RESP), and oxygenation ratio (SpO2). We only focus on five attributes (
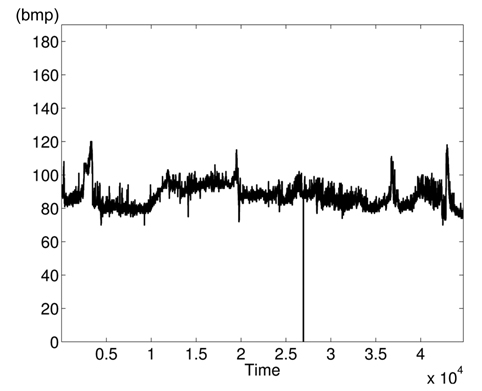
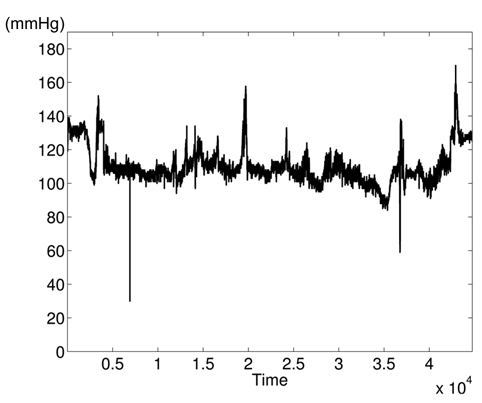
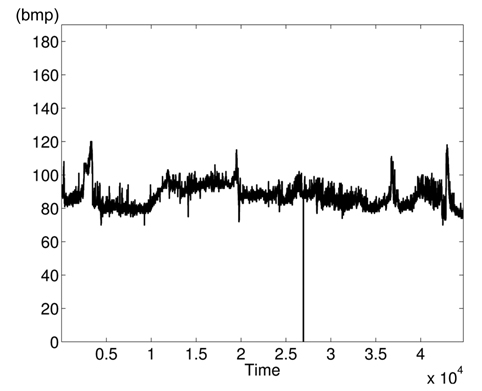
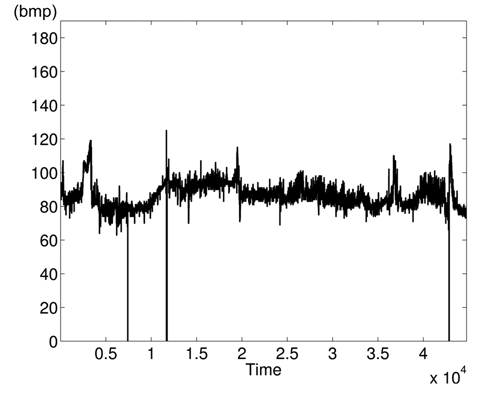
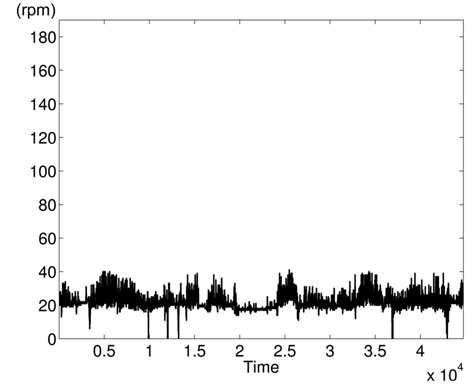
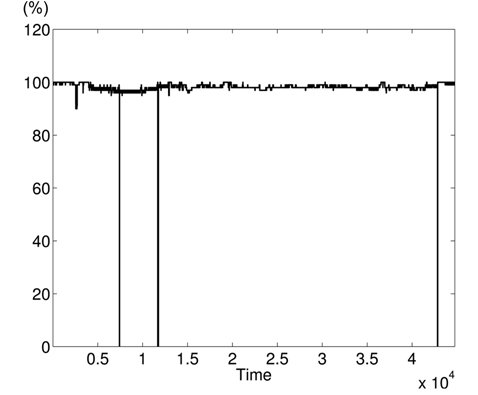
The variations of BPmean, HR, pulse, RESP, and SpO2 are presented in Figs. 5–9, respectively. BP is measured in millimeters of mercury (mmHg) with normal values (∈ [90 – 140]. HR and pulse are in beats per minute (bpm) with normal values for a healthy adult in rest ∈ [60 – 100]. The RESP is measured in respiration per minute (rpm) and SpO2 is the percentage of oxygen in the blood with respect to normal values ∈ [95% – 100%]. As the physiological parameters are usually not the same for all people and they depend on many parameters (sex, age, weight, activity, etc.), the use of a static interval for anomaly detection heavily depends on many additional dynamic parameters (environmental, ages, activities: rest, moving, awake, sleep, etc.), and these parameters are not easy to set dynamically.
Clearly in Fig. 5, there are two abnormal values of BP falling to 30 and 55 bpm, and other variations associated with clinical change of the monitored patient can be visually distinguished. Furthermore, some values in HR and pulse fall to zero in different time instants (shown in Figs. 6 and 7). HR and pulse measure the same physiological parameter using two different devices, and usually, both curves must superpose. This is not the case when comparing both figures. The same goes for the RESP and the SpO2 in Figs. 8 and 9. We can visually identify abnormal variations in Fig. 9, where we can see some abnormal readings of SpO2 with zero values (3 spikes).
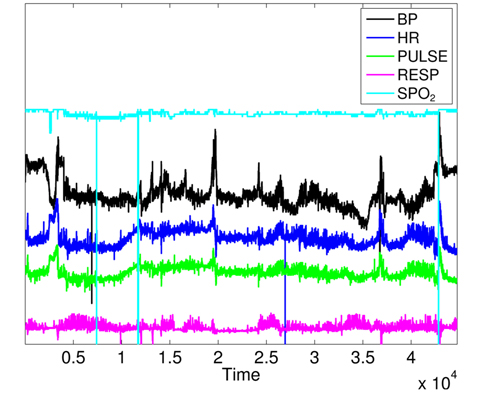
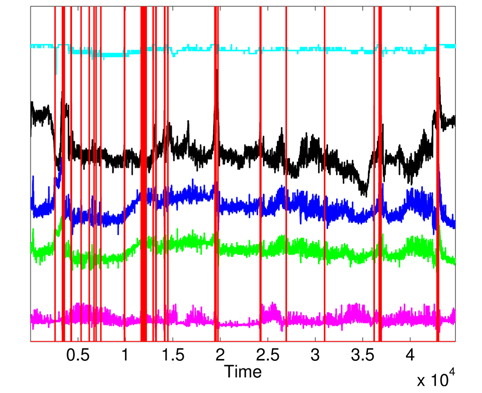
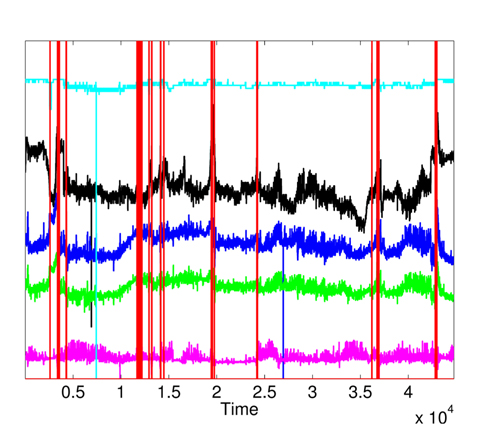
To prove the correlation between monitored attributes, we show the variation curves of the 5 parameters in Fig. 10, where we can notice that clinical emergency induces changes in many parameters at the same time instant. However, there is no spatial correlation among monitored attributes for faulty measurements, where one attribute heavily changes independently from others. It is important to note that some variation curves in Fig. 10 are shifted for clarifying the shape of their variations. We can visually identify 4 zones of clinical changes, where either the values of many attributes increase at the same time, or some attributes increase and others decrease.
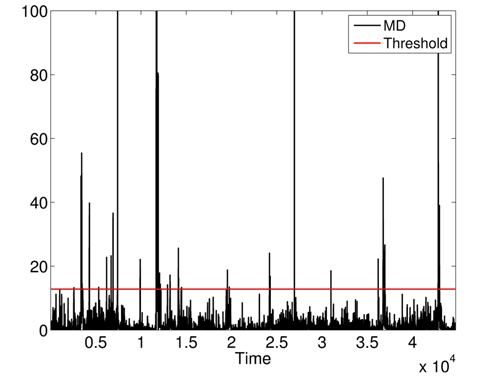
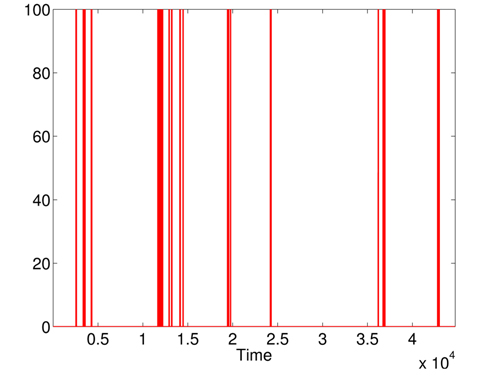
First, we apply MD over the five physiological attributes (with robust estimation of mean and covariance) to show the utility of KDE used in the second phase. The variations of squared MD (without the applications KDE) are presented in Fig. 11, with a threshold = 12.83 (horizontal line). Most raised alarms by squared MD in Fig. 12 are false alarms and result from benign deviations or faulty measurements, as shown in Fig. 13, which contains the raised alarms by robust MD and the variations of the 5 attributes.
The raised alarms by the sequential execution of both methods (MD followed by KDE) and the inspections of
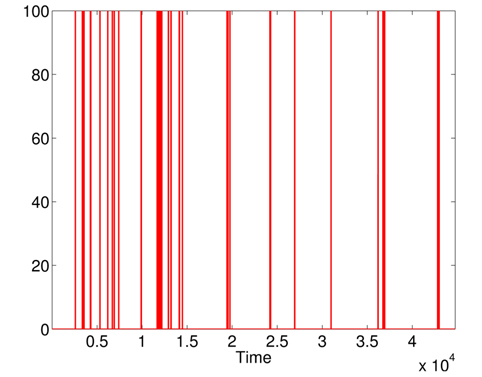
Furthermore, the false alarms triggered by inconsistent measurements are discarded when comparing Figs. 12 and 15. It is important to note the difference between the number of raised alarms by MD (shown in Fig. 11) and the number of alarms transmitted to the healthcare emergency team after the application of KDE and p-value (shown in Fig. 15).
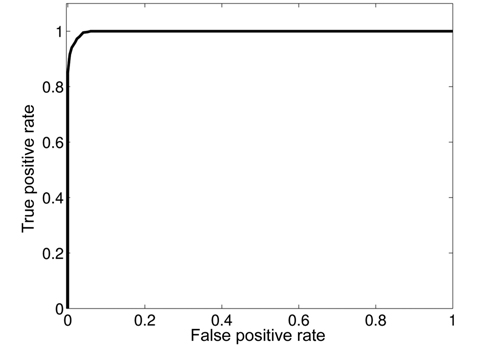
To evaluate the performance of our proposed approach, we inject abnormal values at different time instants in the different attributes. We use the receiver operating characteristic (ROC) curve to analyze the impact of detection threshold (
where TP is the number of true positives and FP the number of false positives. The false positive rate is defined as:
As existing anomalies are not enough to realize this analysis, we synthetically injected 100 anomalies at known time instants in the used dataset. A good detection mechanism should achieve a high detection ratio with the lowest false alarm rate. Fig. 16 shows that our proposed framework can achieve a DR of 100% with an FAR of 5.5%.
In this paper, we proposed an unsupervised approach for anomaly detection in medical WSNs, where faulty measurements and injected data could threaten the life of the monitored patient. The proposed approach is based on the MD and a KDE to detect abnormal measurements and to distinguish faulty measurement from a clinical emergency, through the use of spatial and temporal correlation between monitored attributes. The system keeps its relevancy over time by updating the statistical parameters and obtaining more precise evaluation of the normal state of the patient. The proposed approach is suitable for online detection and isolation of faulty or injected measurements with low computational complexity and storage requirement.
We have evaluated the proposed approach using real and synthetic medical datasets. Our experimental results show the effectiveness of our proposed approach in reducing the number of false alarms triggered by faulty measurements (or maliciously injected data) in medical WSNs.
Most of the time, collected measurements are normal. The reduction of exchanged data between wireless sensors and sink node will be studied in future work. Our next task will be oriented toward distributed detection of an anomaly in sensors to reduce the wasted energy by the transmission of faulty measurements.