To address the problem of multi-target retrieval (MTR) of remote sensing images, this study proposes a new object-level feature representation model. The model provides an enhanced application image representation that improves the efficiency of MTR. Generating the model in our scheme includes processes, such as object-oriented image segmentation, feature parameter calculation, and symbolic image database construction. The proposed model uses the spatial representation method of the extended nine-direction lower-triangular (9DLT) matrix to combine spatial relationships among objects, and organizes the image features according to MPEG-7 standards. A similarity metric method is proposed that improves the precision of similarity retrieval. Our method provides a trade-off strategy that supports flexible matching on the target features, or the spatial relationship between the query target and the image database. We implement this retrieval framework on a dataset of remote sensing images. Experimental results show that the proposed model achieves competitive and high-retrieval precision.
Along with the rapid progress of satellite sensor technology and their application to high-resolution remote sensing images in Earth observation systems, a large amount of remote sensing data have become readily available for acquisition. In terms of spatial information, terrain geometry, and texture information, high-resolution remote sensing images have more features than middle or low-resolution images. To use the image database fully and to retrieve interesting information automatically and intelligently, a new efficient technology for multi-target retrieval (MTR) in an image, particularly in a specified region, is expected to be developed.
The number of image-processing applications for target retrieval is increasing, such as query by image content from IBM [1]. Most studies in this area have focused on content-based image retrieval (CBIR) and content-based remote sensing image retrieval (CBRSIR), and have achieved significant results. In these processes, the contents of an image, which specify several low-level features, such as color, texture, shape, longitude and latitude, and spatial relationships among objects, are the bases of multidimensional image feature vectors. Regarding the differences in imaging conditions of various forms of remote sensing images, we cannot exactly express image contents by using only a single feature. Therefore, constructing the comprehensive features of an image is the key to improving extraction performance [2]. However, if the combined features cannot be purified to form a unified model, then the accuracy of the similarity extraction and efficiency improvement of the images will be affected. For example, if we focus more on spatial relationship, then the detail of each target will be minimal. Thus, the efficiency of MTR will be higher than comparing the features of a single object. To effectively reveal the information retrieval process for remote sensing images, an objectlevel model is proposed, which can represent the contents of an image with overall accuracy. By using this model, we can retrieve and operate the information pre-stored in a symbolic image database (SID) with high efficiency, and neglect intrinsic information, such as color, texture, and shape. To date, research on feature representation models of image data for MTR remains limited. To build feature indices and to realize rapid retrieval, we propose an object-level feature representation model, based on a previous research on CBRSIR and the reference for MPEG-7 standards, starting with representing the contents of an image on an object-level feature, particularly the spatial relationship among targets.
The rest of this paper is organized as follows. Section Ⅱ discusses related literature on representation techniques of image contents for CBIR or CBRSIR. Section Ⅲ introduces calculation and representation feature values, and mainly describes the spatial representations of the extended nine-direction lower-triangular matrix (9DLT). Section Ⅳ presents a model of image content feature representation. Section Ⅴ proposes an MTR model and similarity calculation. The last section presents several experiments to validate the accuracy of the content-based feature representation model and the efficiency of image target extraction. A conclusion to the study is also presented in this section.
In the past three decades, academia has achieved a large number of results on CBIR and CBRSIR. At present, CBIR has many successful applications in the fields of facial recognition, medical diagnosis, and trade registration. Most of these systems have adopted single feature or combined features as image indices [3-10]. CBRSIR is similar to CBIR, because both contain visual and geographic information. Several systems have focused on the issue of spectral retrieval, such as texture representation, and different combinations with spectral bands [11]. A special feedback approach has been employed to precisely describe the desired search characteristic in a remote sensing image [12]. Some researchers even presented a code stream of images for remote sensing image retrieval [13]. In addition, other scholars combined a scheme with an automatic classifier, and proposed the use of new feature ‘texton histograms’, to capture the weaktextured characteristic of remote sensing images for image retrieval [14]. Meanwhile, others applied a texture analysis approach, called the local binary pattern operator, to implement image retrieval [15]. Some of these studies even applied independent component analysis to extract independent components of feature values via linear combinations to realize multi-spectral image retrieval [16]; or adopted principal component analysis and a clustering technique to index remote sensing images for image retrieval [17]. Considering various features, such as color, texture, and spectra, a prototype model for CBRSIR based on color moment and gray level co-occurrence matrix feature was proposed [18]. A number of researchers combined several properties (color, texture, and points of interest) that were automatically extracted and immediately indexed images [19]. In addition, some researchers proposed a framework based on a domaindependent ontology to perform semantic retrieval in image archives [20]. Other scholars also presented a universal semantic data model for image retrieval [21]. Regardless of how a feature vector is established, this vector still depends upon the representation of contents in images. To date, the contents of images can be represented in numerous ways. Some approaches adopt a quad-tree structure or a quin-tree method that splits large-scale remote sensing images into sub-images, to extract multiple features, such as color and texture [22, 23]. Others use the 2D C-string to represent spatial knowledge of an image database [24]; or the spanning representation of an object to realize spatial inference and similarity retrieval in an image database, through directional relation referenced frames [25]. Others depict the relationships among spatial objects by using the methods of the nine-direction spanning area [26] or 9DLT [27]; and represent image colors by using pyramid technology [28]; or express an image by employing a symbol index, which is established in image space stratification [29]. All the aforementioned related representations include color, space, and subimages that belong to the feature representation method on image contents. Implementing rapid and accurate retrieval with a massive remote sensing image is difficult, because its features include various data types, resolution scales, and data sources. In our investigation, we analyze the contents of an image based on the MPEG-7 standard to organize the features of the image, build an SID, and index the SID to accelerate target retrieval.
The key to improving image retrieval efficiency is the index technique, which involves obtaining objects after image segmentation and building an SID for the image database. In the present study, we adopt a mature algorithm, called object-oriented multiscale image segmentation. The object-oriented image processing algorithm is a synthetic algorithm that fuses spectrum characteristics, geometric information, and structural information. This algorithm regards an object as a minimal process unit by retrieving its multiple characteristics to form a logical relationship among images and objects. Then, we analyze the image from the local to the entire level, and ultimately, implement its understanding. In general, multiscale image segmentation begins with any pixel by using a region merging method, from the bottom to the top, to form objects. Small objects can be merged to form large objects, and the size of each object must satisfy the demand of which the heterogeneity of a merged object is less than a given threshold. In this case, heterogeneity is decided by differences in the spectra and shapes of objects. However, various features correspond to different scales of observation, in which each feature can be extracted and accurately analyzed in an image layer on a proper scale [30]. In particular, we use the threshold value method on a multiple scale to segment an image.
After processing the calibration, segmentation, and raster vectorization of the image based on a specified region of latitude and longitude, the basic unit of the image is no longer a single pixel, but a polygon that is composed of homogeneous pixels. Each polygon can be used to calculate the spectral information of pixels, including shape, texture, color information, and topological relationships among the polygons. Next, we will introduce the method for calculating the feature vectors to implement the representation model.
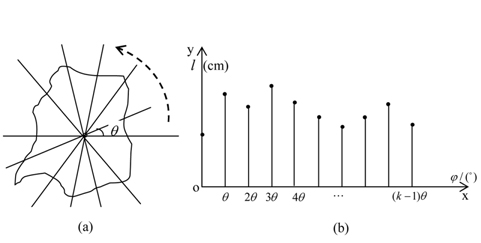
Shape is a key feature used to differentiate two objects. It is also the basis for characteristic retrieval, and the classified process mentioned in the latter part of this paper. In general, in the field of object-level content retrieval, shape remains as the most basic feature for distinguishing objects. At present, two approaches are used to describe shapes: parametric and geometric approaches. In the present investigation, we adopt a geometric approach to characterize the shapes of different objects, namely, the model of centroid radii representation [31].
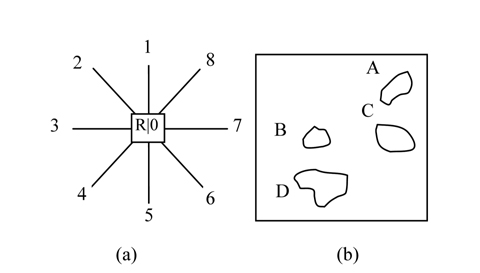
For an arbitrary polygon, such as the one shown in Fig. 1(a), the results of resampling an image with the angle
The condition for measuring similarity between two polygons based on shape is: if and only if the numerical difference between the central radii in all directions is less than a given minor threshold value
To ensure scale invariance of shape by using regulation (2), we need to normalize the Euclidean distance between the centroid and each vertex, within the range of [0, 1]. In this study, we discuss most of the possible transformations between two feature vectors. One of these transformations involves the possible rotations between two shapes, and the distances that are independent from rotation, including the starting and ending points.
After transforming image shape into matrix space, we store data, using the antipole tree structure [32].
Different features in high-resolution images typically have similar spectral appearances to human vision. The mean value floating of a spectral feature may also cause similar spectra among different homogeneity samples to converge as similar modes in a feature space, thus resulting in spectra with similar features. This phenomenon is attributed to the human eyes being insensitive to some portion of visible light. Therefore, we can improve the reliability of retrieval results by using features, such as shape, texture, and spatial relationships as references. Texture is a significant geometric (spatial) feature that can be used to distinguish among different objects and regions to reflect the changing discipline in gray space. A 2D Gabor filter is suitable for narrow-band coding of texture, because of its adjustable filtering direction, bandwidth, general band-center frequency, and optimal timedomain and spatial-domain analysis abilities. After finishing gray-scaling and normalization processes on image segmentation, we apply a Gabor filter to extract the texture feature of the objects. The Gabor filter function
where, , , and σ
where
where,
>
C. Spatial Representation of the Extended 9DLT
The spatial representation of an image describes the spatial relationships among objects to easily distinguish images with multiple targets. The spatial relationships in an image can be classified into two categories: positional and directional relationships. The former can be represented by a 2D string; whereas, the latter can be represented by 9DLT methods [25]. For a calibrated remote sensing image within the region of a certain latitude and longitude, the directional relationship relative to the four corners among the objects is confirmed. In this section, we introduce problem definitions and preliminary concepts, through formal methods.
DEFINITION 1.
DEFINITION 2.
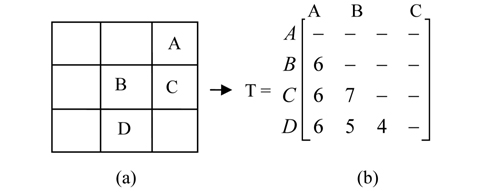
DEFINITION 3 (The 9DLT matrix).
As shown in Fig. 2(a), let
DEFINITION 4.
Constraints:(1) An item or object in a pattern is stored in alphabetical order.(2) No spatial relationship exists, if the length of a pattern is equal to 1.
The 9DLT expression is in accordance with the definition of the pattern.
DEFINITION 5. Pattern
DEFINITION 6.
Inference 1. Two
Inference 2. Suppose a pattern does not contain any (
Inference 3. The pattern of feature images and their specific sub-pattern can be obtained from a 9DLT string. By contrast, if (
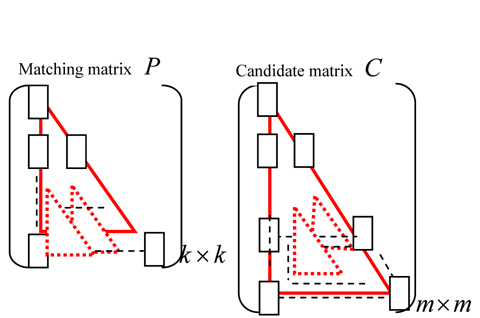
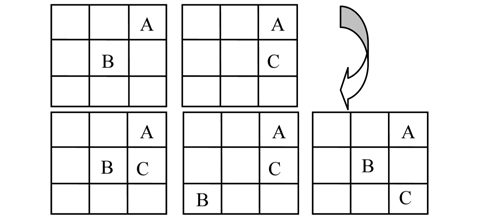
Generating candidate sets can significantly help object retrieval. To extract the image with the object (
Similarly, the 9DLT string of each image is known in the image database. That is, the spatial relationship between objects has been confirmed, and the problem of finding all images that satisfy minimum support is the process of matching patterns. In fact, the process can be converted to search the LT matrix with a problem on inclusion relationship. As shown in Fig. 5, according to the difference of the given objects and the minimum support, the position of matching matrix
The description of the match algorithm is as follows.
Ⅳ. THE OBJECT-LEVEL FEATURE REPRESENTATION MODEL
Typically, a data model is a framework that can be used to provide representation for information, and an operation method in the database system. The object-level feature representation model belongs to a section of this data model. For remote sensing images, the data model also includes metadata, such as location, resolution, and light intensity. However, the standard of measurement for a content retrieval system determines the efficiency and accuracy of extraction. Hence, each image needs a good model with an efficient content-based representation. Moreover, selecting a formula for similarity calculation is also vital. Based on this concept, we present the objectlevel feature representation model for the image data in the next section.
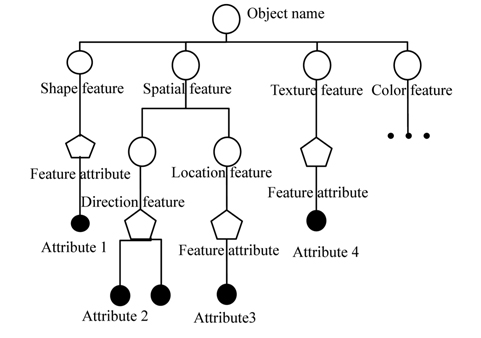
According to MPEG-7 standards and the object-oriented concept, the object-level feature representation model for image data is described as a structural tree via layers [33]. As Fig. 6 shows, the first layer is the object name, while the second layer is the feature name of the feature information that the object contains. Further down are the layers for sub-features, feature attributes, attribute values, etc. Constructing this structural tree is convenient for indexing feature information.
The overall model of the feature image can be represented by a formal method, as follows:
where,
We adopt the centroid-radii model
Through this model, we can express the content of multiple targets in an image by using multiple records to represent a single object, such as color, shape, and texture features. Then, a logical expression is implemented by the spatial relationship among objects. Thus, we transform the MTR problem into a record-querying problem to enable the image indexing technology to further accelerate target retrieval in CBRSIR.