A gas chromatography/ mass spectrometric (GC/MS) method was developed as a candidate reference method for the accurate determination of essential fatty acids (linoleic acid, α- and γ-linolenic acids) in food supplemental oil products. Samples were spiked with three internal standards (stearic acid-d35, 13C18-linoleic acid, and 13C18-α-linolenic acid). Samples were then subject to saponification, derivatization for methylation, and extraction by organic solvent. For GC/MS measurement, an Agilent HP-88 column, designed for the separation of fatty acid methyl esters, was selected after comparing with other columns as it provided better separation for target analytes. Target analytes and internal standards were detected by selected ion monitoring of molecular ions of their methyl ester forms. The GC/MS method was applied for the measurement of three botanical oils in NIST SRM 3274 (borage oil, evening primrose oil, and flax oil), and measurement results agreed with the certified values. Measurement results for target analytes which have corresponding isotope-labeled analogues as internal standard were calculated based on isotope dilution mass spectrometry (IDMS) approach, and compared with results calculated by using the other two internal standards. Results from the IDMS approach and the typical internal standard approach were in good agreement within their measurement uncertainties. It proves that the developed GC/MS method can provide similar metrological quality with IDMS methods for the measurement of fatty acids in natural oil samples if a proper fatty acid is used as an internal standard.
Interest on polyunsaturated fatty acids has increased during the last decade as they are important essential nutrients in human and widely used for nutritional and medical purpose.1 Therefore, many food supplemental products based on botanical oils and fish oils are commercially available. Recently, food supplemental products based on borage oil, evening primrose oil, and flax oil became increasingly popular as they are known to be rich with essential fatty acids, such as linoleic acid, α- and γ-linolenic acids.2 However, contents of essential fatty acids in those commercial products were disputable in many cases. For this reason, reliable analytical methods are required for the purpose of quality control and product-labeling regulations.
Gas chromatography/mass spectrometry (GC/MS) has been widely used for the analysis of fatty acids in natural oils and food-matrices.3- 5 It requires saponification of sample to release fatty acid from lipid forms and derivatization to fatty acid methyl ester (FAME) forms. High performance liquid chromatography (HPLC) system has been also used for the fatty acid analysis, but it also requires phenacyl derivatization to improve chromatographic retention and separation.5,6 Later, LC/MS was also applied for the fatty acid analysis.7,8 However, GC/MS is still preffered for fatty acid analysis in terms of ease of use and high chromatographic separation.
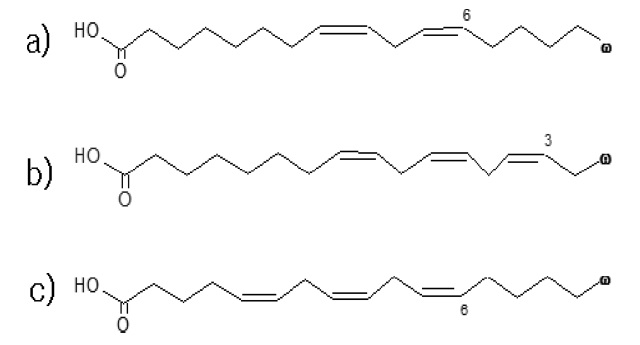
In this study, we established a GC/MS method for the accurate determination of essential fatty acids belonging to ω-3 and ω-6 groups (linoleic acid, α- and γ-linolenic acids) in botanic oils. Figure 1 shows chemical structures of those target analytes. This laboratory, the national metrology institute of Korea, usually chooses isotope dilution mass spectrometry (IDMS) as a prior reference method for quantitative analysis of organic compounds in complex matrices, as the method is capable of overcoming difficulties encountered in correction of recovery in sample preparation processes and demonstrates high accuracy and repeatability.9,10 However, only a few isotope-labeled essential fatty acids are commercially available so that all essential fatty acids cannot be analyzed by the IDMS approach. In this study, we utilized available isotope-labeled essential fatty acids (stearic acid-
13C18 -α-linolenic acid) as internal standards. We compared measurement results with using the three individual internal standards to figure out if a non-IDMS approach with using isotope-labeled analogues of other fatty acids can provide similar metrological quality with the IDMS approach.
Pure substances for linoleic acid, α- and γ-linolenic acids were purchased from Sigma-Aldrich (≥99% , St. Luis, MO, USA). Stearic acid-
>
Calibration Standard Solutions
A standard solution containing the three target analytes (1000 mg/kg level in
0.1 g of oil sample was taken into a bottle and gravimetrically diluted by adding appropriate amount of
The GC/MS system used in this study was an Agilent GC/MSD (model No. 5973, Palo Alto, CA, USA). In the initial stage of this study, a non-polar DB-5MS colum (J & W Scientific, length 60 m, i.d. 0.25 mm, thickness 0.25 μm), a polar DB-1701 column (J & W Scientific, length 60 m, i.d. 0.25 mm, thickness 0.5 μm), and a HP-88 FAMEs column (Agilent, length 60 m, i.d. 0.25 mm, thickness 0.2 μm) were tested for their chromatographic performance for FAMEs analysis. The HP-88 column was chosen and used throughout this study [see results and discussion section]. Helium was used as carrier gas at a flow rate of 1.0 mL/min. Its injection port was kept at 250 ℃ in splitless mode. The temperature of the GC oven started at 180 ℃ and maintained for 25 minutes and was ramped to 230 ℃ at the rate of 20 ℃/min and held for 10 minutes. The interface to the mass spectrometer was maintained at 250℃.
The mass spectrometer was operated under electron impact ionization condition with a source temperature of 250℃. For roughly screening samples, scan mode was used. For quantitative analysis, the MS was operated in selected ion monitoring (SIM) mode with detecting molecular ions of methylated ester forms of linoleic acid at
For the calculation of GC/MS measurement results, the equation used for IDMS methods can be found in our previous articles.12,13
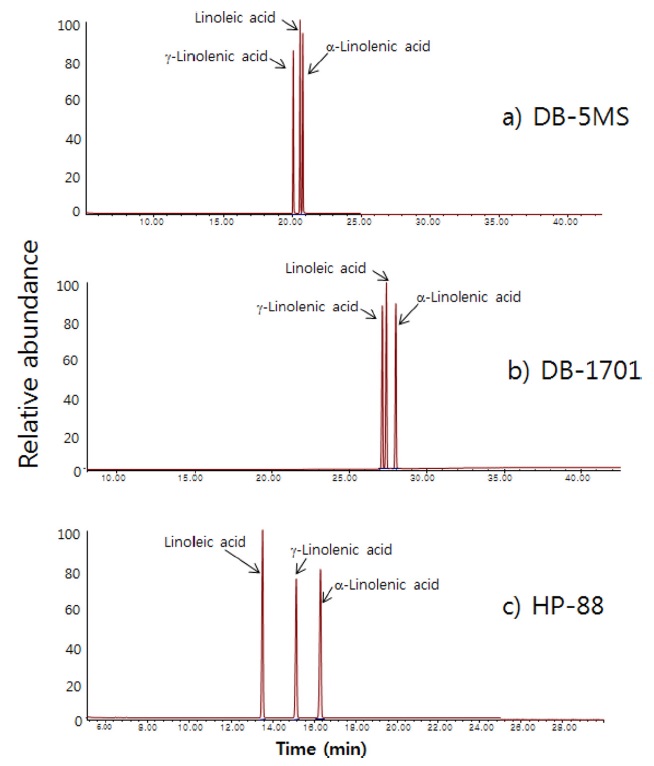
Figure 2 shows chromatograms of a standard solution containing the three target analytes from using three different GC columns. In cases of the non-polar DB-5MS column and the polar DB-1701 column, the three analytes are congested in a narrow time zone and at least two of three analytes are slightly overlapped. In the case of the HP-88 FAMEs column which was specially designed for FAMEs analysis, the three analytes are well separated. Therefore, we chose the HP-88 FAMEs column to be used for the analysis of essential unsaturated fatty acids.
>
Screening of Three Botanical Oil Samples
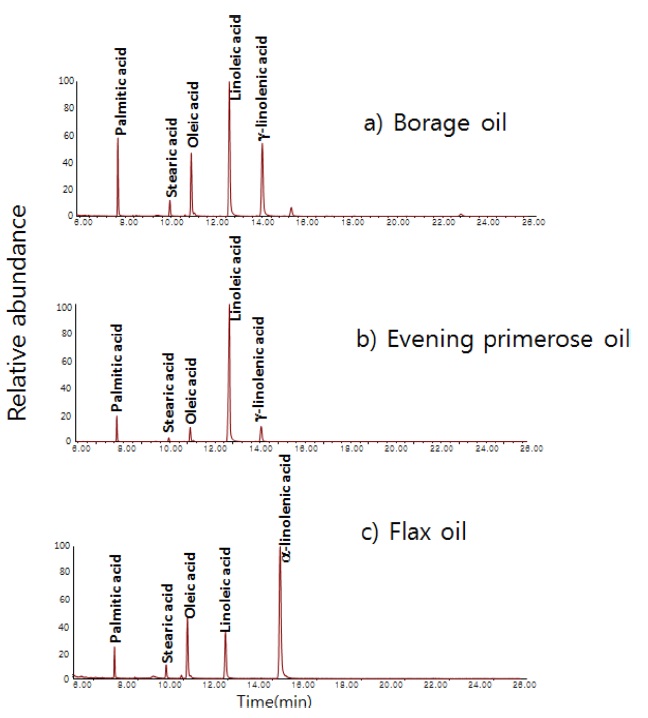
Three botanic oil products included in NIST SRM 3274 (borage oil, evening primrose oil, and flax oil) were tested by the GC/MS method (in scan mode) to survey the overall contents of fatty acids in those products. Figure 3 shows total ion chromatograms of the three oil samples. Five fatty acids were dominant in those oil products. All three botanic oils contained linoleic acid as a dominant component. γ-Linolenic acid was detected as a dominant component in borage oil and evening primrose oil, but it was a minor component in flax oil. α-Linolenic acid was dominant in flax oil while it was a minor component in borage oil and evening primrose oil.
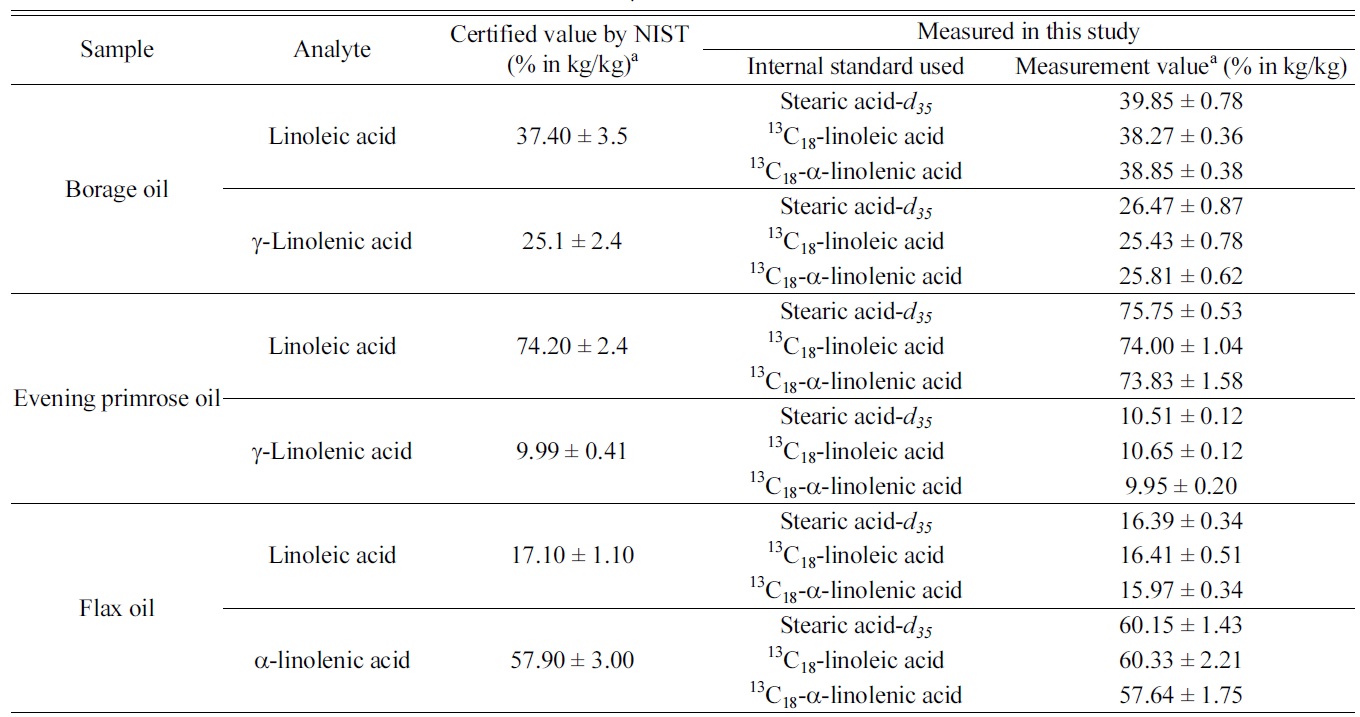
Among the three target analytes, we decided to determine only the dominant components in each oil samples. Table 1 summarizes the measurement results of the three target analytes in
those botanical oils. The certified values listed in the table were obtained by NIST from their GC/MS method with using stearic acid-
[Table 1.] Measurement results of linoleic acid, α-linolenic and γ-linolenic acid in NIST SRM 3274
Measurement results of linoleic acid, α-linolenic and γ-linolenic acid in NIST SRM 3274
samples. It is noticeable that results from IDMS method and those from internal standard method are in good agreement and provides similar degree of measurement uncertainties. As γ-linolenic acid does not have isotope-labeled analogues as internal standard in this study, measurement results were calculated using the three individual internal standards. Results of γ-linolenic acid from using all three internal standards agreed to each other within their uncertainties.
We developed a GC/MS method for the accurate determination of fatty acids in oil samples. Validity of the method was evaluated by comparing measurement results of NIST SRM with the certified values. Also the method was further evaluated by comparing results calculated by the IDMS approach and those from the typical (non-IDMS) internal standard approach. Results from the two approaches with the GC/MS method were in good agreement within their uncertainties. It proves that the developed GC/MS method can provide similar metrological quality with IDMS methods for the measurement of fatty acids in natural oil samples if a proper fatty acid with similar chemical and physical properties with target analytes is used as an internal standard. We note that this conclusion may be limited to the application of the method to refined natural oils which have relatively simple matrices. Further test may be required to apply the non-IDMS method to samples with more complex matrices.