Strong restrictions on emissions from marine power plants (particularly SOx, NOx) will probably be adopted in the near future. In this paper, a combined solid oxide fuel cell (SOFC) and gas turbine fuelled by natural gas is proposed as an attractive option to limit the environmental impact of the marine sector. It includes a study of a heatrecovery system for 18 MW SOFC fuelled by natural gas, to provide the electric power demand onboard commercial vessels. Feasible heat-recovery systems are investigated, taking into account different operating conditions of the combined system. Two types of SOFC are considered, tubular and planar SOFCs, operated with either natural gas or hydrogen fuels. This paper includes a detailed thermodynamic analysis for the combined system. Mass and energy balances are performed, not only for the whole plant but also for each individual component, in order to evaluate the thermal efficiency of the combined cycle. In addition, the effect of using natural gas as a fuel on the fuel cell voltage and performance is investigated. It is found that a high overall efficiency approaching 70% may be achieved with an optimum configuration using SOFC system under pressure. The hybrid system would also reduce emissions, fuel consumption, and improve the total system efficiency.
CH4 Methane
CO2 Carbon dioxide
CO Carbon monoxide
ECA Emission control area
EXCO External cooler
F Faraday's constant coulomb/mole
GT Gas turbine
H2 Hydrogen
H2O Water vapor
HFO Heavy fuel oil
HPT High pressure turbine
IMO International maritime organization
INEX intermediate expansion
LNG Liquefied natural gas
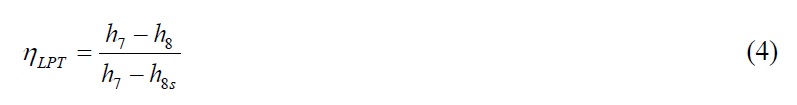
LPT Low pressure turbine
MARPOL Marine pollution prevention convention

Mass flow rate,

Total input fuel flow rate,

Required fuel flow rate for solid oxide fuel cell stack,

Combustor added fuel flow rate,
NG Natural gas
NOx Nitrogen oxides emissions
O2 Oxygen gas
PM Particulate Matter
PSOFC Planar SOFC
PSOFC-IR Planar SOFC-NG internal reforming
SOFC Solid oxide fuel cell
SOFC-GT Solid oxide fuel cell and gas turbine combined cycle
SOFCPP Solid oxide fuel cell power plant
TSOFC Tubular SOFC
TSOFC-IR Tubular SOFC-NG internal reforming
Δ
Ships are responsible for 15% of global NOx emissions, 6% of global sulphur emissions and 2% of CO2 emissions from fossil fuels. In addition, they are accountable for some 5-10% of acid rain in coastal regions (Corbett et al., 2007; Figari et al., 2011). Both national authorities and international organizations develop many restrictive regulations to reduce emissions from ships. Now the rate of emissions is an important factor in the selection of power plants to cope with the international requirements.
The International Maritime Organization (IMO) has introduced greenhouse gas (GHG) emission reduction in its agenda since 1995. The IMO has adopted two different emission indexes for a vessel: the Energy Efficiency Design Index (EEDI) and the Energy Efficiency Operational Indicator (EEOI). Both indexes represent the ratio between emissions, in mass of CO2, and the quantity of transported cargo per sailed distance. Regulations were adopted as an amendment to MARPOL Annex VI in October 2010 (Figari et al., 2011; Greensmith, 2010).
As from January 2012, the IMO requirements for maximum sulphur content in any fuel used onboard ships were reduced from 4.5% to 3.5%. Also, from January 2020 sulphur content should not exceed 0.5% (Greensmith, 2010).
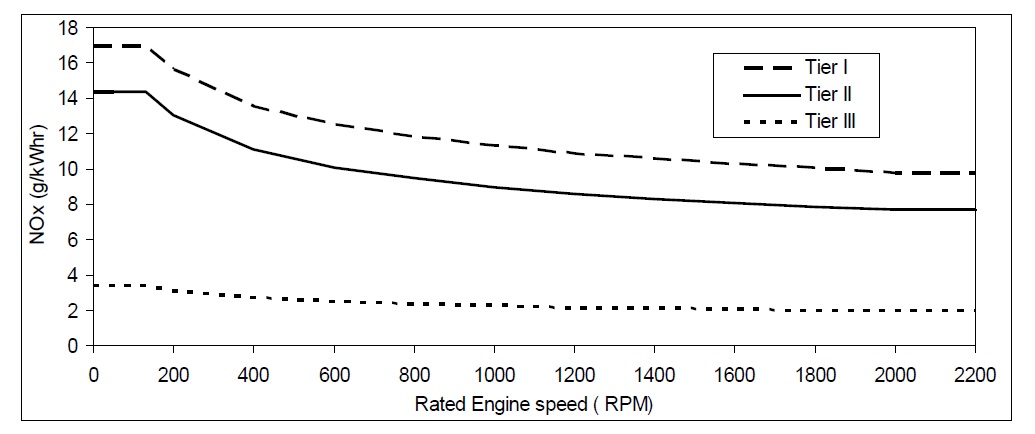
In addition, IMO has issued regulations limiting NOx levels from marine diesel engines as shown in Fig. 1. These regulations include: Tier I for ships constructed from Jan. 2000 to Dec. 2010, Tier II for ships constructed from Jan. 2011 to Dec. 2015, and Tier III for ships constructed from Jan. 2016 onwards when in a NOx emission control area (ECA) (Greensmith, 2010).
>
Meeting emission regulations
The options for compliance with IMO new regulations according to Lloyd’s Register (Farr, 2011) include the use of low sulphur fuels/distillates, HFO with a scrubber, LNG, or other alternative fuels. Lloyd’s Register considers all options as feasible, but choice depends on commercial considerations including trading pattern and percentage of time in ECA’s, cost difference and pay-back time, availability of exhaust gas cleaning technologies, and availability of LNG infrastructure. According to ship owner survey made by Lloyd’s Register about options for mitigating emissions, most owners consider LNG as the fuel most likely to provide the long term solution.
Germanischer Lloyd (GL) sees large market for fuel cells to replace marine auxiliary power. The installed auxiliary power onboard seagoing vessels has a potential market of approximately 160
>
Natural gas and fuel cell opportunities in the marine field
Natural gas (made up of 70-90% methane) is often highlighted as the cleanest fossil fuel alternative of the diesel oil used for marine internal combustion engines. The cleanliness of LNG fuel is easy to appreciate when one notes it yields 100% reductions in SOx and Particulate Matter (PM) and 92% reduction in NOx as compared to diesel fuel. LNG also results in a 25% reduction in CO2, a major contributor to greenhouse gas (GHG) emissions. The net greenhouse gas (GHG) reduction is achieved when methane slip is factored in (MAN B&W, 2010).
Fuel cells (FCs) are electrochemical devices which convert the chemical fuels directly into electrical power. The Solid Oxide Fuel Cells (SOFCs) are among the high temperature fuel cells. They consist of a solid oxide electrolyte made from a ceramic such as yttria-stabilized zirconia (YSZ) which acts as a conductor of oxide ions at temperatures from 600 to 1000°C. This ceramic material allows oxygen atoms to be reduced on its porous cathode surface by electrons, thus being converted into oxide ions, which are then transported through the ceramic body to a fuel-rich porous anode zone where the oxide ions can react with hydrogen or hydrogen rich gases giving up electrons to an external circuit. Therefore, SOFC can be operated either by hydrogen or hydrocarbon reformed fuels (Welaya et al., 2011; Santin et al., 2010; Barclay, 2006). The North Western University US patents on direct hydrocarbon oxidation, which deal with special catalysts and anodes, give the SOFC system the potential to use natural gas directly. This improves the opportunity to bypass the hydrogen fuel source problem (Barclay, 2006; Lisbona and Serra, 2005).
The high cost of SOFC systems is the principal obstacle to their successful commercialization. The installed capital expense (CAPEX) of
In this paper a parametric study on a solid oxide fuel cell has been conducted and the effect of different parameters on the SOFC performance has been investigated. Also the total performance of a combined solid oxide fuel cell and a gas turbine is discussed.
The integration of a SOFC stack operated with natural gas with GTs and other conventional devices, such as compressors and heat exchangers, will improve the system efficiency. In addition, it will reduce the exhaust gas emissions to an acceptable level by the international marine regulations.
>
NG and SOFC in classification societies and regulations
It is a characteristic of marine fuels and equipment to be approved by one of the International Association of Classification Societies (IACS). Classification societies accepted NG as the only gas that can be used onboard. Det Norske Veritas (DNV), China Classification Society, and Lloyd’s Register (LR) have regulations for natural gas driven ships to improve the safety onboard. The International Gas Code (IGC) (IMO-IGC Code, 2002; China classification society, 2006) provides the general arrangement; gas piping systems, fire detection alarm, gas control, monitoring systems and working pressure in the engine room.
In addition, the American Bureau of Shipping (ABS) has recently released a guide for propulsion and auxiliary systems for Gas Fueled Ships (GFS). Its objectives are to provide criteria for arrangements, construction installation and operation of machinery, equipment and systems for vessels operating with natural gas as a fuel in order to minimize risk to the vessel, crew and environment (MAN B&W, 2010).
The first rules for using fuel cells were introduced by the Germanischer Lloyd (GL) in 2003, together with the International Gas code (IGC) development. In addition, Det Norske Veritas (DNV), Bureau Veritas (BV) and other classification societies are working hard to develop rules for using fuel cells in the marine field (Rattenbury and Fort, 2006).
As mentioned before, the solid oxide fuel cell (SOFC) is considered as one of the most promising options for marine applications to achieve IMO emission requirements. SOFC can use natural gas directly as a fuel. For the near future, fuel cells can replace the diesel generator. The 18
[Table 1] 500 kW SOFC model parameters.
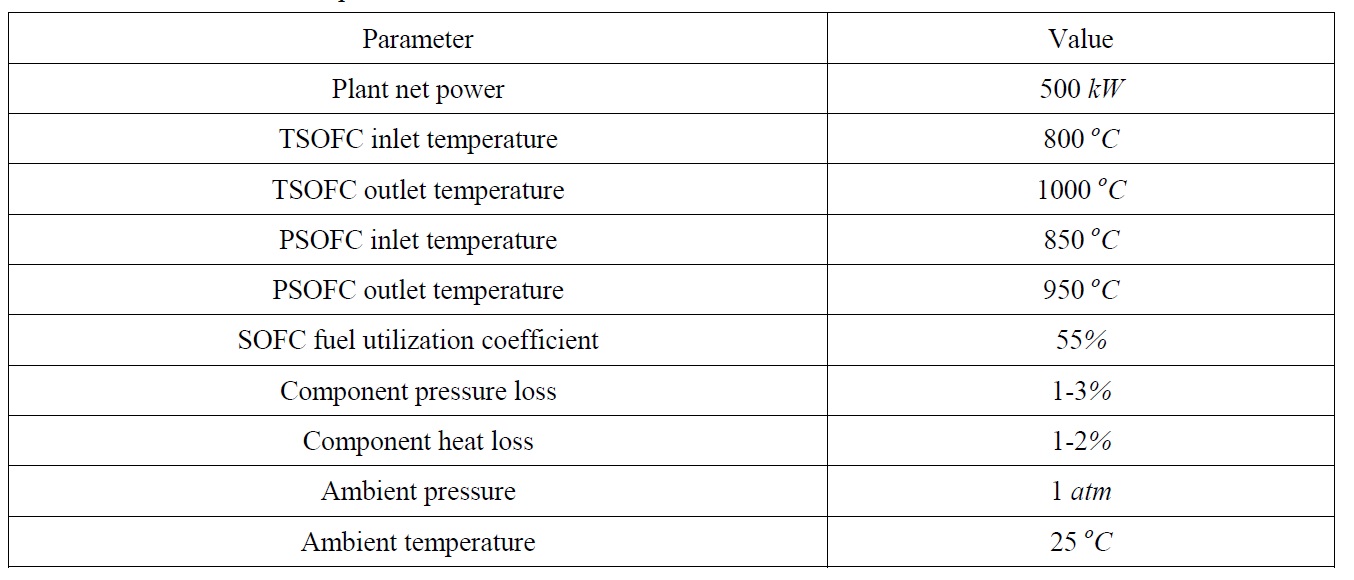
500 kW SOFC model parameters.
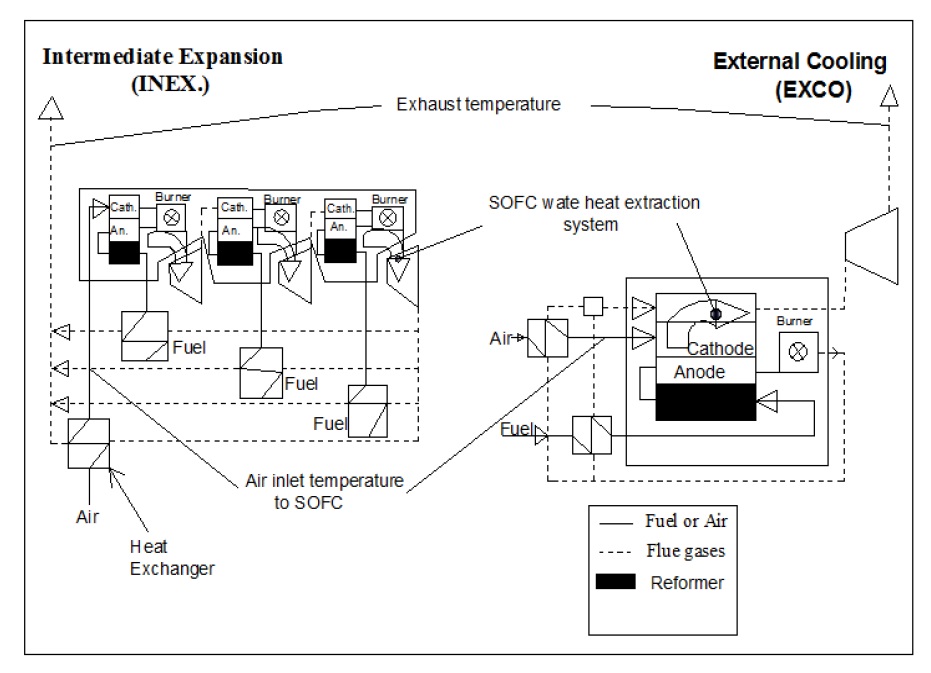
There are two methods of integrating SOFC modules with gas turbines. The integration process not only produces additional power, but also helps in maintaining SOFC operating temperature through cooling of SOFC. Any successful cooling strategy for SOFC of a SOFC-GT system must avoid high excess air at the system outlet. There are two options for cooling, intermediate expansion (INEX) or external cooler (EXCO). In the intermediate expansion (INEX), SOFC module is divided into sub-modules and the heat of the SOFC module is extracted by cooling the waste air of the first sub-module to the inlet temperature of the cathode of the following sub-module by the power generated by a GT. It can be carried on until the last GT delivers the waste gas for the heat exchangers (HEX) to heat the air and fuel. The other strategy is the SOFC cooling by an external cooler (EXCO) fed with the flue gas that has been cooled by heating air and fuel. The SOFC module is the heat source for the GT cycle and air is heated by the flue gas as in the generalized model. The main differences between INEX and EXCO are indicated in Fig. 2 (Subhash and Kevin, 2004; Winkler, 1998; 1999).
Solid oxide fuel cell voltage (

where,
Eo is the open circuit voltage = 1.01 V
A is the slope of Tafel curve = 0.002 V
r is the specific resistance =2.0× 10⁻³ kΩcm2
m and n are constants =1.0 × 10⁻⁴ V and 8× 10⁻³ cm2 mA-1 respectively
SOFC-GT HYBRID SYSTEM DESCRIPTION
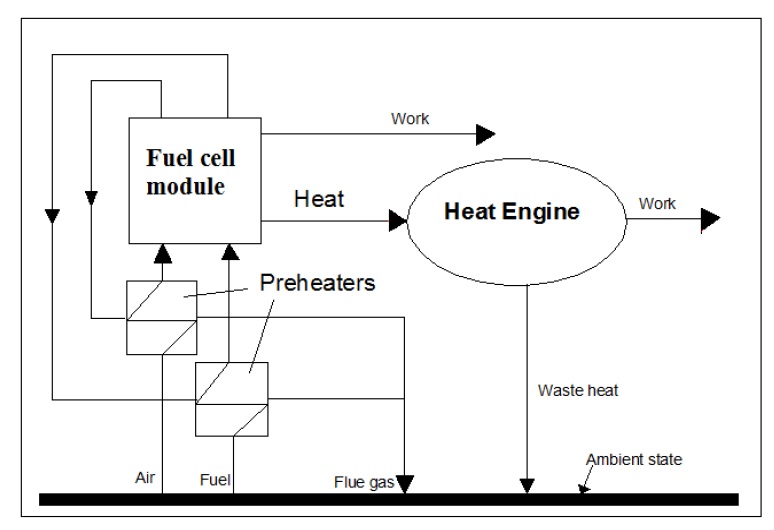
The main principles of combining fuel cell and heat engines depend on the waste heat from the fuel cell. Some of the waste heat will be used to heat the reactants to the required operating temperature. The remaining heat can be used to operate a heat engine. So, the total work of this system will be the summation of fuel cell and heat engine work as shown in Fig. 3 (Barclay, 2006; Subhash and Kevin, 2004; George, et al. 2001).
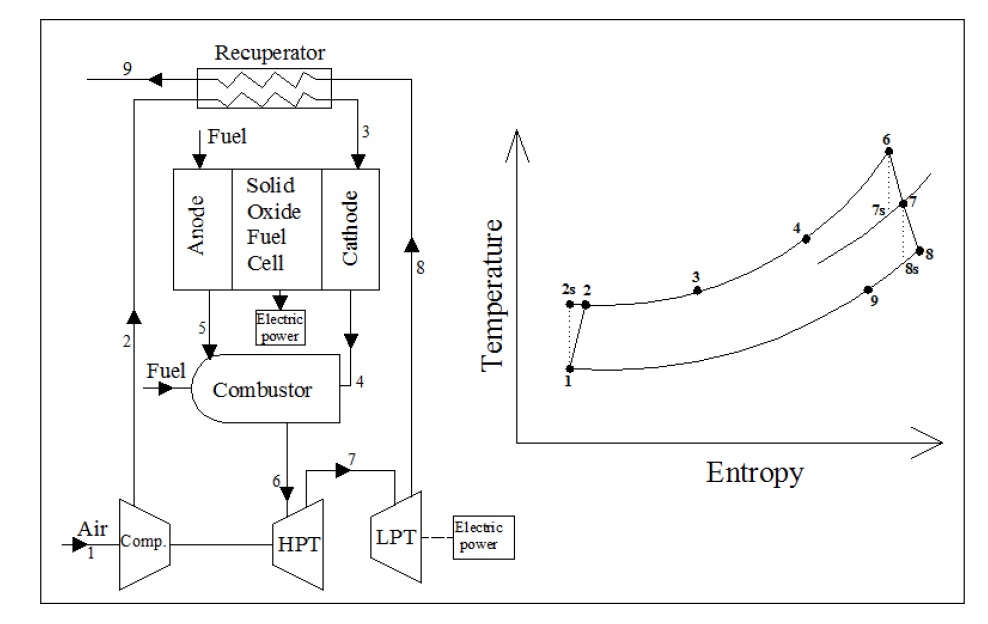
In SOFC-GT combined cycle, the air flow to the SOFC is compressed with a gas turbine compressor. The flow then passes through a countercurrent, recuperative heat exchanger to recover heat from the combustion product gases leaving the gas turbine. The air and the fuel streams then pass into the cathode and anode compartments of the fuel cell. The air and fuel streams leaving the cell enter the combustor where they mix and the residual unused fuel burns. The combustion products enter the high and low pressure turbines, expand, and generate additional power. The low pressure turbine exhaust gases pass through the recuperative exchanger to heat SOFC’s stack inlet air as shown in Fig. 4 (EG&G Technical Services, 2004; Ghirardo, et al. 2011).
ENERGY FORMULATION OF COMPONENTS
The thermodynamic performance of each of the components introduced in the preceding section will be analyzed here. The mass and energy balance are employed under the assumption of steady flow for the entire cycle. The main stream of the working fluid, assumed as ideal gas, at different states of the cycle is shown in Fig. 4.
>
Compressor, high pressure turbine, and low pressure turbine
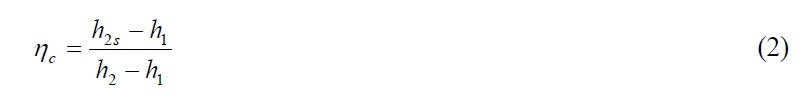
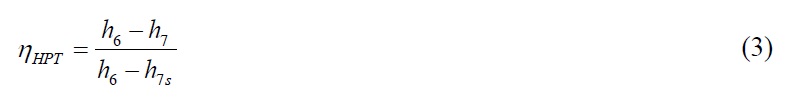
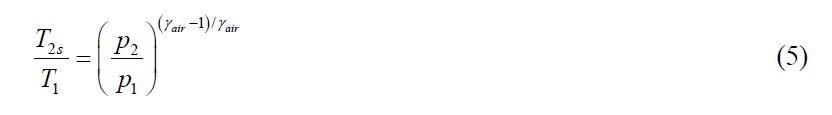
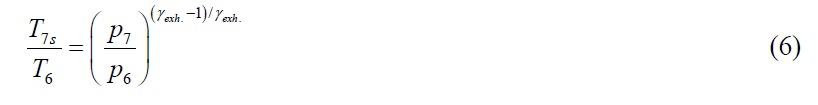
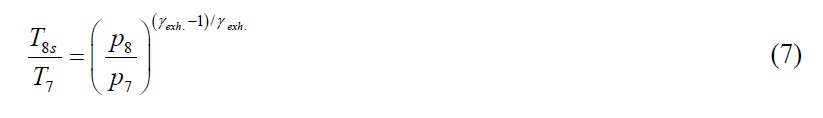
The required power for the compressor is provided by the high pressure gas turbine as shown in Fig. 4. The isentropic efficiencies of the compressor, high pressure turbine, and low pressure turbine can be defined as:
where the ideal temperatures of the working fluids at the outlets can be determined using the following equalities.
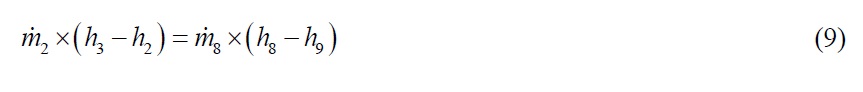
The effectiveness of the recuperator is described as:
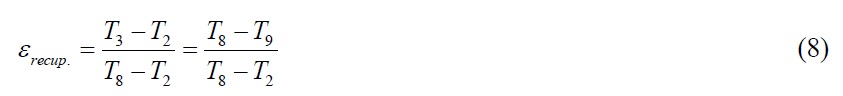
Using the following energy balance equation, the outlet enthalpy of the cycle can be determined:
The fuel supplied to the system is methane (CH4), with a lower heating value of 50


The degree to which an anode supports direct oxidation will then impact the degree of pre-reforming of the fuel that is required, which in turn typically impacts the balance of plant complexity and cost (Subhash and Kevin, 2004; EG&G Technical Services, 2004). The net cell reaction is thus written as:

And the net cell reaction for hydrogen as a fuel is as follows:

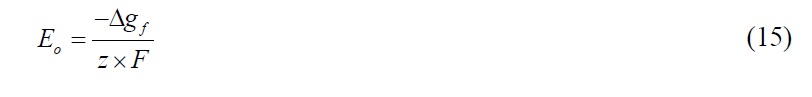
The maximum electrical work obtainable in a fuel cell operating at constant temperature and pressure is given by the change in Gibbs free energy ( Δ
So, the efficiency of fuel cell can be expressed as
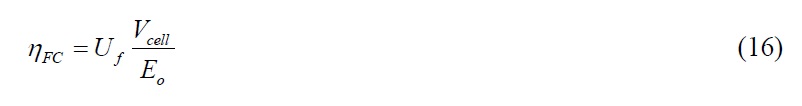
where,
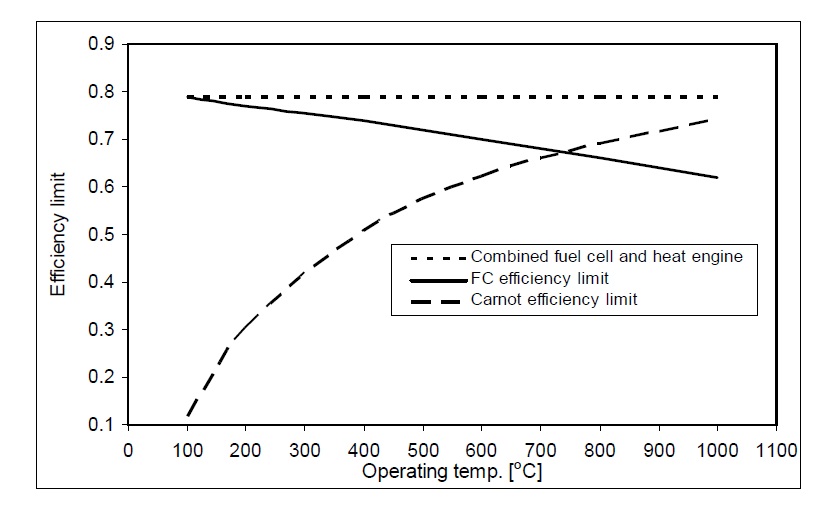
Efficiency limit for heat engines such as steam and gas turbines can be calculated using Carnot efficiency limit which shows their maximum efficiency, but fuel cells are not subject to the Carnot efficiency limit. It is commonly supposed that if there are no ‘irreversibilities’, the efficiency could reach 100%. Fig. 5 shows Carnot efficiency for heat engines, fuel cell efficiency limit, and fuel cell-heat engines combined cycle maximum efficiency (Larminie and Dicks, 2003).
The mass balance for SOFC system gives:
where,
The last term on the right hand side of the above equality represents the non-reacted mass flow rate that leaves the fuel cell downstream of the products. Applying the first law of thermodynamics to the SOFC and assuming an adiabatic process,

The working fluid of the cycle, with products from the fuel cell, is further heated within the combustor. Considering that non-reacted flow of fuel from the SOFC is burnt in the combustor in addition to the small amount of fuel added

and applying the mass balance for combustor gives:
Applying the first law of thermodynamics for the combustor we get:

where, comb.
>
Overall balance equations for integrated cycle
The integrated gas turbine power plant with SOFC in Fig. 4 may be analyzed as a lumped control volume. In the following, mass balance as well as the first and second laws of thermodynamics can be derived from the above mentioned control volume.
The mass balance for the total system can be written as:


Overall energy balance can be expressed as:

where,
The combined cycle efficiency can be expressed as:
where,

The gas turbine cycle efficiency can be expressed as:
This study assumes 55% utilization coefficient of fuel in the cells. Table 2 summarizes the data of different auxiliary system components utilized in the combined SOFC-GT plant.
[Table 2] Auxiliary system component data for SOFC-GT plant.
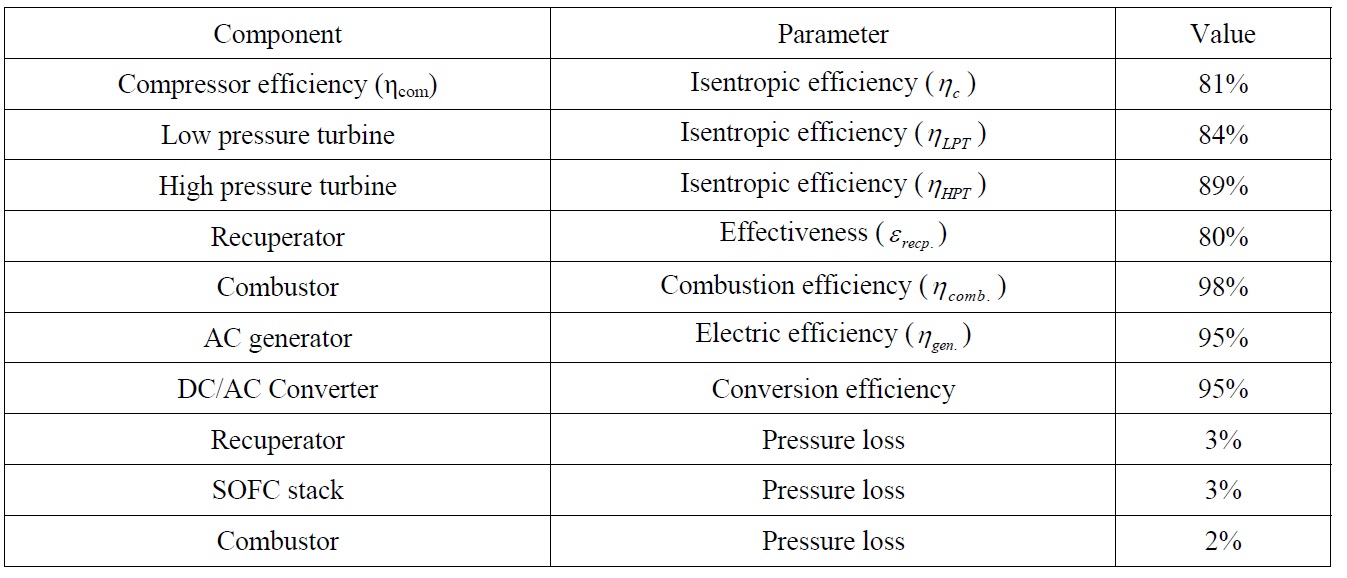
Auxiliary system component data for SOFC-GT plant.
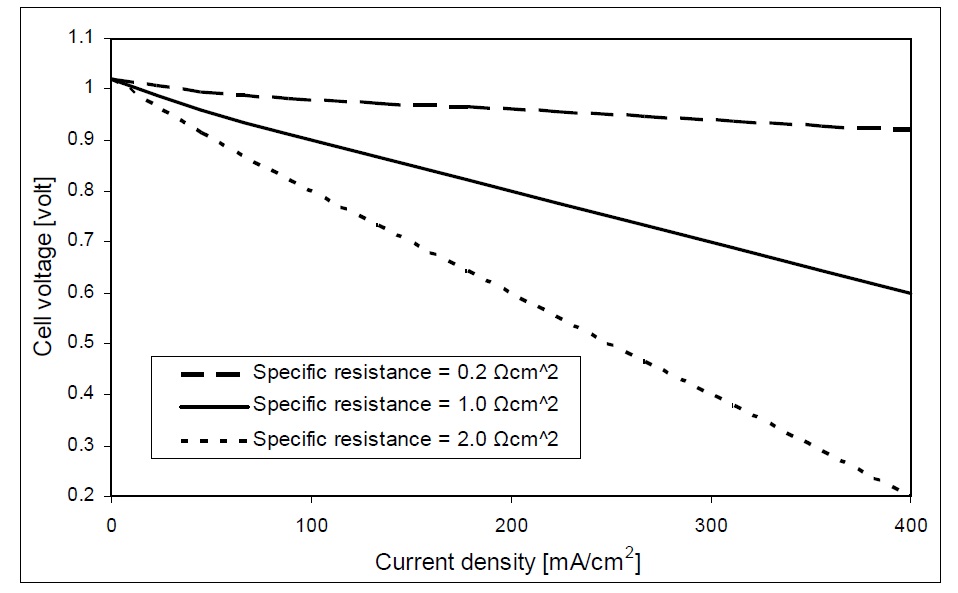
The performance of a solid oxide fuel cell stack is usually described by the polarization curve, which relates the cell voltage to its current density. This polarization curve is affected by the losses of the fuel cell.
Fig. 6 shows the polarization curve of the SOFC case study. As the cell current increases from zero, there will be a drop of the output voltage of the SOFC. This drop of the cell voltage is due to activation voltage loss. Then, almost a linear decrease of the cell voltage is seen as the cell current increases beyond certain values, as shown in Fig. 6, which is a result of the ohmic loss. Finally, the cell voltage drops sharply to zero as the load current approaches the maximum current density that can be generated by the fuel cell. The sharp voltage drop is the effect of the concentration loss in the fuel cell.
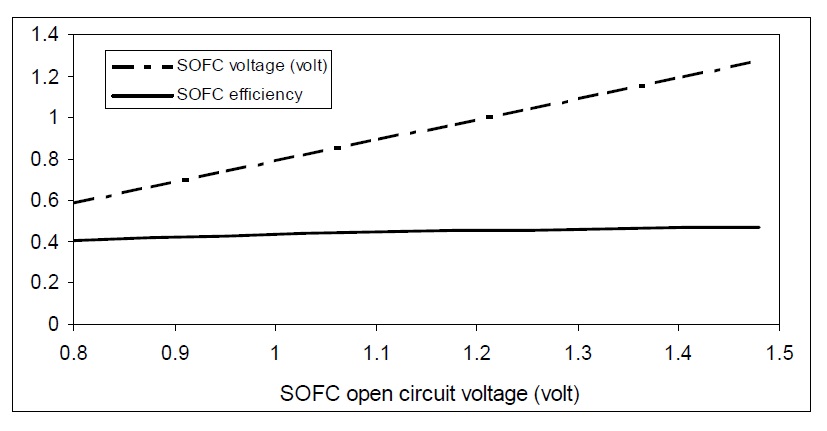
Prediction of the maximum available voltage from cell process involves evaluation of energy differences between the initial states of reactants in the fuel cell process. Open circuit voltage of SOFC plays an important role in the cell performance. Fig. 7 shows the effect of changing open circuit voltage on SOFC operational voltage and efficiency. As the open circuit voltage increases, the SOFC operational voltage will be increased which improves the cell efficiency
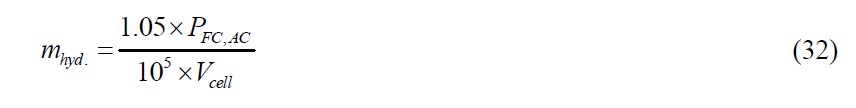
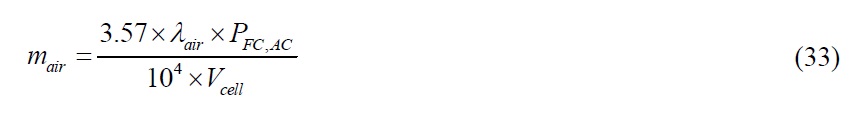
The required mass flow rates of hydrogen and air in
The required hydrogen mass flow rate can be expressed as:
The required air mass flow rate can be written as:
In addition, the hydrogen mass flow rate reacted in fuel cell can be written as:

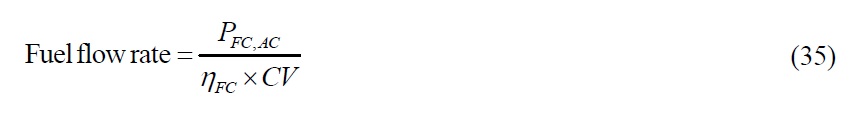
The hydrogen formula in Eq. (32) applies only to a hydrogen-fed fuel cell. In the case of a hydrogen/carbon monoxide mixture derived from a reformed hydrocarbon, it will be different. Eq. (35) shows the relationship between the efficiency of the fuel cell, the calorific value (
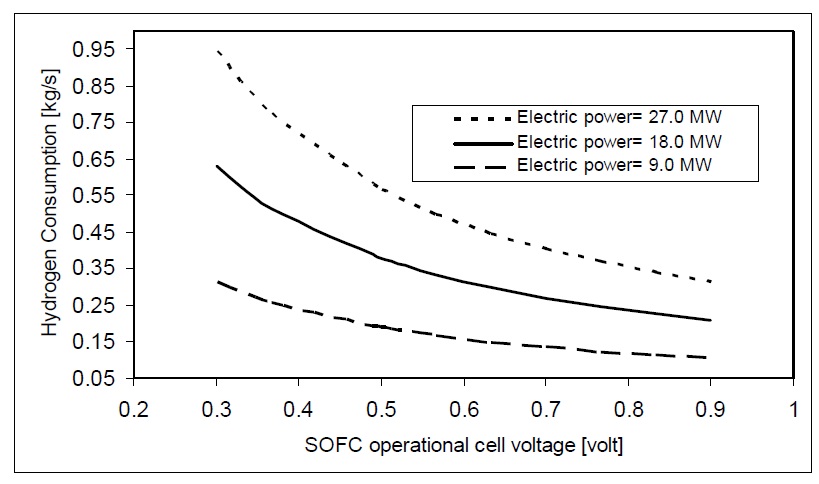
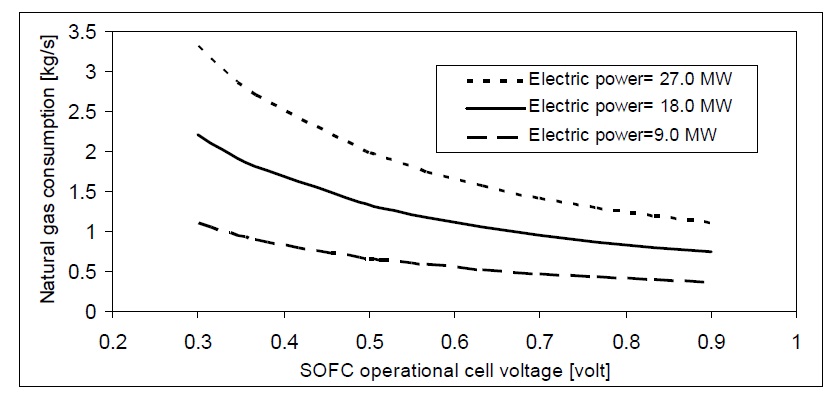
The value of fuel mass flow depends on fuel utilization coefficient and cell voltage for the SOFC. Figs. 8 and 9 show the effect of fuel cell voltage on the consumption of hydrogen and natural gas for different SOFC power plants. The higher voltage of the SOFC will correspond to higher SOFC efficiency. So, hydrogen and natural gas mass flow rates decrease as the SOFC voltage increases.
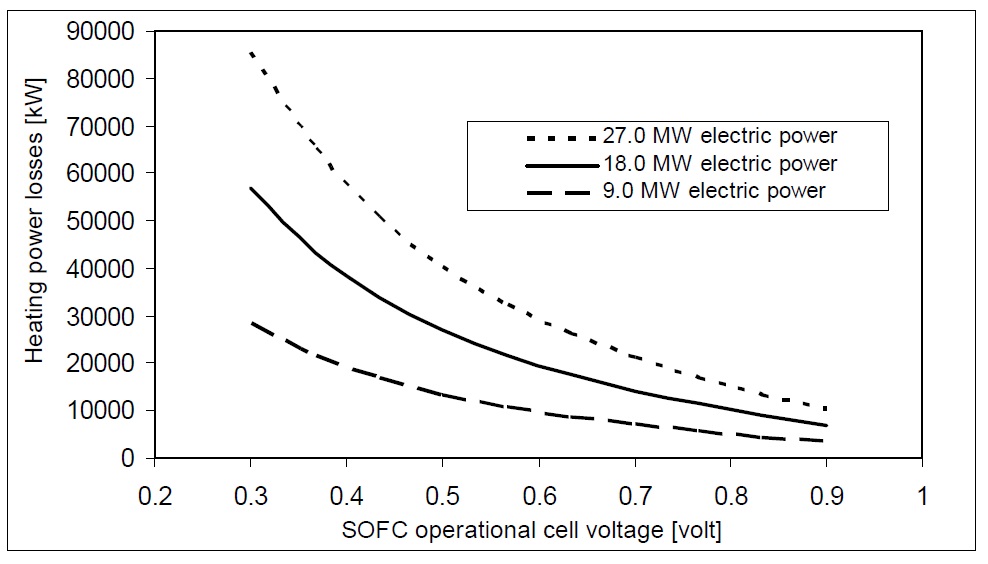
An essential aspect of SOFC design and application is the heat produced by the electrochemical reaction. Heat is inevitably generated in the SOFC by ohmic losses, electrode over potentials, etc. These losses are present in all designs and cannot be eliminated but must be integrated into a heat management system. Indeed, the heat is necessary to maintain the operating temperature of the cells. The benefit of the SOFC over competing fuel cells is the higher temperature of the exhaust heat which makes its control and utilization simple and economic. Fig. 10 shows the heating power losses from SOFC with cell voltage at different ranges of output power. SOFC heating power in
One of the great benefits of the SOFC is its capability to utilize a wide range of fuels. The fastest reaction at the nickel anode is that of hydrogen. But other fuels can also react directly on the anode, depending on catalyst composition. In this study two types of fuel are included, hydrogen and natural gas. Four layouts have been studied. They include tubular SOFC (TSOFC), and planar SOFC (PSOFC) using natural gas internal reforming and pure hydrogen fuels.
The selected operating point for the combined SOFC-GT cycle is at cell output current density of 250
In addition, the mass flow rate of the air used for SOFC-GT cycle depends on the type of fuel used. Air consumption for hydrogen fuel is 32.15
Also, the value of the inlet and outlet temperatures of SOFC depends on the type of SOFC modules. For TSOFC the temperatures are 1073
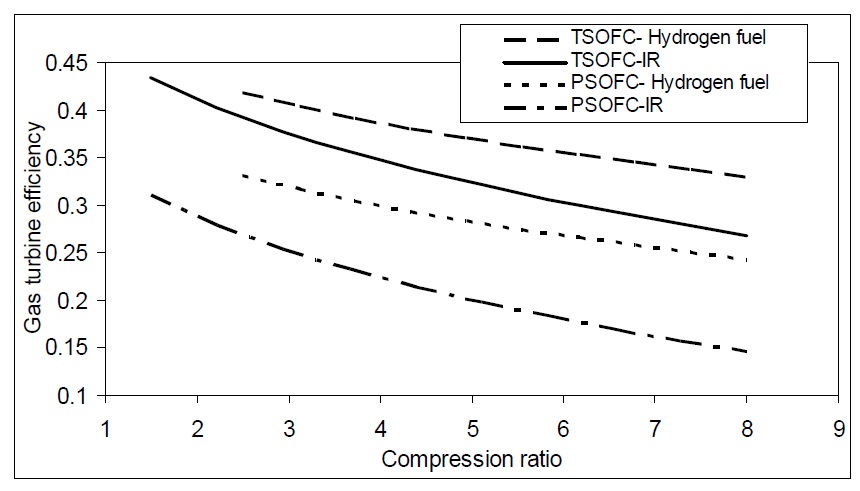
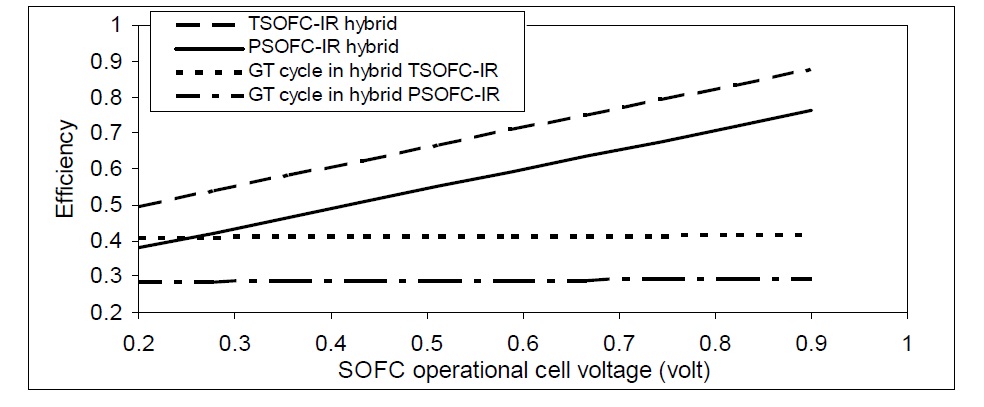
Fig. 11 shows the effect of compression ratio of gas turbine on gas cycle efficiency. The cases include planar and tubular SOFCs operated with natural gas incorporating internal reforming at the anode or hydrogen. Hydrogen operated SOFC has the maximum efficiency. Also, tubular SOFC has a higher efficiency than planar SOFC.
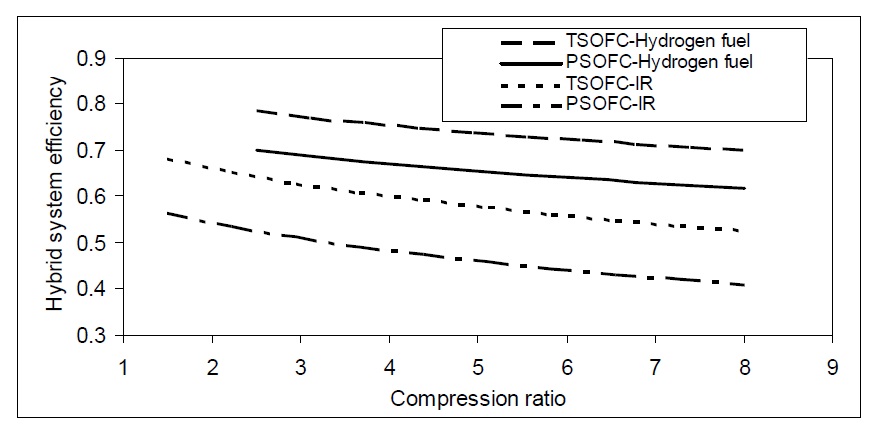
The combined cycle efficiency is affected by the type of fuel used. Hydrogen fuel has the highest hybrid efficiency over different compression ratios as shown in Fig. 12.
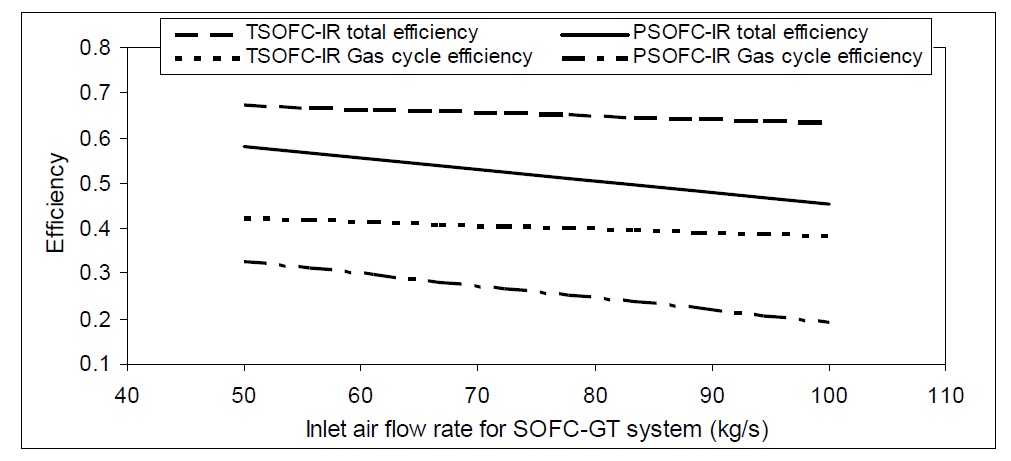
The mass flow rate of air used plays an important role in determining the efficiency of the SOFC-GT hybrid cycle. In addition, gas cycle efficiency decreases as inlet flow rate increases, as shown in Fig. 13. A gas cycle associated with TSOFC has higher efficiency at different inlet air flow rates than PSOFC gas cycle. Therefore, the TSOFC hybrid system with internal reforming achieves higher efficiency than PSOFC hybrid system.
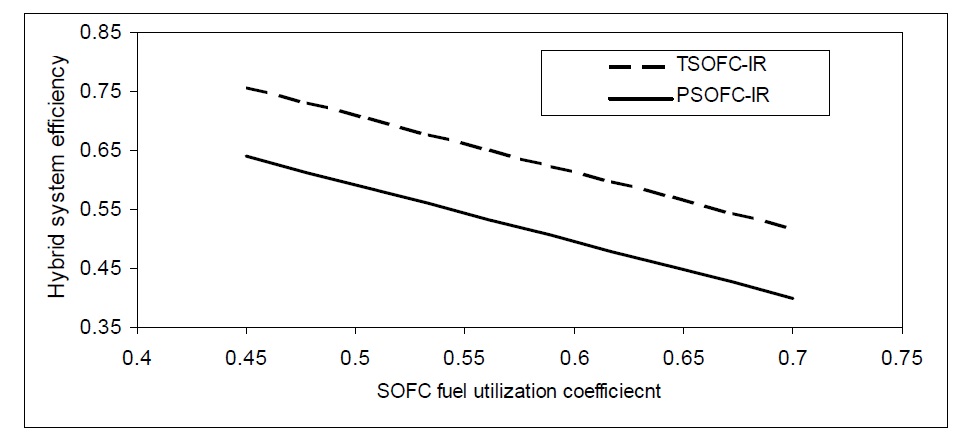
Fuel utilization coefficient not only affects SOFC performance, but also affects SOFC-GT hybrid system efficiency. At higher fuel utilization coefficients, the hybrid efficiency will be reduced for both TSOFC and PSOFC as shown in Fig. 14.
SOFC voltage determines the main characteristics of the cell. It also affects both the total hybrid system power and output power from the low pressure power turbine and required power for the compressor. Fig. 15 shows the variation of GT efficiency and hybrid system efficiency with natural gas internally reformed SOFC voltage.
In addition, the variation of SOFC voltage affects the total hybrid system efficiency as the efficiency of SOFC will be changed. On the other hand, the SOFC voltage variations have nearly no effect on the gas cycle efficiency, as shown in Fig. 16. The total hybrid SOFC-GT efficiency increases as the cell voltage increases.
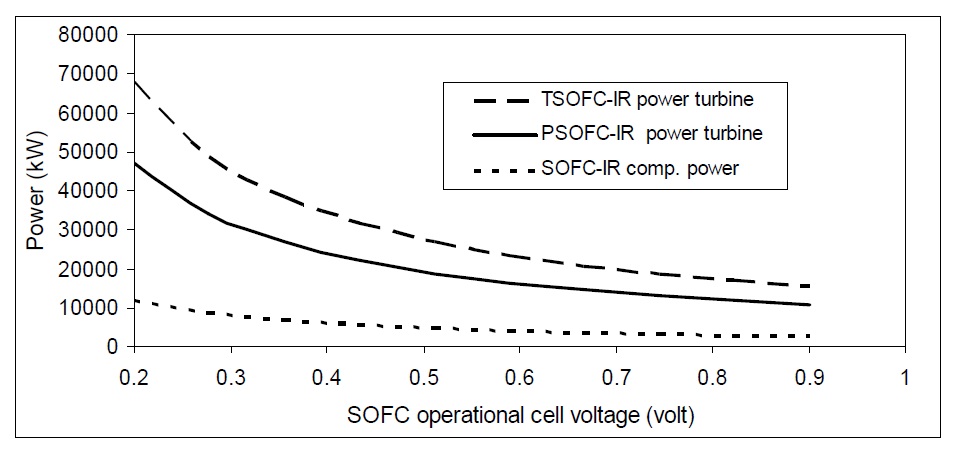
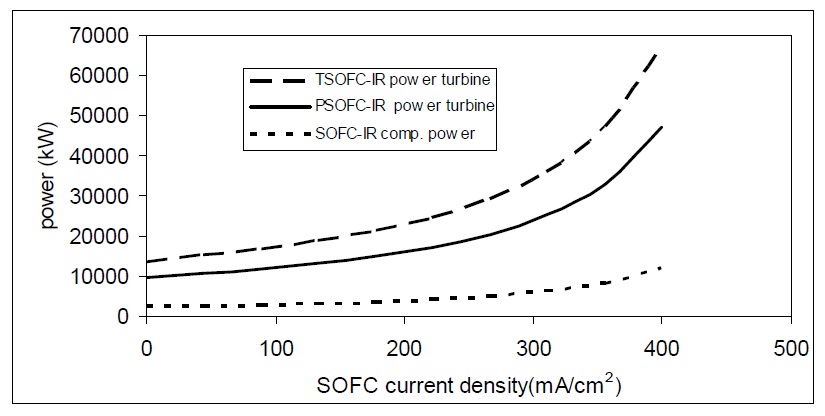
The variation of the output current density of SOFC changes the performance of both systems SOFC and the SOFC-GT. As the current density increases, the total hybrid system efficiency increases. On the other hand, current density has nearly no effect on gas turbine efficiency like cell voltage variation. It only affects SOFC efficiency. At high current density, SOFC voltage reduces highly and this reduction in voltage is converted into heat energy. So, at high current density, the power of both tubular and planar SOFC low pressure turbines is high as shown in Fig. 17.
The thermodynamic analysis of natural gas and hydrogen-fuelled SOFC was presented as a proposed solution to achieve high efficiency and satisfy the requirements of international regulations. Both TSOFC and PSOFC are integrated with gas turbine cycle to make use of the waste heat of the SOFC. Four layouts were studied, combining two SOFC modules with gas turbine operated either by natural gas, through internal reforming, or hydrogen. Thermodynamic principles are used to understand the process of energy conversion in SOFCs. The reversible work of a fuel cell is defined by the free or Gibbs enthalpy of the reaction. The mass flow of the consumed fuel is proportional to the electric current and the reversible work is proportional to the reversible voltage.
The parameters, which affect fuel cell performance, include the cell voltage, open cell voltage, fuel cell efficiency, and fuel utilization coefficient. The actual SOFC cell voltage can be taken as 0.801
The combination of a SOFC with GT has a high electric efficiency. The main parameters which affect SOFC-GT power plant are gas cycle compression ratio, inlet air mass flow rate, SOFC fuel utilization coefficient, cell voltage, and cell output current density. The SOFC-GT system is very suitable for high-efficiency power generation. At the operating point of 250
The paper only presents the thermodynamic analysis of the combined gas turbine with SOFC power plant system. It should be complemented by additional technical and economic analysis to fully justify the use of such combined systems in marine power plants.