The paper summarizes the irradiation test and post-irradiation examination (PIE) data for the U-Mo low-enriched fuel that was irradiated in the MIR reactor under the RERTR Program. The PIE data were analyzed for both full-size fuel rods and mini-rods with atomized powder dispersed in Al matrix as well as with additions of 2%, 5% and 13% of silicon in the matrix and ZrN protective coating on the fuel particles. The full-size fuel rods were irradiated up to an average burnup of ~ 60%235U; the mini-rods were irradiated to an average burnup of ~ 85%235U. The presented data show a significant increase of the void fraction in the U-Mo alloy as the U-235 burnup rises from ~ 40% up to ~ 85%. The effect of irradiation test conditions and U-235 burnup were analyzed with regard to the formation of an interaction layer between the matrix and fuel particles as well as generation of porosity in the U-Mo alloy. Shown here are changes in distribution of U fission products as the U-235 burnup increases from ~ 40% up to ~ 85%.
At present about seventy (70) mini-rods with different characteristics of the U-Mo particles dispersed in the pure Al matrix and the second batch of ~70 mini-rods containing different amounts of silicon in the Al matrix or having a protective coating on the U-Mo atomized powder have been irradiated in the MIR reactor.
About five hundred twenty (520) fuel rods were irradiated as a part of full-size fuel assemblies. The results of interaction layer (IL) examination were presented at international conferences RERTR-2009 [1,2] and RERTR- 2010 [3] for irradiated dispersion full-size fuel assemblies with tubular fuel elements of the IRT-M type, the IRT-U fuel assemblies with fuel rods and mini-rods with modified dispersion fuel incorporating 5% and 13% of silicon in the matrix and provided with protective coatings on fuel particles such as oxidized layer and zirconium nitride. Their irradiation test was performed until achieving average burnup values of ~ 60%235U and 85%235U.
The experiments reveled that the interaction of the U-Mo alloy and the aluminum matrix was restrained in the main up to a burnup of 85% at a fission rate of ~2.3×1014 cm-3s-1 when Si content made up 13% in the matrix. It was also observed that the interaction layer formed more intensively at higher fission rates even for the 13% Si matrix. A significant interaction layer appears at a fission rate of ~3.6×1014cm-3s-1. The presence of 2-3μm thick protective coating ZrN on U-Mo particles protects them against interaction with Al matrix. In doing so, practical methods were tested on an experimental scale to solve one of the challenges of the U-Mo dispersion fuel, i.e. the interaction of fuel particles with the aluminum matrix. As the fuel burnup increases, the fraction of matrix material tends to reduction due to interaction and thus, physical and mechanical properties of the fuel meat change greatly. In particular, thermal conductivity decreases significantly and temperature of fuel meat rises. Moreover, plasticity of the matrix becomes lower and, probably, its resistance to rupture reduces as well due to swelling of fuel particles. At rather high burnup values, creep processes lead to deformation of fuel particles; particles coalescence and when they lose their spherical shape the deformation of the plate-type fuel could proceed perpendicular to the plate surfaces [4]. Analyzed here are the PIE data on gas porosity and structural changes in UMo particles in full-size fuel rods IRT-U, mini-rods with modified dispersion fuel and early irradiated fuel rods with pure Al matrix [5]. The X-ray examination data are presented for unirradiated and irradiated fuel compositions.
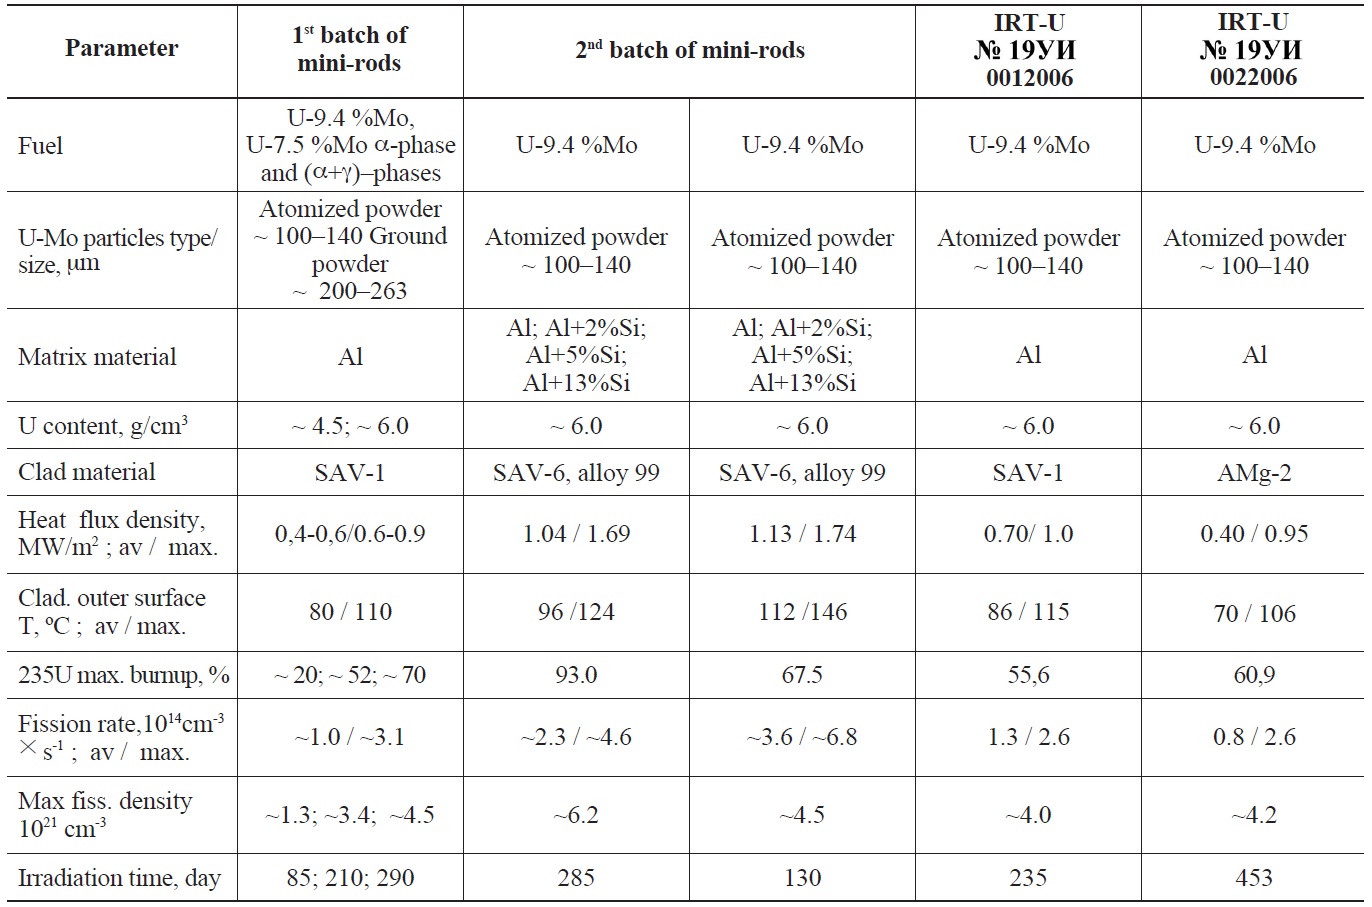
2. RODS BASIC CHARACTERISTICS AND IRRADIATION CONDITIONS
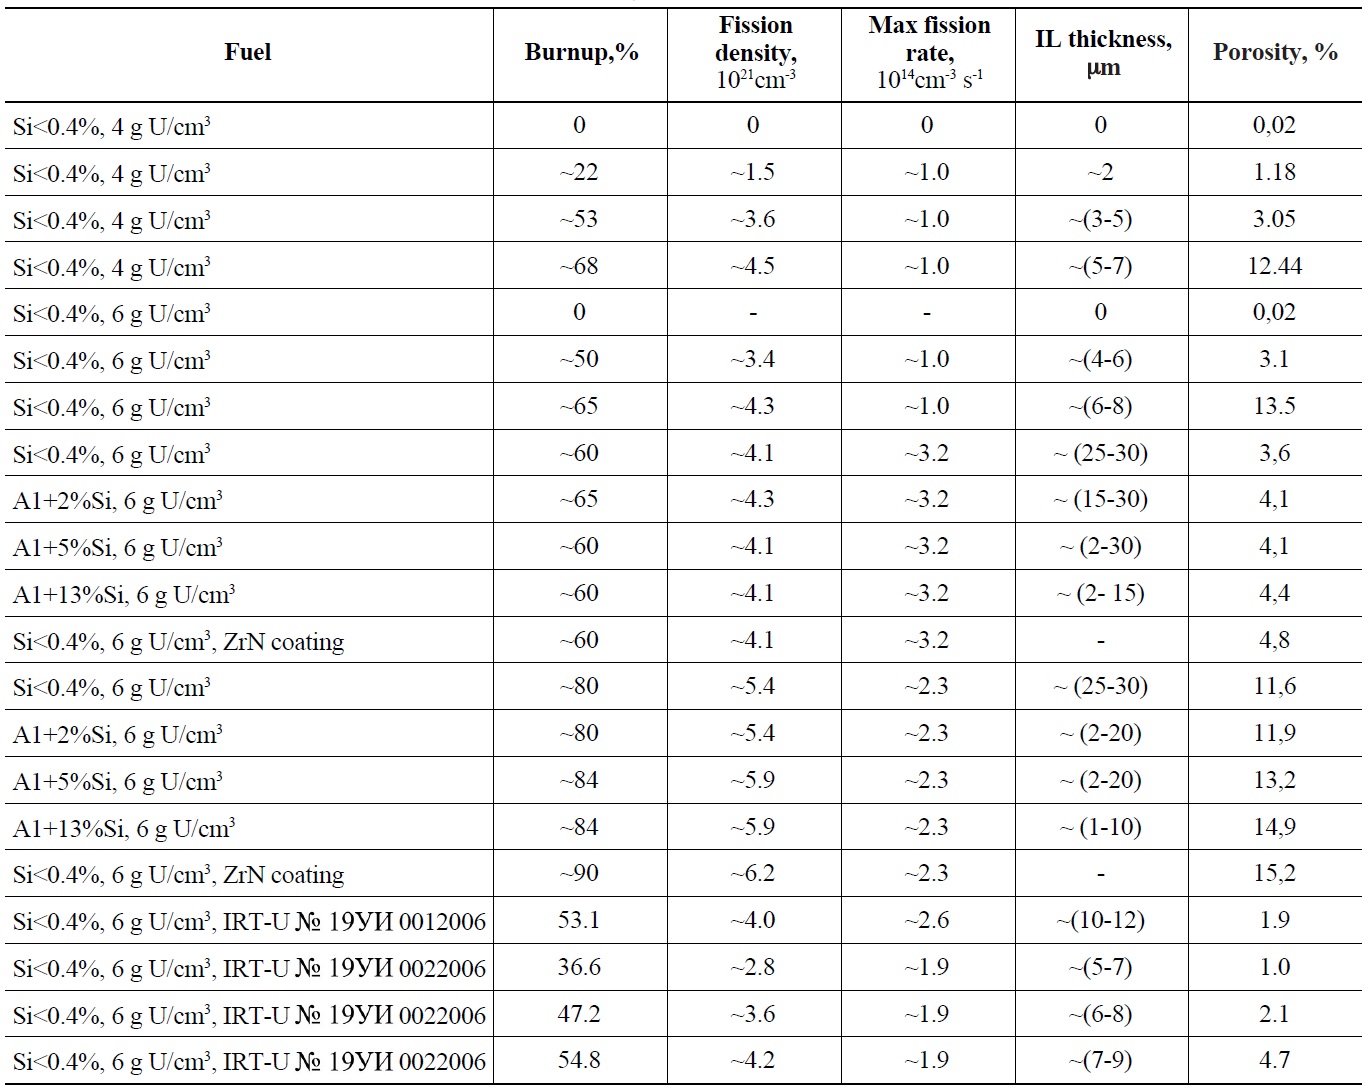
The mini-rods incorporating different modifications of U-Mo alloy were irradiated from 2003 to 2006 (the 1st batch). The mini-rods containing some silicon in the matrix and provided with protective coatings on fuel particles were irradiated from 2008 to 2010 (the 2nd batch). The full-size fuel rods were irradiated from 2007 to 2009. Given in Table 1 are main parameters and specification of rods. Their irradiation conditions are also described here.
The composition of FR cladding materials was described in ref. [6,7].
3.1 Scanning Electron Microscopy and Electron- Probe Microanalysis of Fuel Meat
There is no interaction layer on the surface of U-Mo alloy in unirradiated rods of all modifications, including pure Al matrix. Fuel burnup increase leads to interdiffusion in the matrix and fuel particles, including fission products.
[Table 1.] Rods Basic Characteristics and Irradiation Conditions.

Rods Basic Characteristics and Irradiation Conditions.
A degree of interaction depends on the irradiation conditions and Si content in the matrix for the most part.
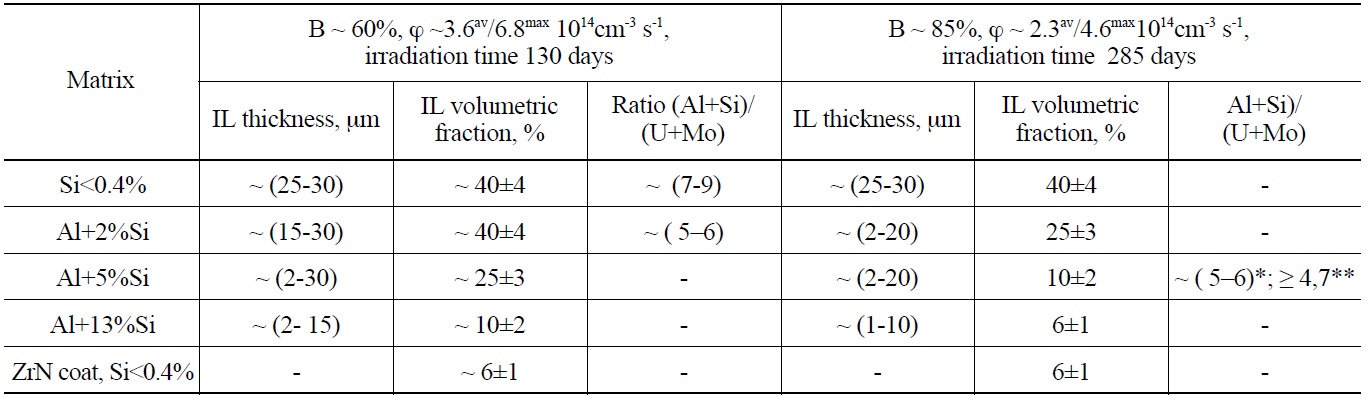
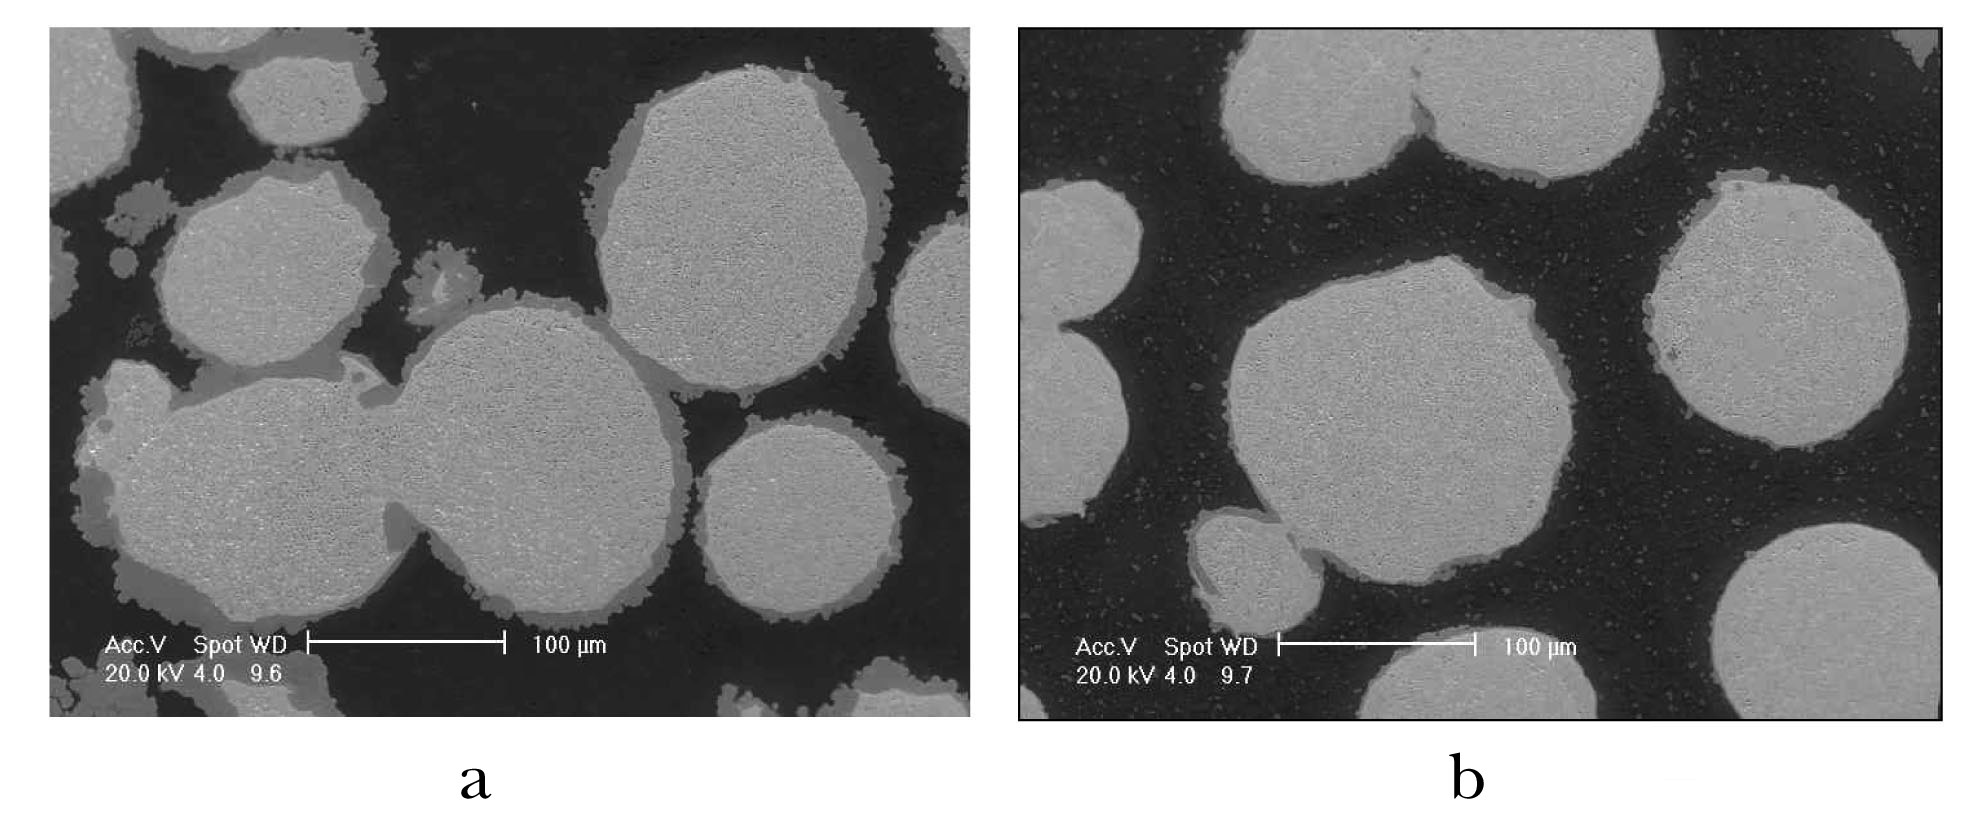
As for the 1st batch of mini-rods with U content of 6g/cm3, which were irradiated at rather low fission rates and temperatures, the interaction layer was ~ 2μm thick at a fission density of ~1.3×1021cm-3; ~(5-7)μm thick at a fission density of ~3.4×1021cm-3, and ~(6-9)μm thick at a fission density of 4.5×1021cm-3 [5]. The maximal value of the IL thickness reached ~ (25-30)μm for the mini-rods from the 2nd batch, which had the pure Al matrix and were irradiated at 2 times higher fission rates and higher temperature values. Table 2 includes volume fraction and thickness values of the interaction layer and atomic ratio of the matrix material (Al+Si) to the fuel particles (U+Mo) for the 2nd batch of mini-rods.
Si added in the amount of 2% to the matrix has a restraining effect on the growth of interaction layer at a fission rate of 2.3×1014cm-3s-1. At a higher fission rate of ~3.6×1014cm-3s-1, a 2% addition of silicon does not produce any noticeable effect on interaction between the U-Mo alloy and Al. The increase of Si content up to 5% and 13% respectively decreases the volume fraction of the IL significantly.
Interaction of U-Mo particles and Al is greatly affected by increase in U-235 fission rate as well as by higher fuel temperature. Under the conditions given above and a burnup of ~ 85%235U, the volume fraction of interaction layer is significantly less as compared to a burnup of ~ 60%.
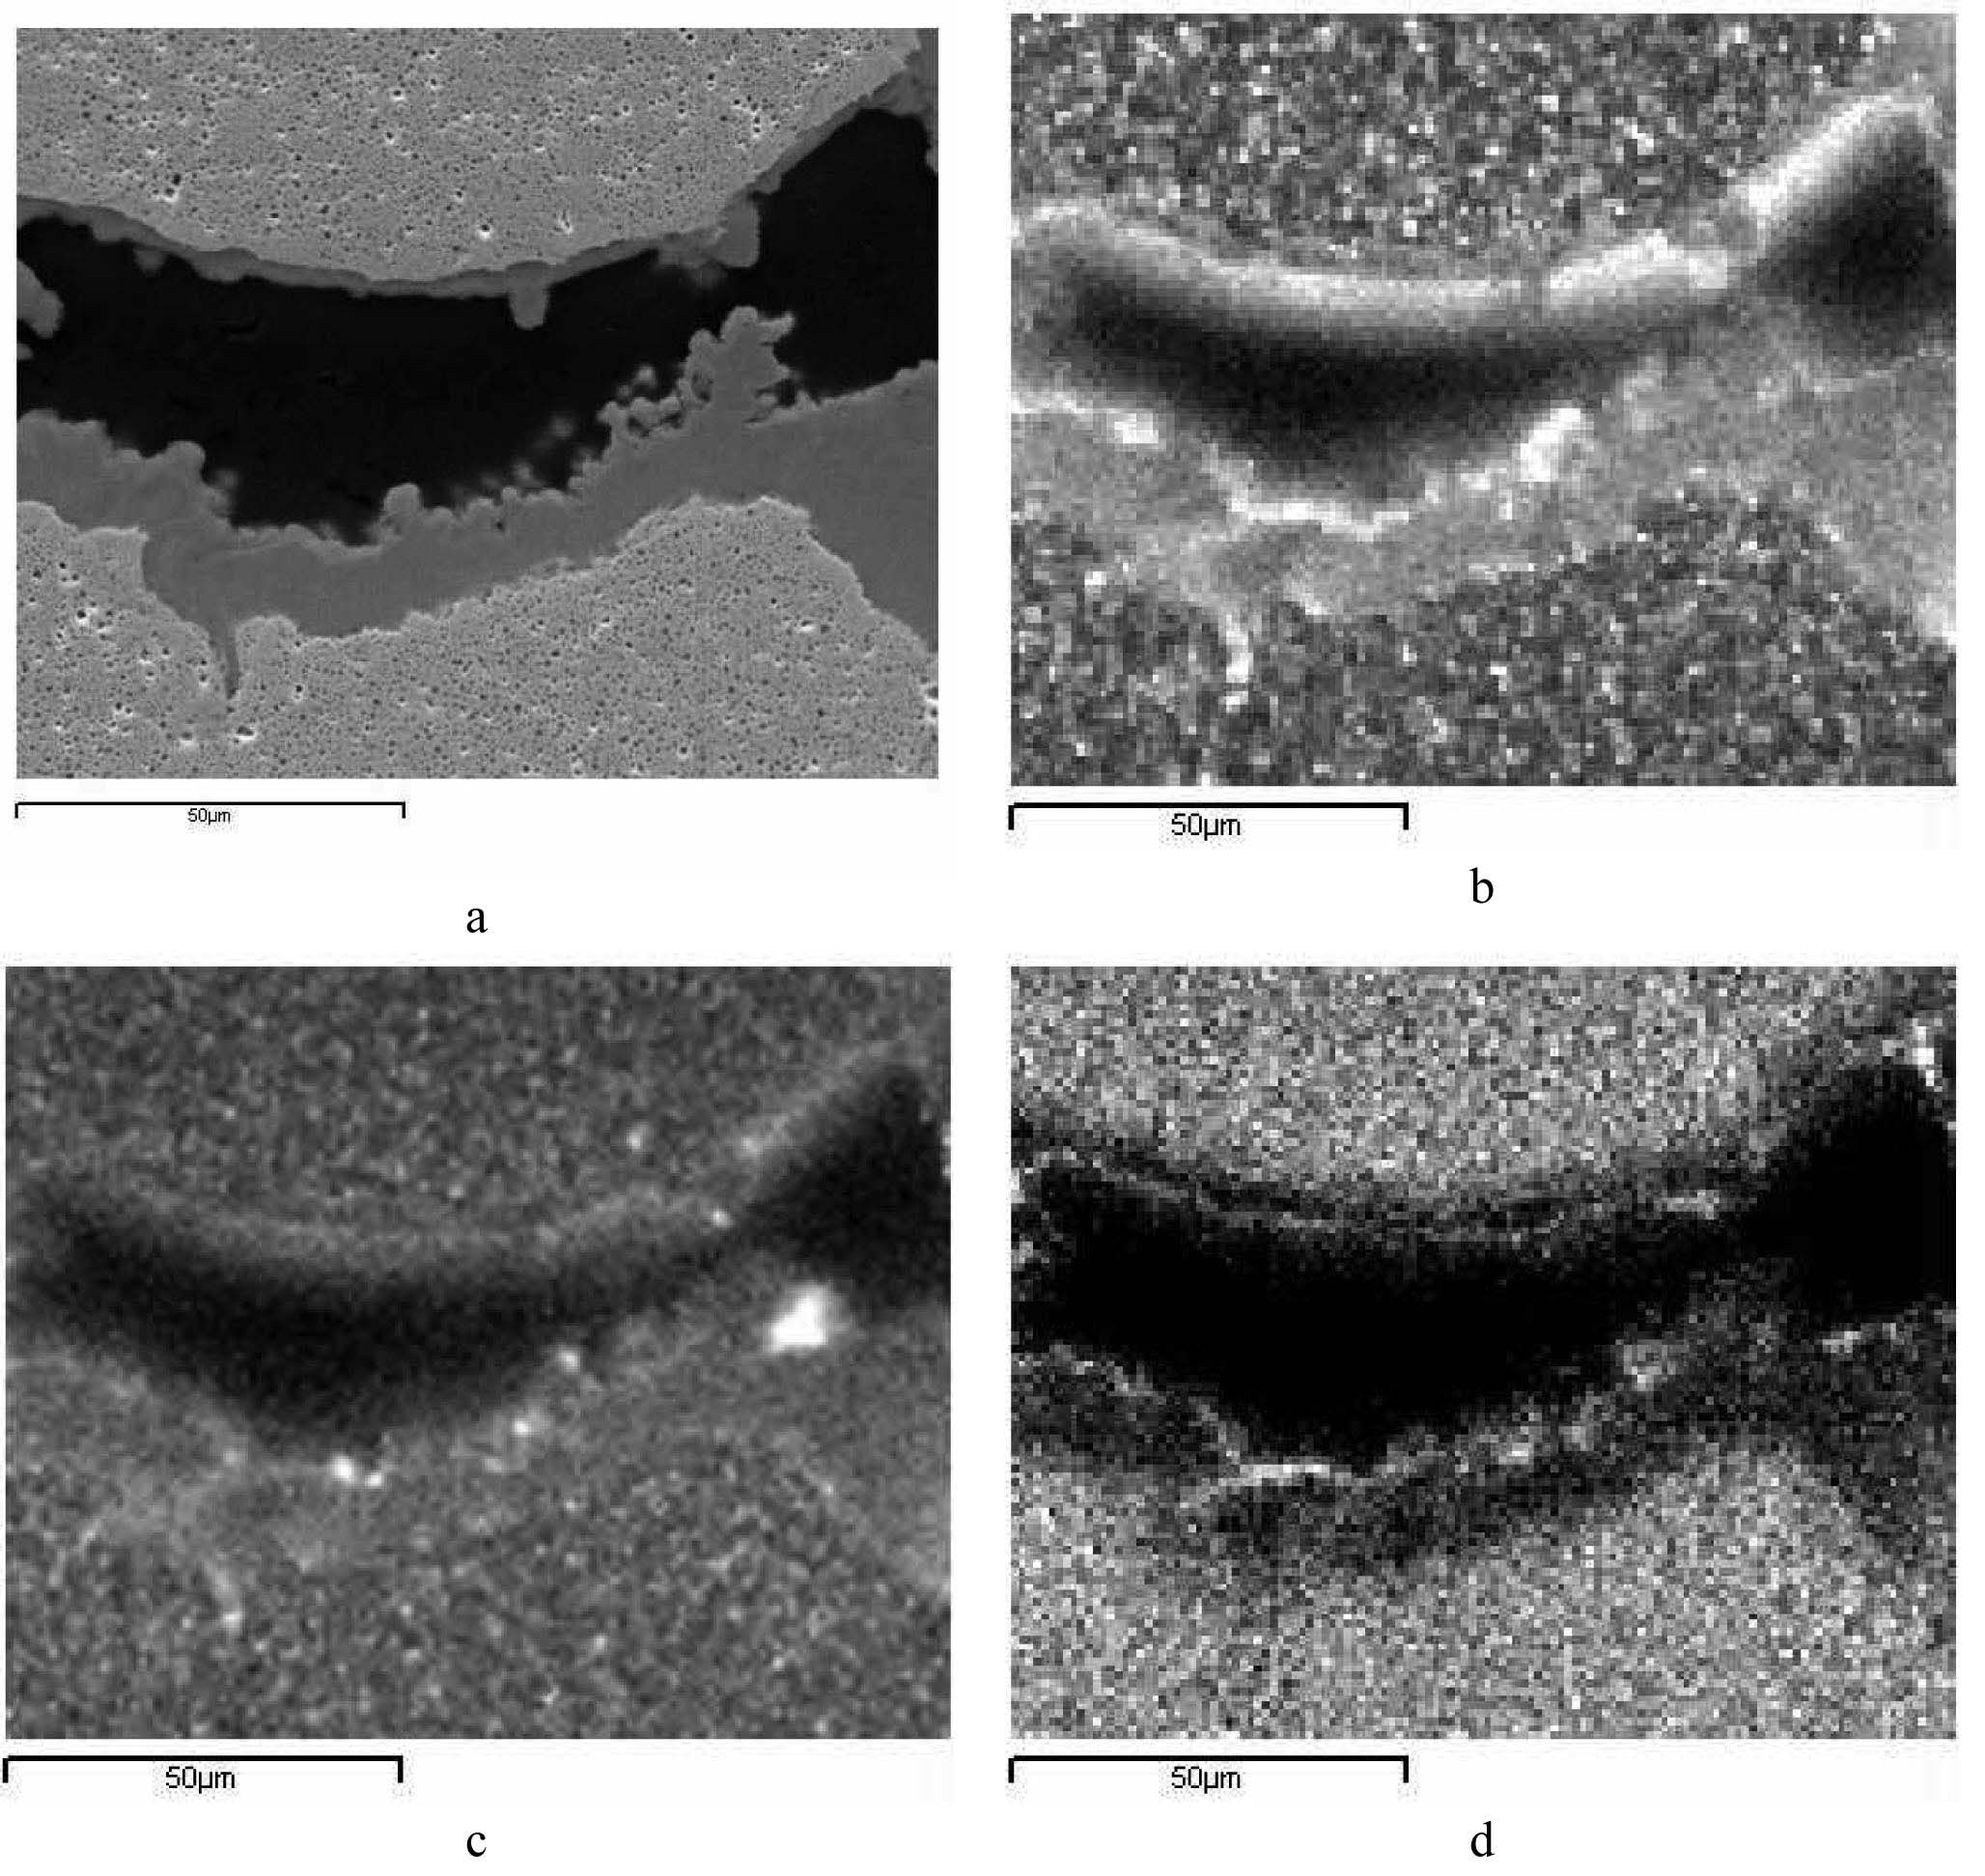
It might be well to point out that the mini-rods containing some silicon in the Al matrix exhibited a non-uniform thickness of interaction layer and a large scattering (Fig. 1) in its values (Table 2). In order to estimate a degree of interaction of fuel particles and matrix, a ratio of the IL area measured in the cross-section of a mini-rod to the total area of fuel meat was used.
An irregular width of interaction layers in the minirods with Si additives in the matrix results from a nonuniform distribution of Si in the matrix. A Si-saturated layer on the surfaces of fuel particle is another important factor that has a strong effect on the formation of interaction layers. It appears during manufacturing of mini-rods. The examination of Si distribution in the fuel meat of mini-rods with different Si contents in the matrix was described in details in Ref.[3]. Analyzed here is also its effect on the IL growth.
According to the results of fuel meat structure examinations in the full-size fuel rods, U-Mo particles interact with the Al matrix. The layer is homogeneous, its width

Results of the IL Volume Fraction and (Al+Si)/(U+Mo) Atomic Ratio Measurements for ~ (100?140) μm U-9.4 %Mo Fuel Atomized Powder.
is regular along the perimeter of the fuel particles and it does not exceed 12 μm in the fuel elements of both IRTU type assemblies. A regular width of interaction layer in these fuel elements is due to the absence of Si additives in the matrix. A volume fraction of interaction layer accounts for 10 – 12% in the fuel meat of both assemblies.
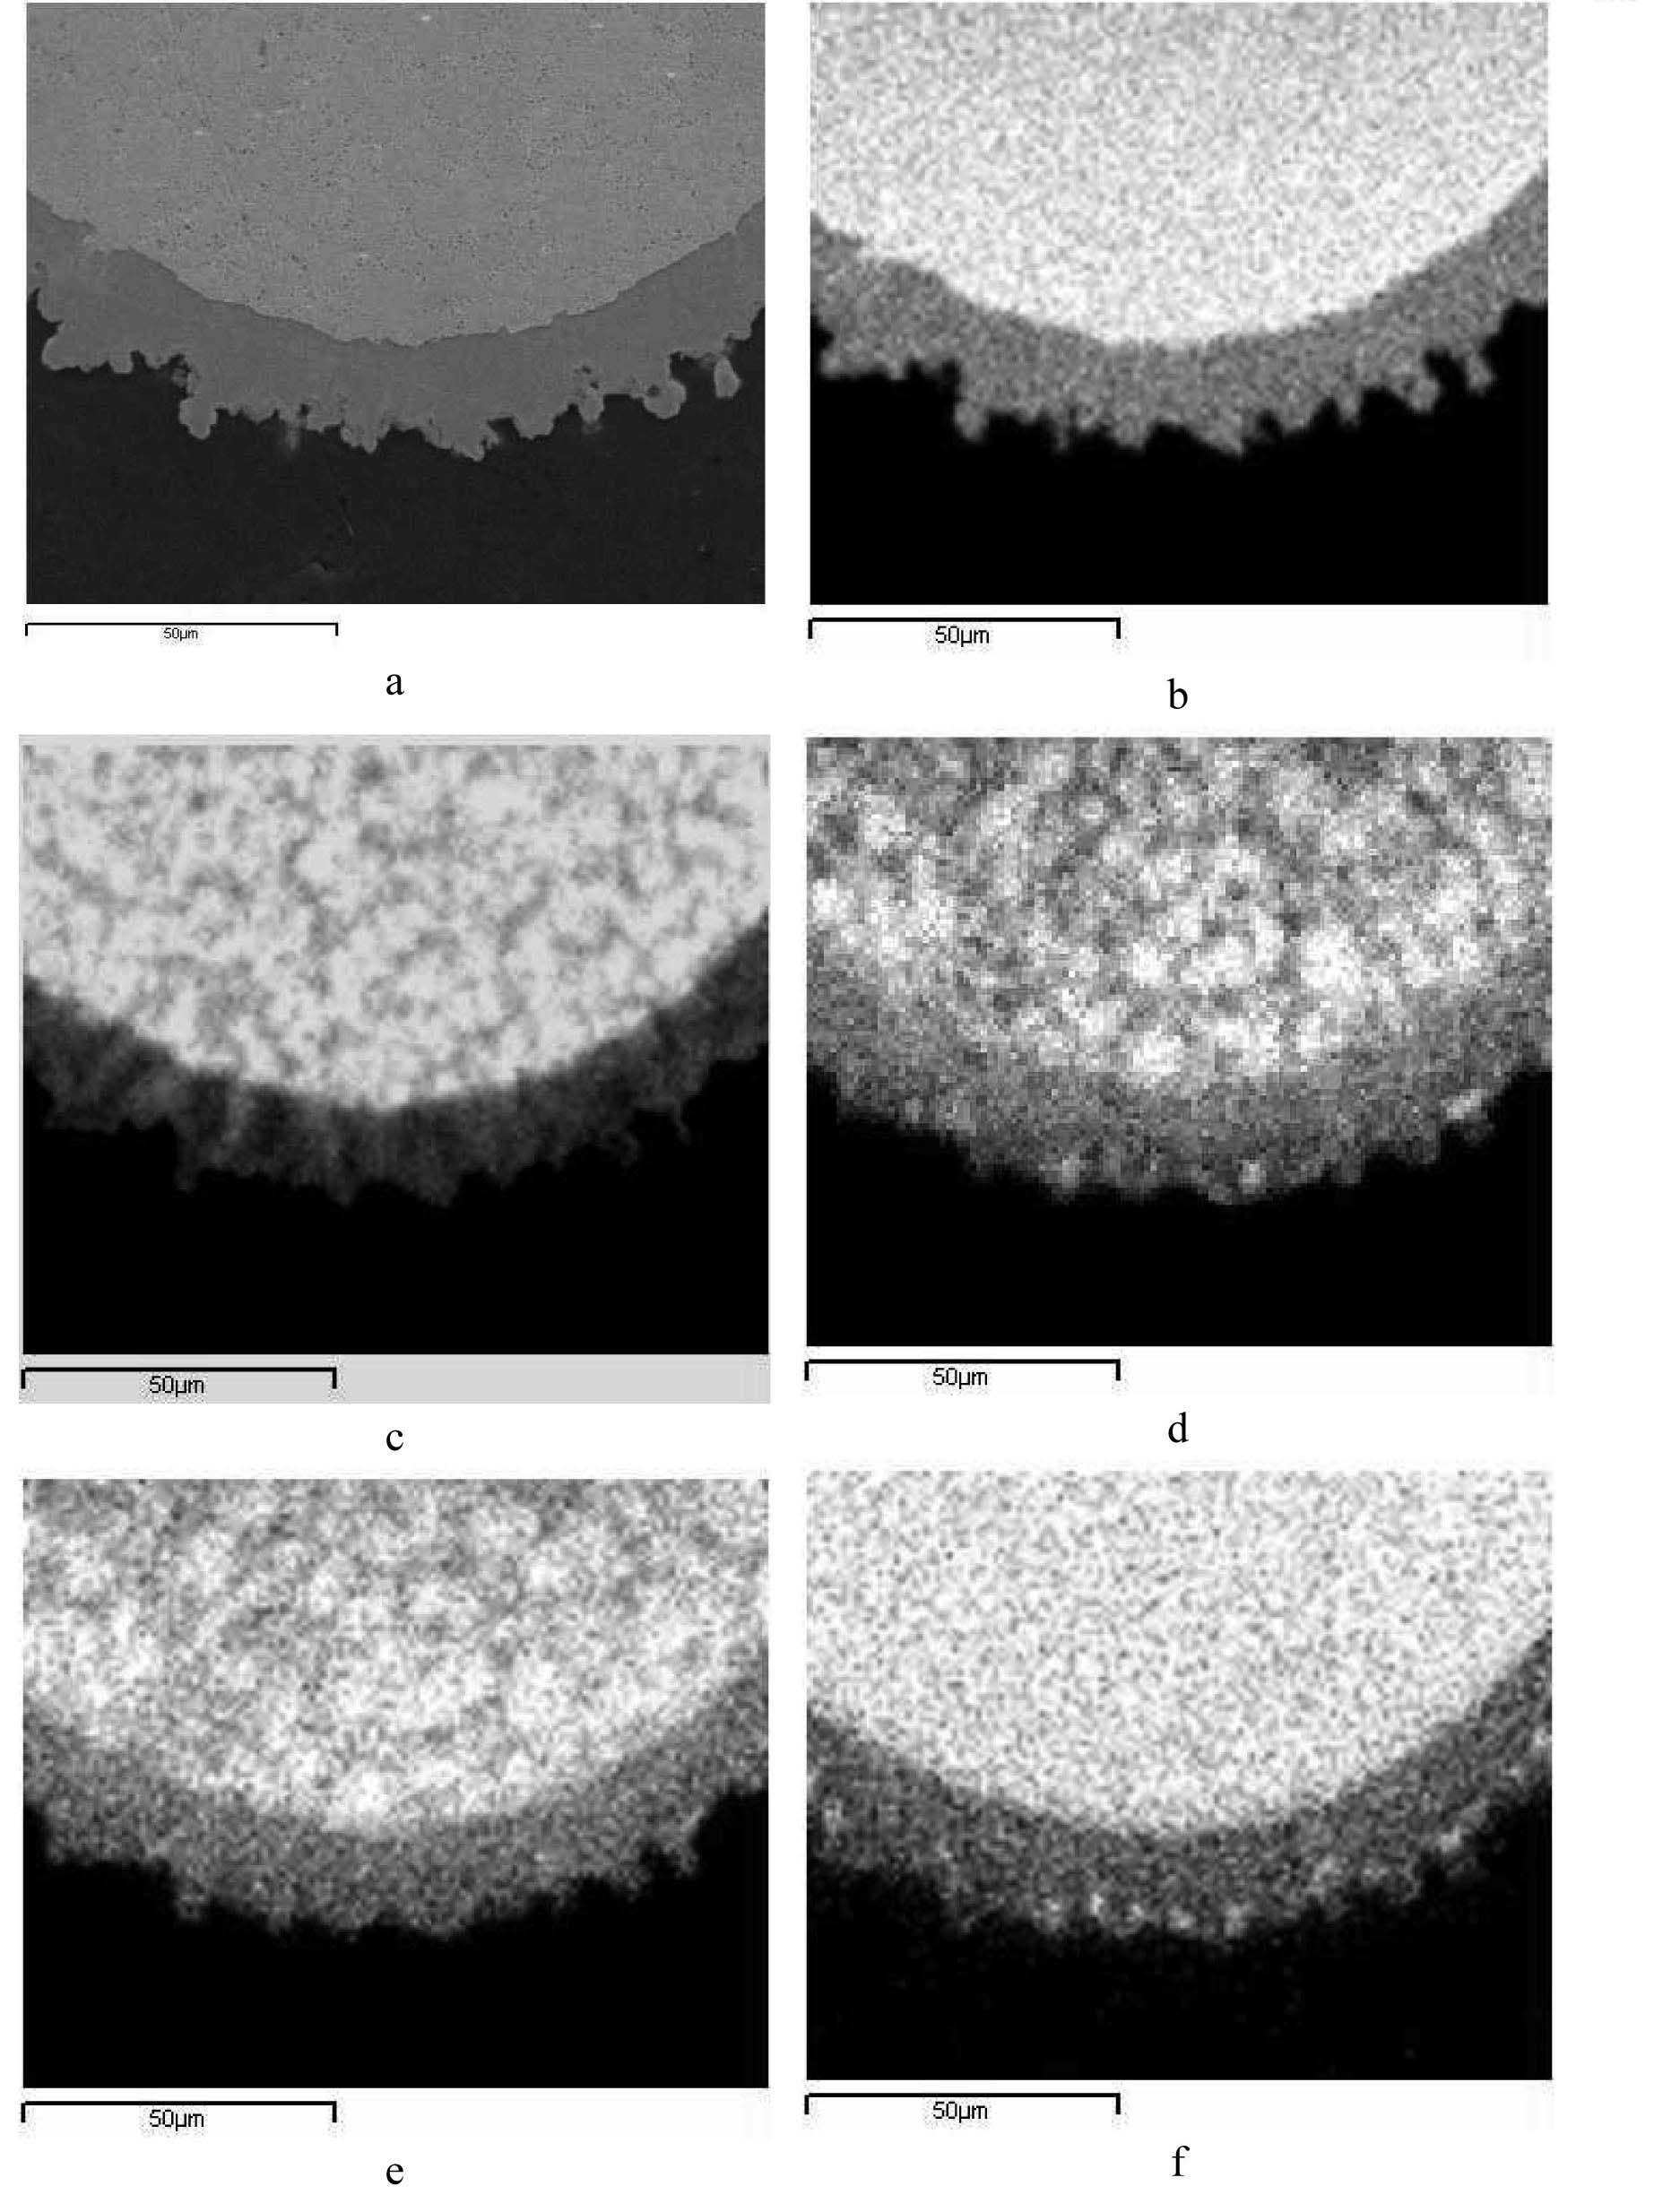
Data on the IL structure and composition are very important for characterization of U-Mo fuel behavior. That is why a large scope of out-of-pile and post-irradiation examinations was done. EPMA was used to investigate the composition and obtain distributions of different elements in the fuel meat. In Fig. 2 are shown the EPMA data for a fragment of fuel meat with pure Al matrix at ~60 % burnup.
In this regard, it should be mentioned that such a distribution of Al, Mo and U in the fuel meat is a common feature independent of burnup values and Si content. According to the obtained data, distributions of Al and U are rather uniform. An insignificant decrease in U concentration is observed in the direction from a fuel particle and some decrease of Al concentration is observed in the direction to the fuel particle. Also, it should be mentioned that both optic and electron microscopy examination methods did not reveal any differences in the structure of interaction layer throughout its thickness. To estimate the (Al+Si)/(U+Mo) atomic ratio in the interaction layer of the mini-rods with Al matrix (Si<0.4%) as well as with 2% and 5% Si contents, a quantitative microprobe analysis was performed. According to the obtained data, this ratio is different for the mini-rods with pure Al matrix and minirods incorporating Si. As for the mini-rods with the Al matrix, the Al /(U+Mo) ratio is in a range from 7 to 9. The measured data indicate that these values are different in interaction layers of different particles of fuel meat. The Al/(U+Mo) ratio had insignificant variations over the thickness of interaction layer in the chosen particle. The ratio tends to increase close to the boundary line of interaction layer and matrix and to decrease close to the fuel particle.
As to the interaction layer of mini-rods with 2% and 5% Si contents in the matrix, the (Al+Si)/(U+Mo) ratio depends on the Si content in the layer. In case of wide interaction layer, there is no Si in it. It accumulates at the boundary of interaction layer and Al. The (Al+Si)/(U+Mo) ratio ranges from 5.2 to 5.9 in this layer. If there is more than 7at.% of Si in the interaction layer, this ratio decreases down to 4.7. Fuel particles with more than 7at.% Si content in the interaction layer have an 1-2mm wide IL (13% of Si in the matrix). Interaction layers of 10-15μm wide can be formed around other fuel particles of these mini-rods. Si was not observed in these interaction layers.
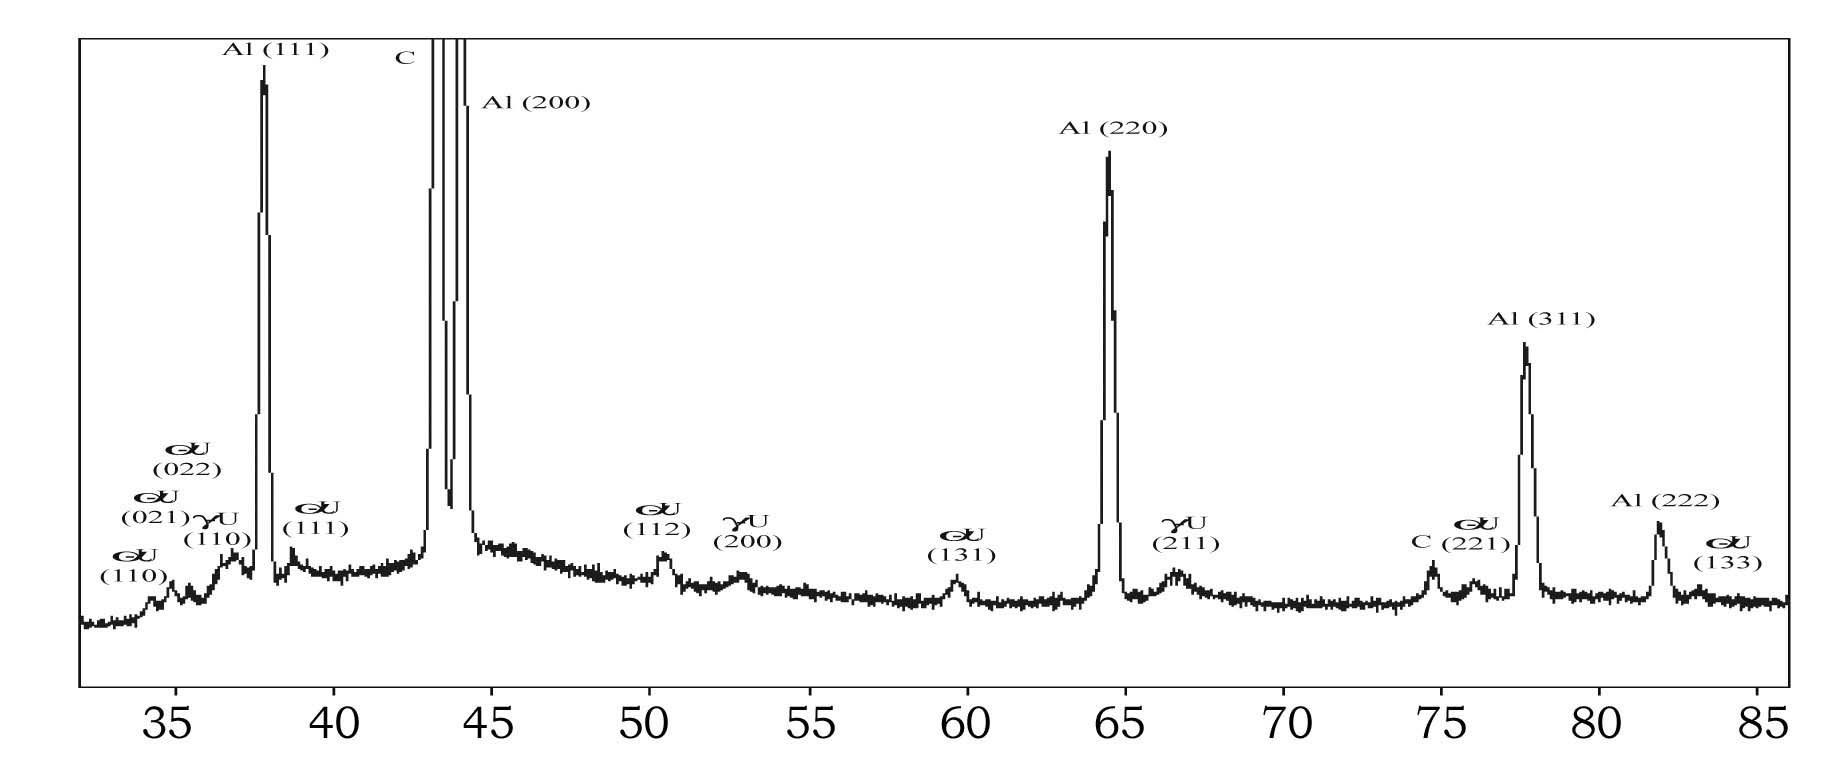
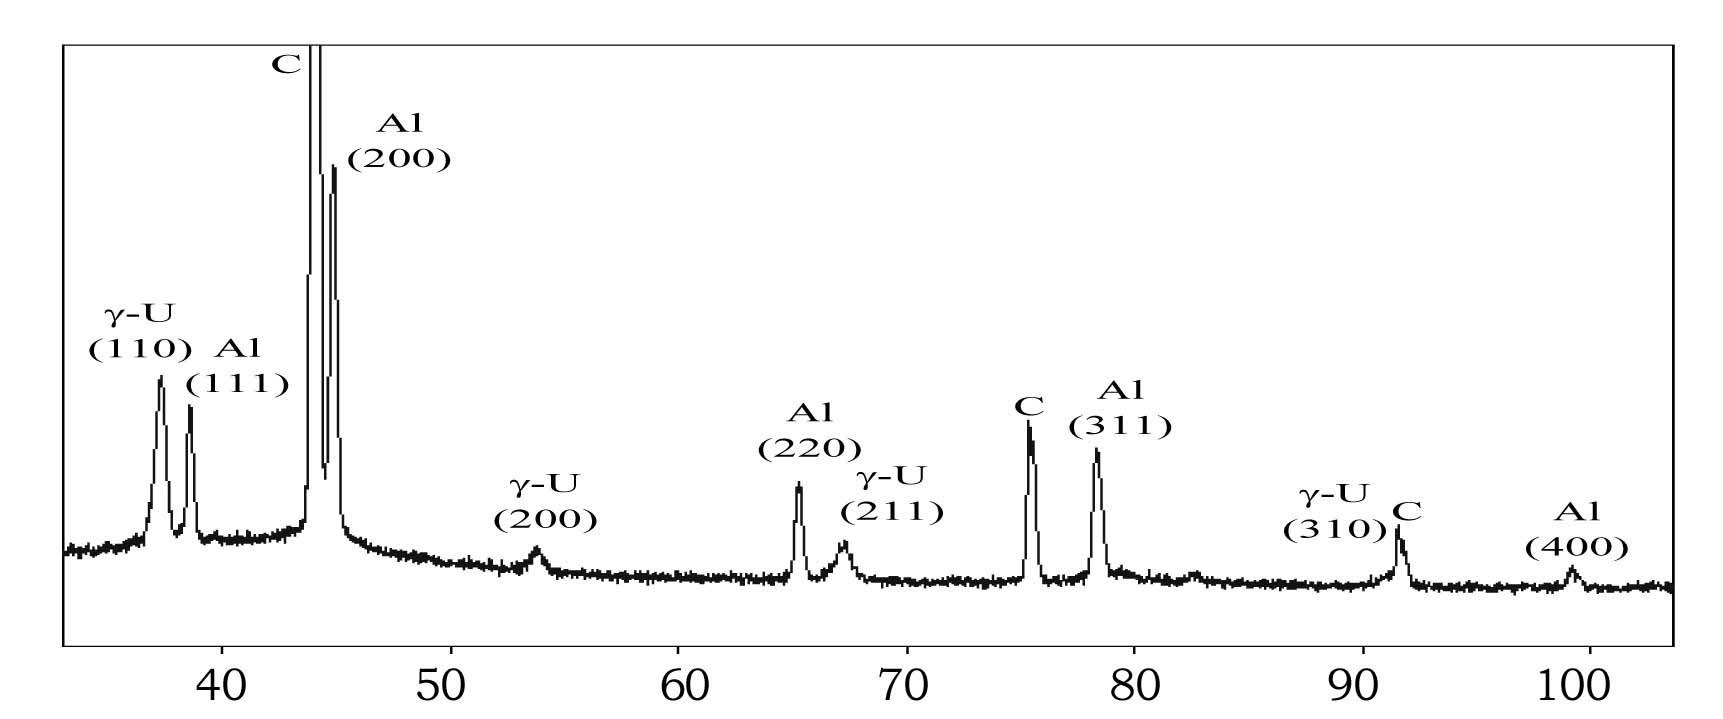
Samples to be examined by X-raying were longitudinal sections of the mini-rods from the first batch with U-7.5 %Mo (γ) and U-7.5 %Mo (α+γ) fuel. The examination was performed with diffractometer DARD-5 using a step-bystep scanning method (scanning was done for every 2θ 0.02 deg., exposure time was 2s). The X-ray wave length corresponds to the wave length of copper κα; graphite was used as a monochromator.
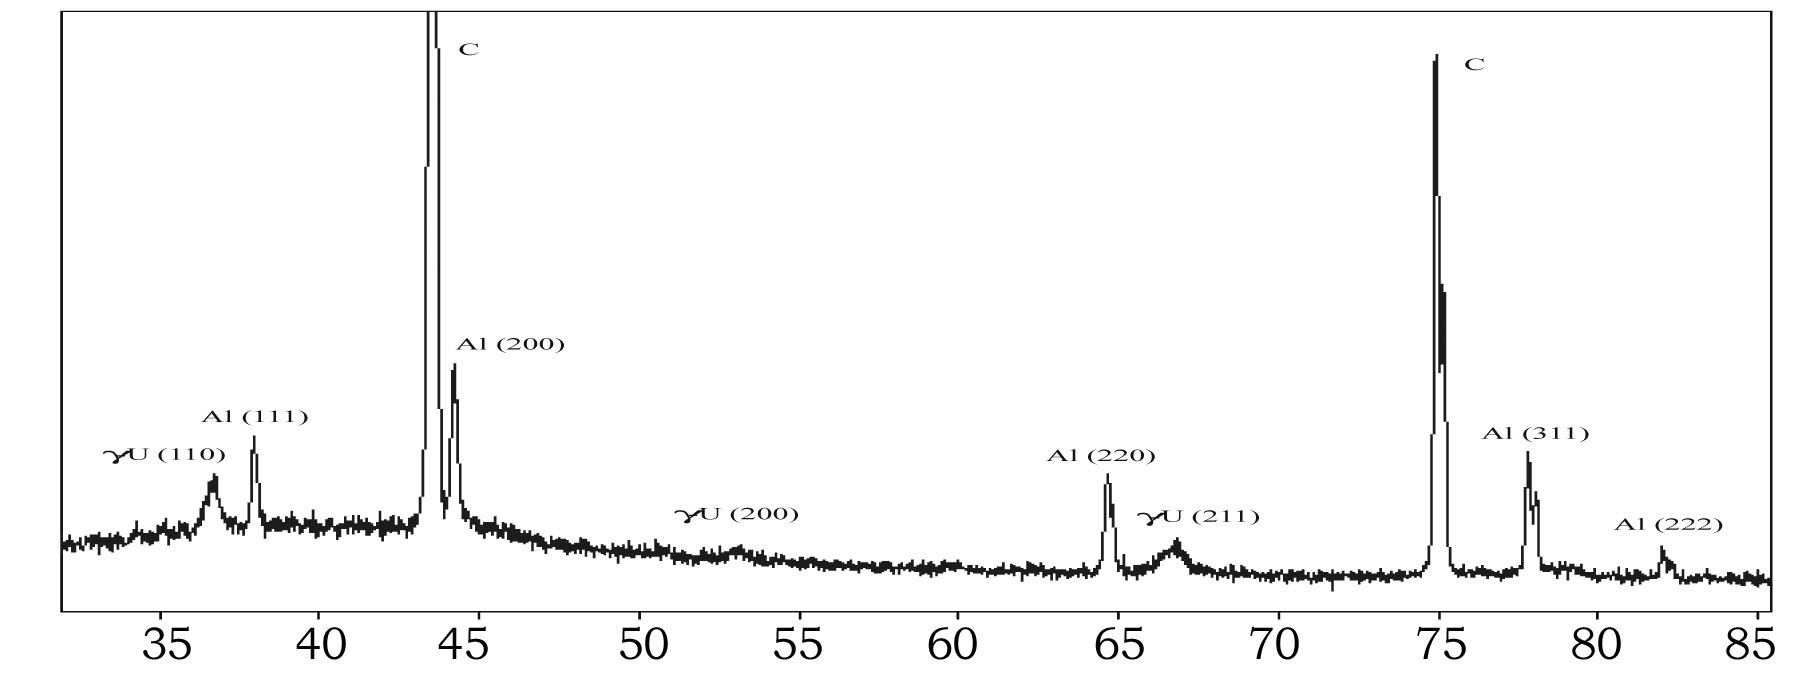
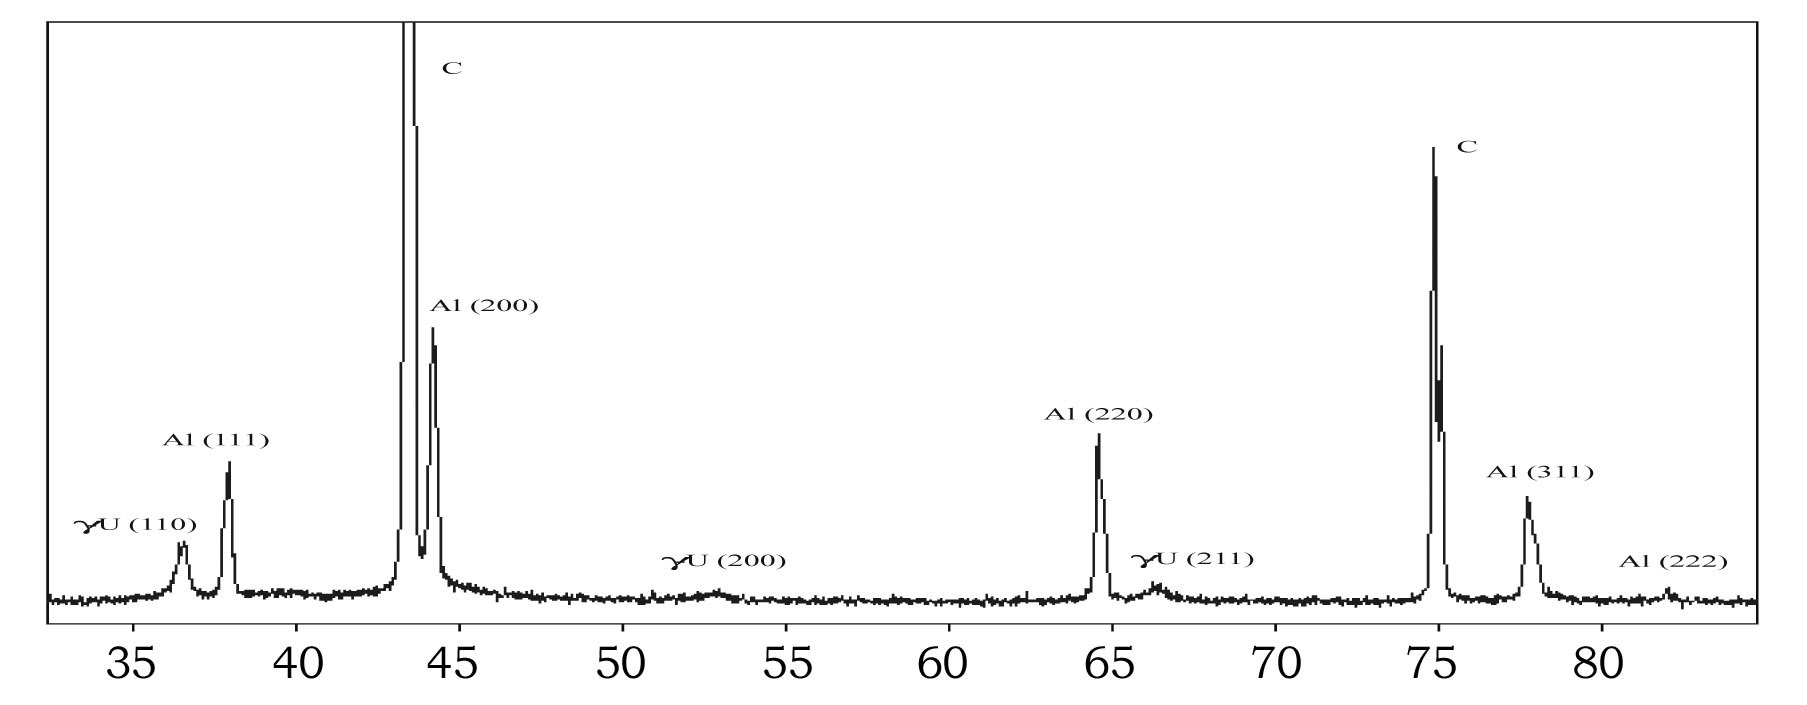
Shown in Fig.3 and Fig.4 are the X-ray patterns of unirradiated sample with U-7.5 %Mo (γ) type fuel and irradiated one with the same fuel and a burnup of ~45%235U. The obtained X-ray patterns were indexed as diffraction peaks of two phases i.e. Al and γ-U. Calculated parameters of unit cells were as follows:
Unirradiated sample: γ-U a = 0.34186 ± 0.00024 nm, Al - a = 0.40502 ± 0.00005 nm;
Irradiated sample: γ-U a = 0.34313 ± 0.00016 nm, Al - a = 0.40506 ± 0.00005 nm.
According to the obtained data, the parameter of the γ-U unit cell increased by 0.37% after irradiation. The parameter of Al unit cell remained unchanged.
Shown in Fig.5 and Fig.6 are the X-ray patterns of unirradiated sample with the U-7.5 %Mo (α+γ) and irradiated one with the same fuel and a burnup of ~67%. The phase analysis of the X-ray pattern of the unirradiated sample revealed three phases: α-U (orthorhombic lattice), γ-U, and Al.
Calculated parameters of unit cells were as follows in the unirradiated sample:
α-U - a = 0.28561 ± 0.00012 nm, b = 0.58558 ± 0.00037 nm, c = 0.49700 ± 0.00021 nm,
γ-U - a = 0.34141 ± 0.00040 nm;
Al - a = 0.40496 ± 0.00002 nm.
Two phases were observed in the sample irradiated up to burnup of ~67% during the X-ray phase analysis: γ-U, Al.
Calculated parameters of unit cells were as follows in the irradiated sample:
γ-U - a = 0.34273 ± 0.00007 nm;
Al - a = 0.40496 ± 0.00002 nm.
The results obtained from this examination reveal that
irradiation caused disappearance of the α-U phase and 0.39% increase in the γ-U unit cell parameter. The unit cell parameter of Al did not change. Moreover, it is worth to point out that any other crystal phases were not observed in the irradiated samples except for Al and U.
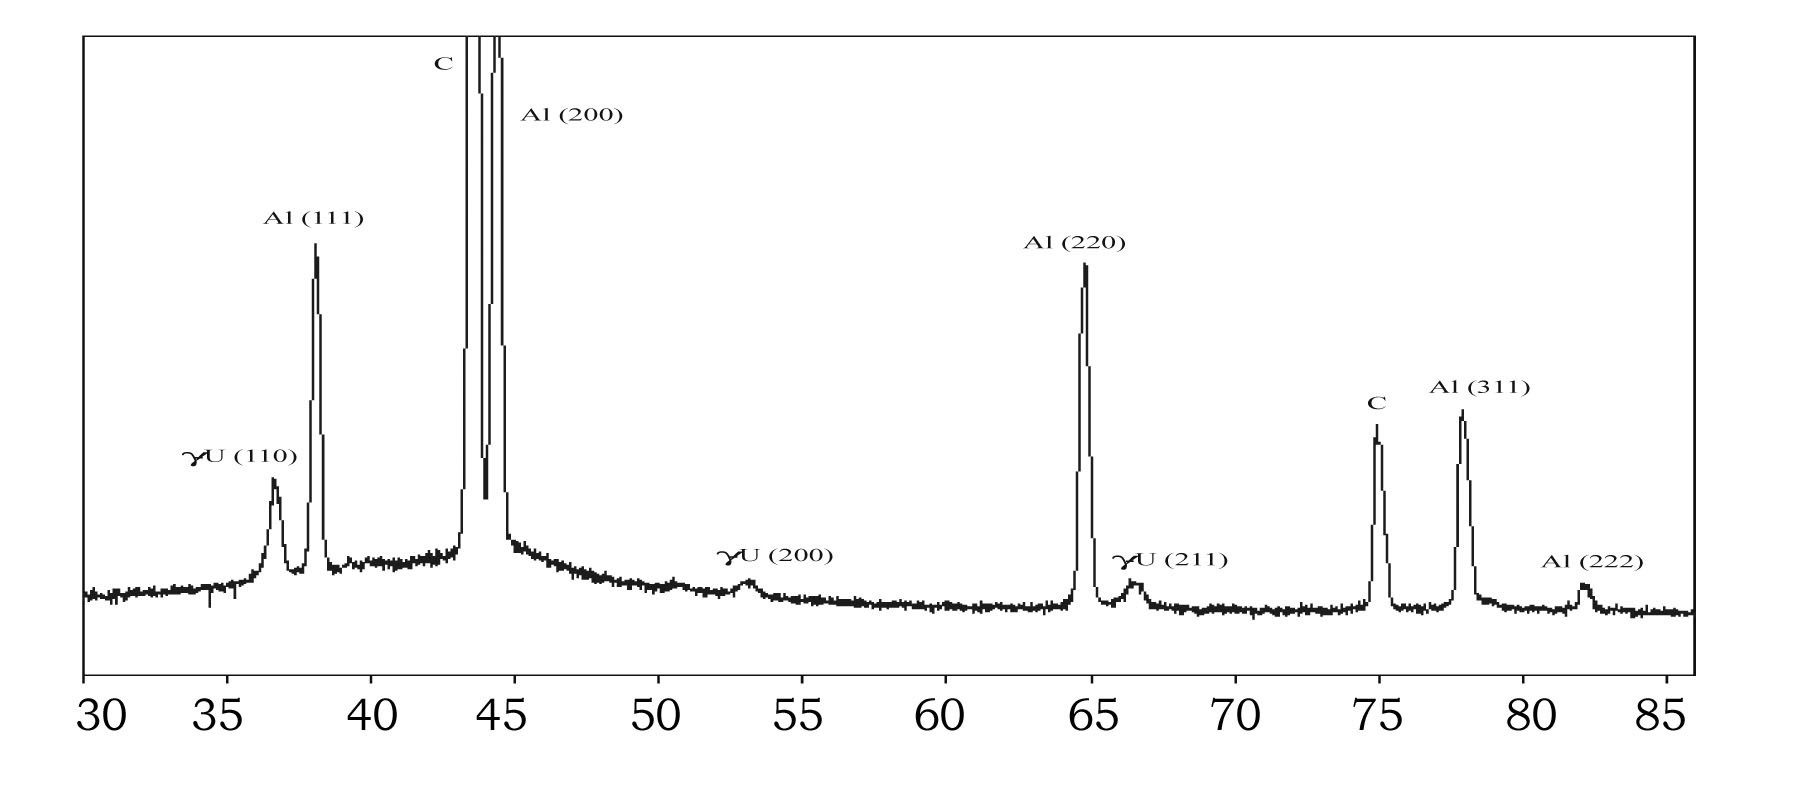
Fig. 7 demonstrates the X-ray pattern of the U-9.4%Mo (γ) sample with a burnup ~ 85 %. As was shown by the previous samples, the presented diffraction lines correspond to the structures of γ-U and Al. Calculated parameters of unit cells were as follows:
γ-U – = 0.3417 ± 0.0002 nm,
Al – a = 0.40499 ± 0.00002 nm.
A considerable width of diffraction lines γ-U (0.91 deg for line 310 and 1.9 deg for line 321) testifies to of a significant distortion of the crystalline structure.
A reduced intensity of Al lines as compared to previous X-ray patterns testifies decreasing in the Al content in the fuel meat. Decrease in the Al phase content was caused by formation of wide interaction layers. At the same time, a new phase was not revealed that is an indirect evidence of the amorphous structure of the interaction layer.
3.3 Porosity Formation in the U-9.4%Mo Particles under Irradiation
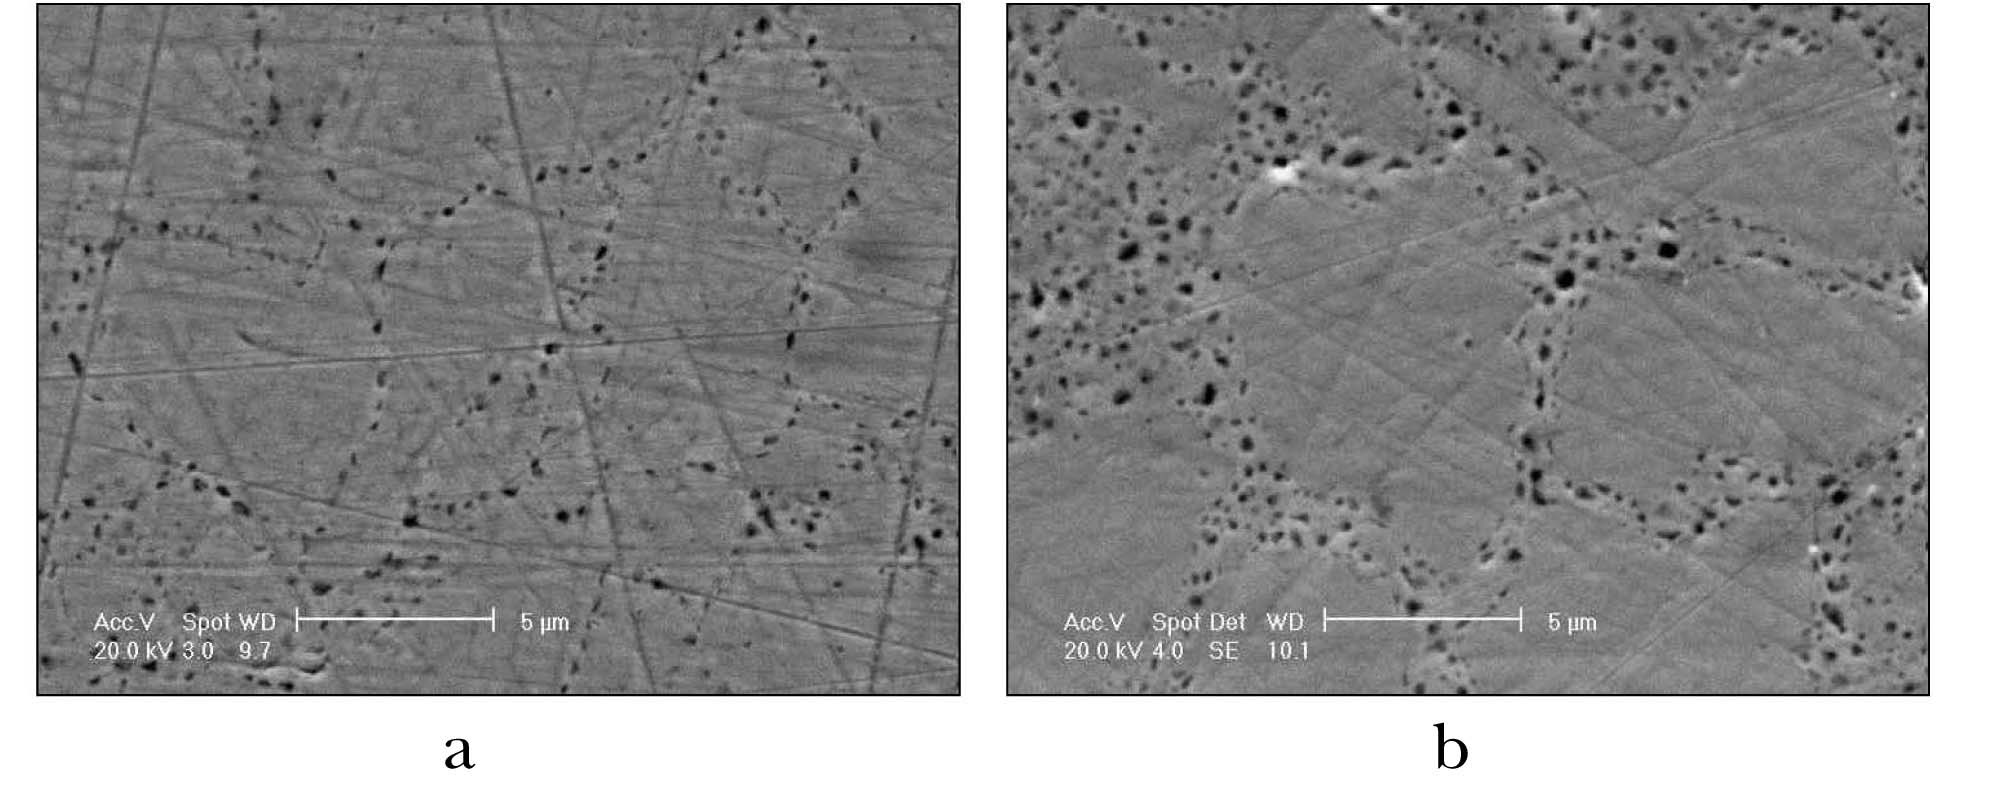
Scanning-electron microscopic investigation was performed to observe arrangement of pores appeared in the U-Mo particles under irradiation of mini-rods. To determine an exact location of pores, fractures of minirods
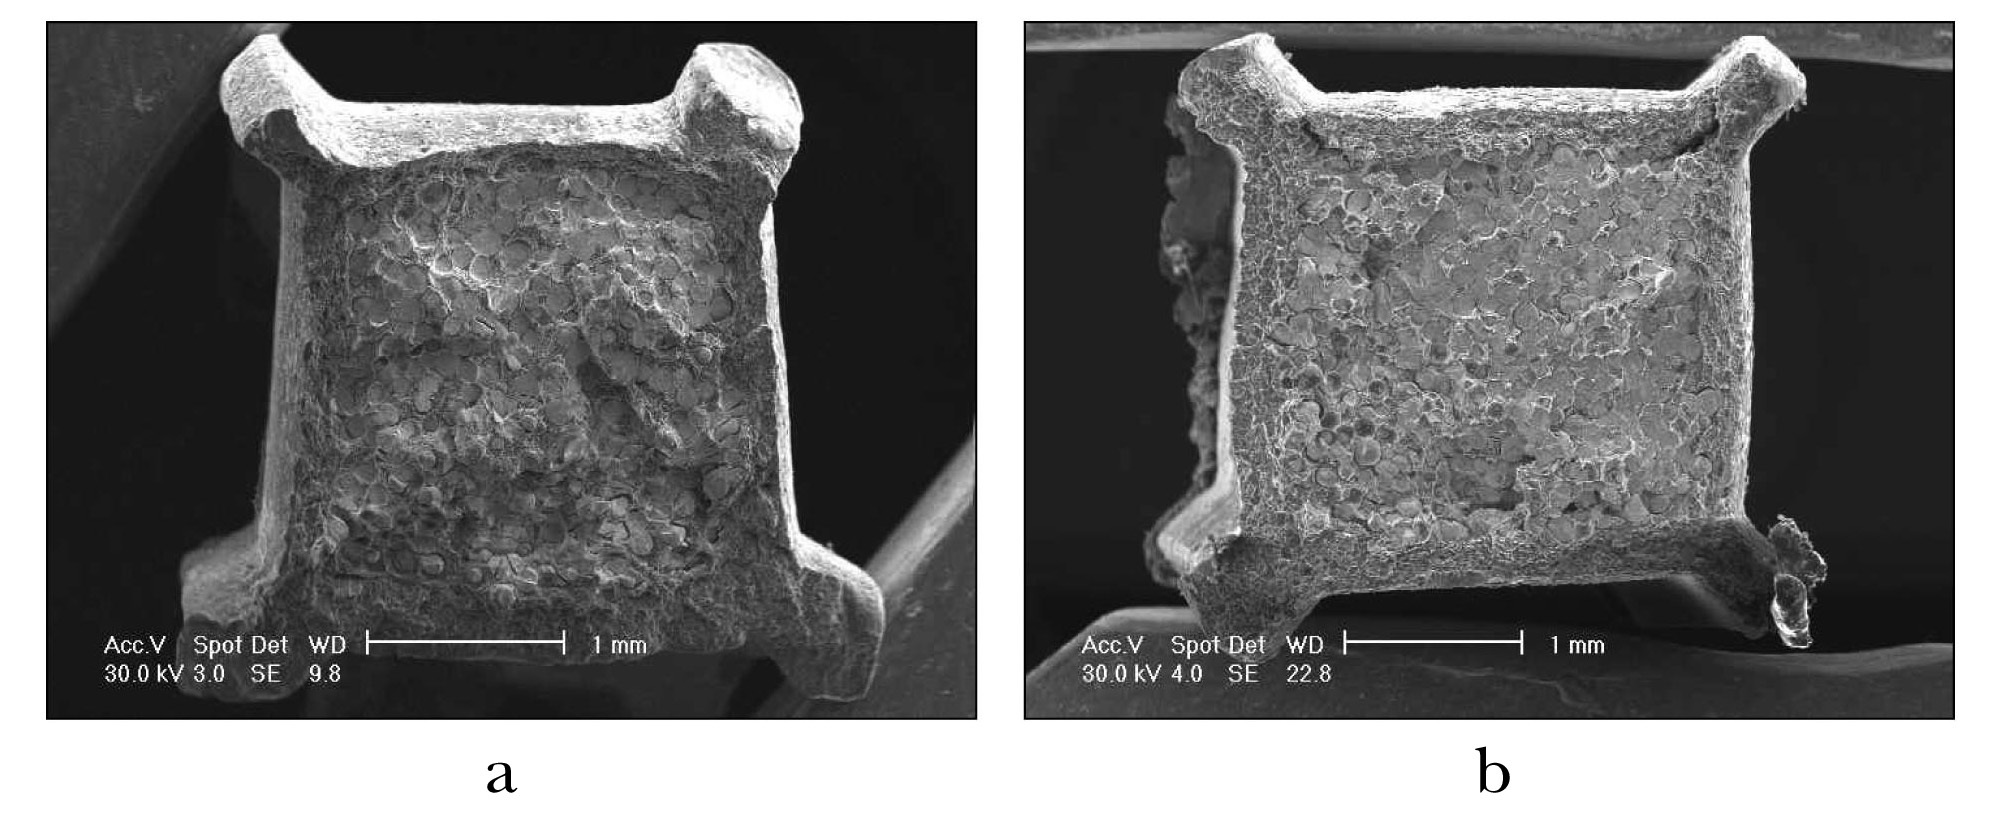
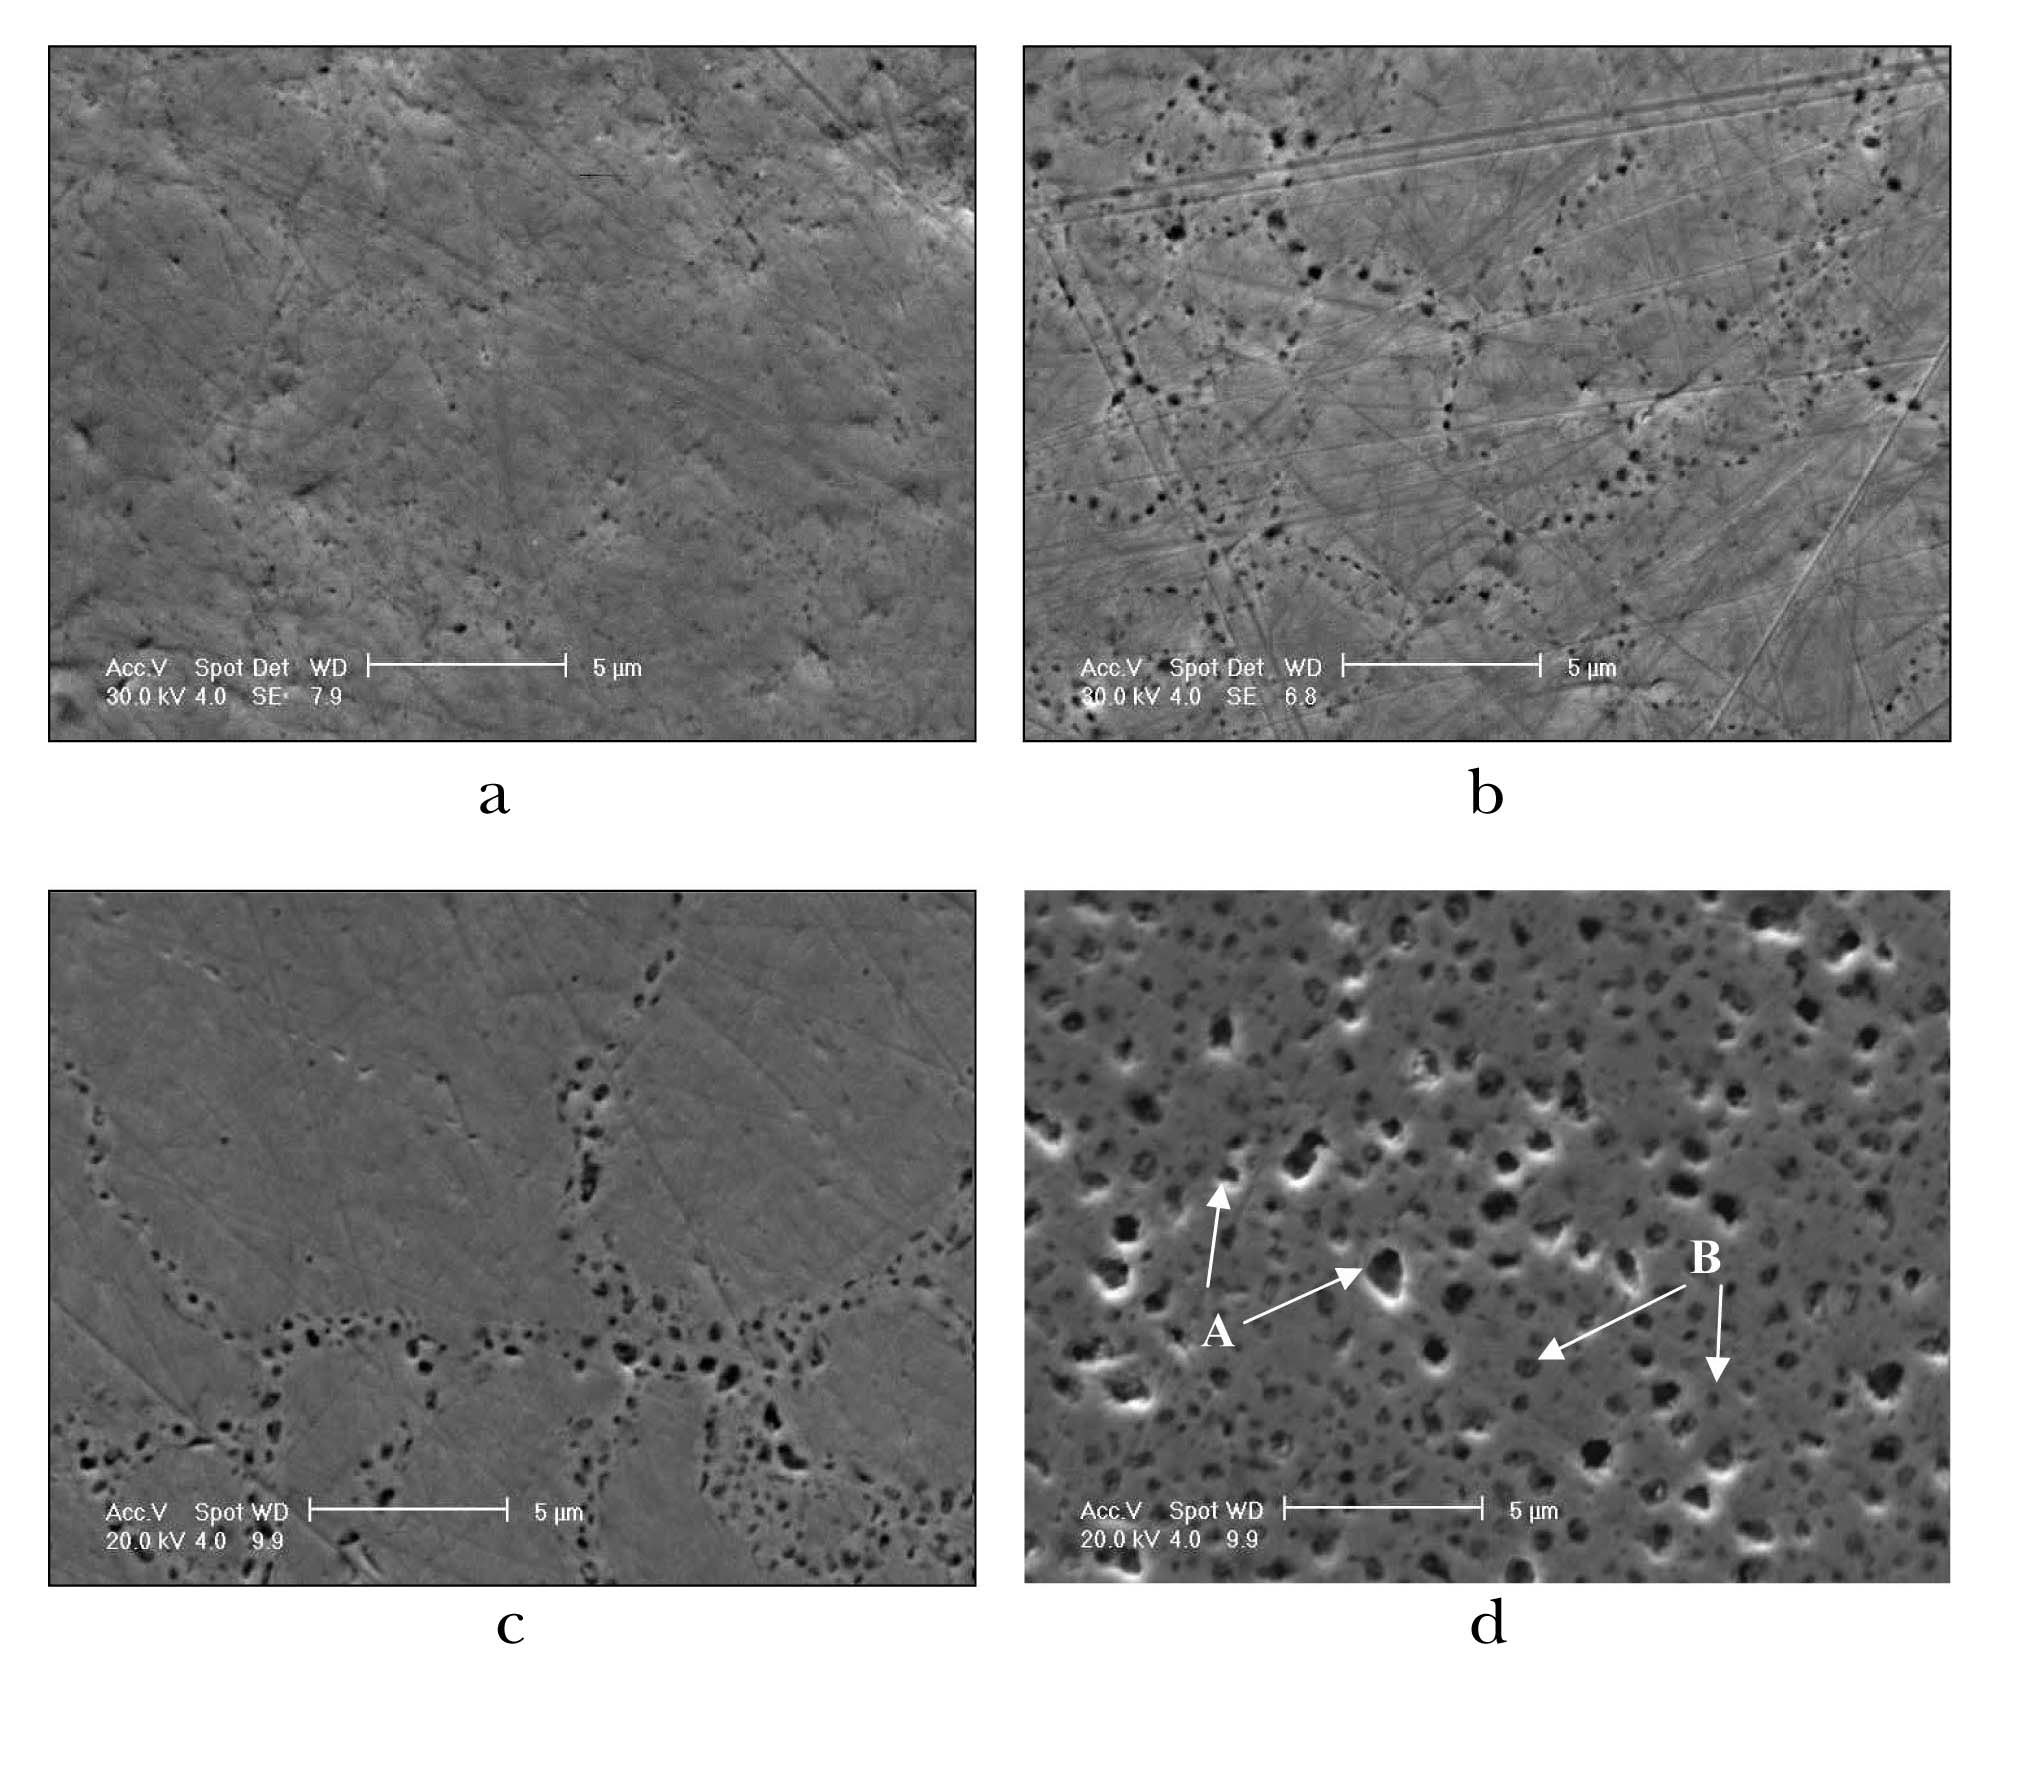
were prepared. To produce a brittle fracture of fuel particles, the mini-rods were cooled with liquid nitrogen before fracturing. Figure 8 shows fractures of mini-rods with burnups of 19.5% and 49.5% 235U.
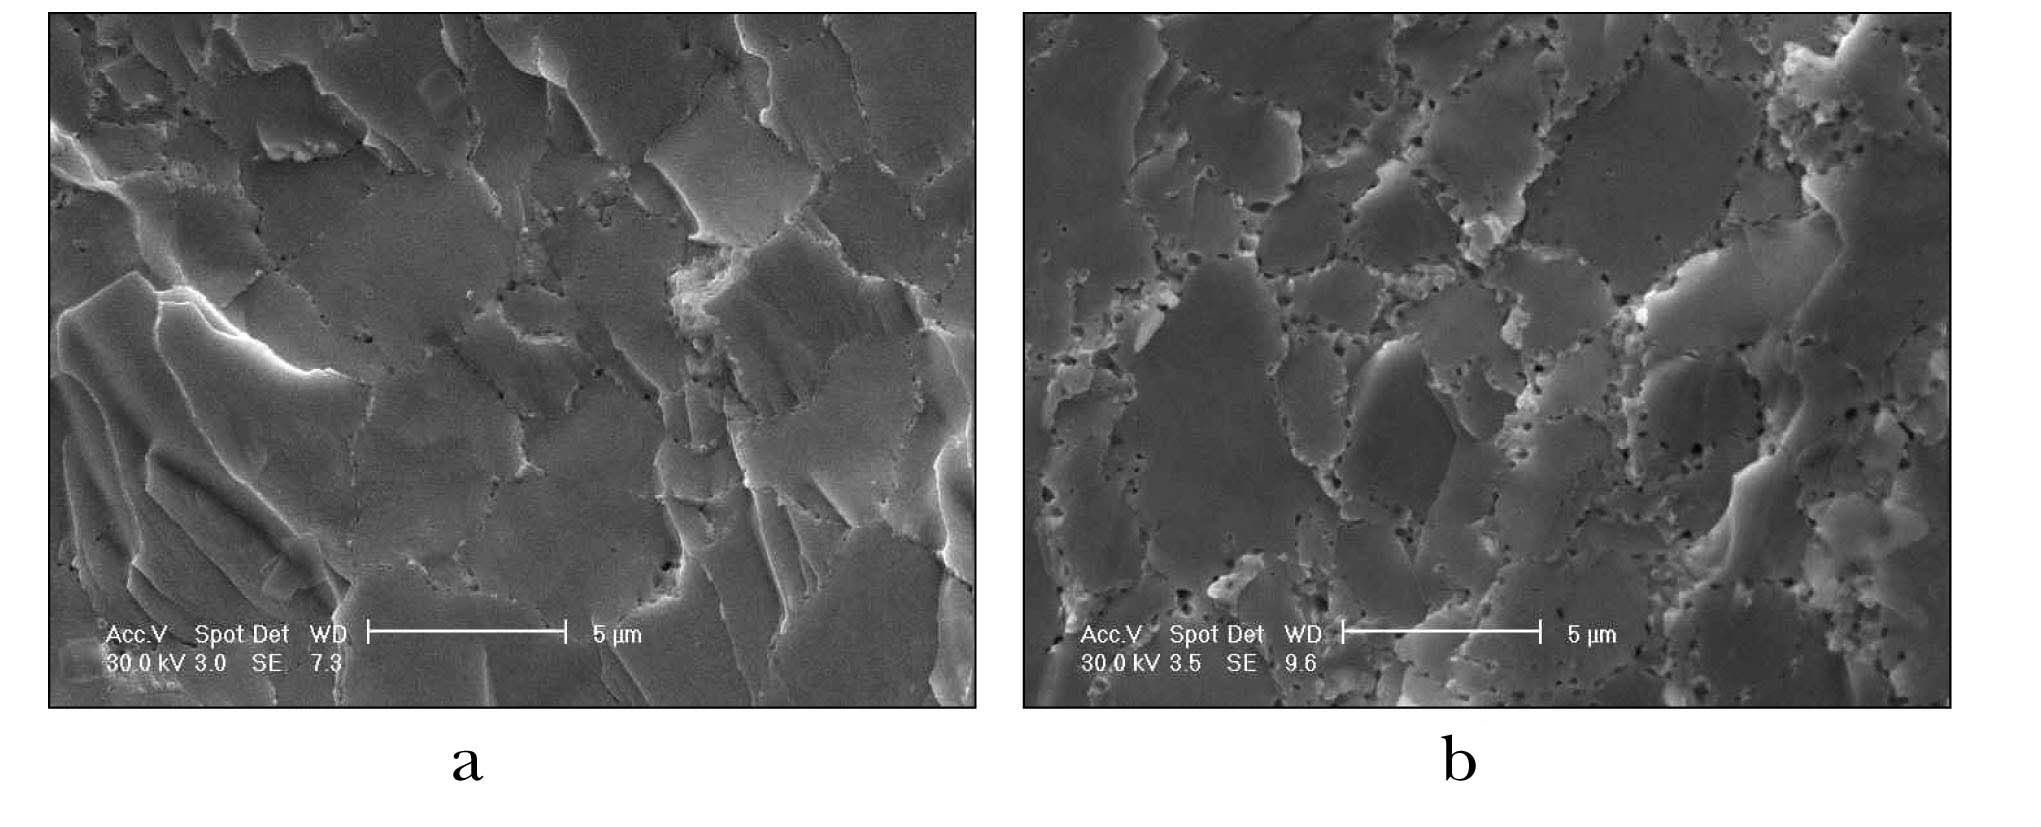
According to the results of fractographic investigation, pores appear at the grain boundaries at the beginning of irradiation (Fig.9). Based on these data, one may use polished samples to get more results (Fig.10).
It can be clearly seen on the polished samples that pores form chains along the grain boundaries. At a burnup of 60%, the pore size increases up to ~ (0.6-0.7) μm at the grain boundaries. The grain boundaries become wider and pores are arranged in several rows.
The pores become larger at the grain boundaries at a burnup of 85% 235U. Their diameter achieves (~1.0-1.3) μm at most. A large amount of pores and the secondary phase precipitates of submicron size are observed in the grain bodies. Identification of this phase by EPMA is a challenging task because of its small size. This evolution of the U-Mo particles structure is typical for all fuel compositions of mini-rods concerned in this paper.
Similar structural changes take place in the U-Mo particles of the full-size fuel rods (Fig.11). According to comparison, the microstructure of fuel particles in these fuel rods and microstructure of particles in the U-Mo alloy of mini-rods are similar in porosity evolution.
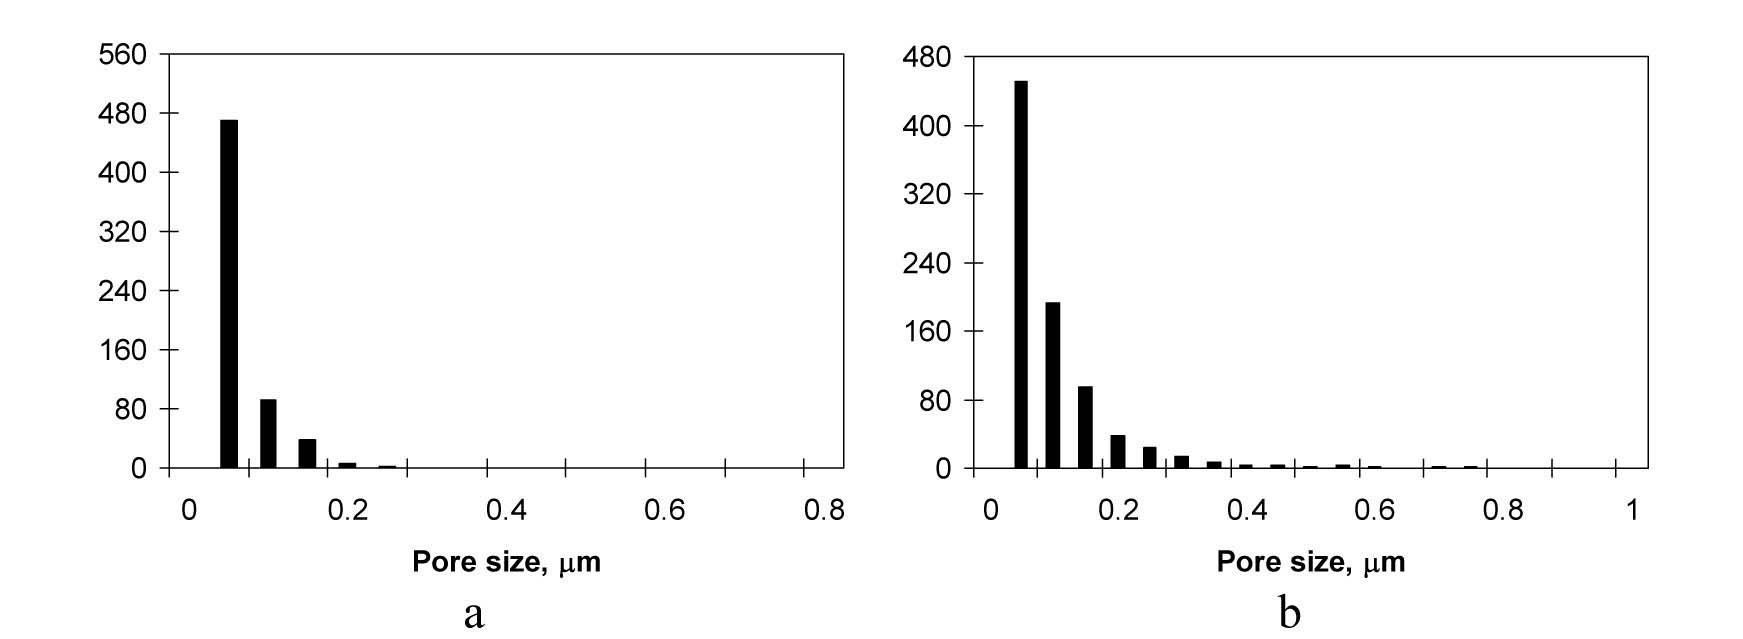
Despite a significant increase in the porosity of U-Mo alloy at a burnup of ~85%, no large gas-filled bubbles are observed under the specified irradiation conditions. Coagulation of pores and pore chains are also absent. The diameter of pores does not exceed ~1.5μm in the U-Mo alloy. Shown in Fig.12 is a typical pattern of pore size distribution in U-Mo fuel irradiated up to burnups of ~ 60% 235U and ~ 85% 235U.
In order to estimate a volume fraction of pores, a pore size of 50 nanometers was used as the minimum size.
Given in Table 3 are the quantitative estimation data on the volume fraction of pores (porosity).
Based on the results presented in Table 3, it can be concluded that the volume fraction of pores in the U-Mo alloy does not depend much on the irradiation conditions and fuel composition of mini-rods under examination. Different fuel compositions having the nearest burnup values revealed some differences in the volume fraction
Results of the Quantitative Evaluation of the Porosity in ~ (100?140) μm U-Mo Fuel Atomized Powder.
of pores, which are consistent with the differences in the IL value. Fission products of uranium diffuse into the interaction layer. Probably, the larger the volume fraction of this layer, the more gaseous fission products (GFP) diffuse into it resulting in lower concentration of GFP in the U-Mo alloy and lower porosity of fuel particles.
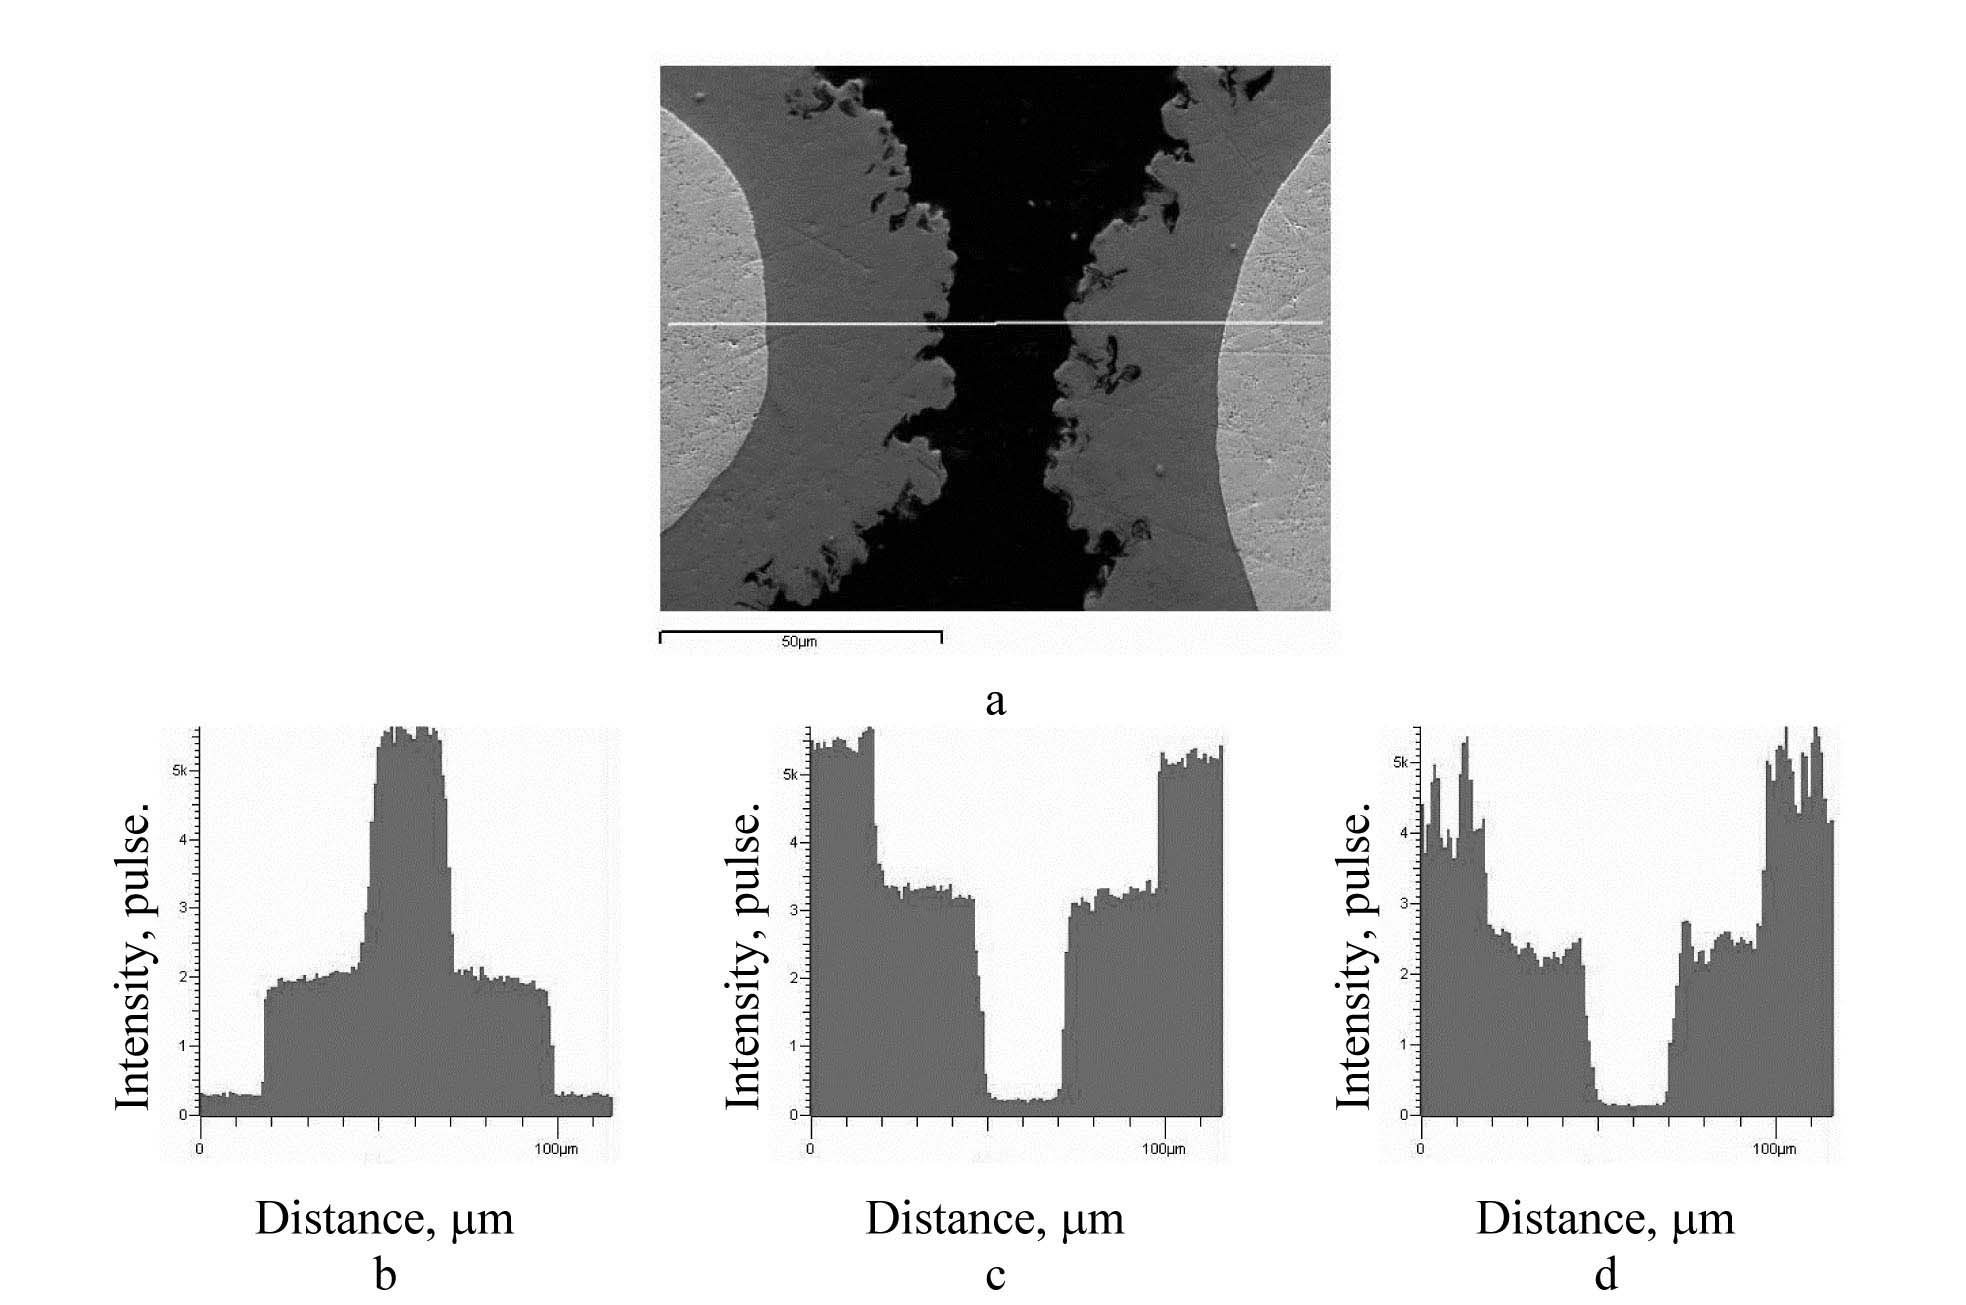
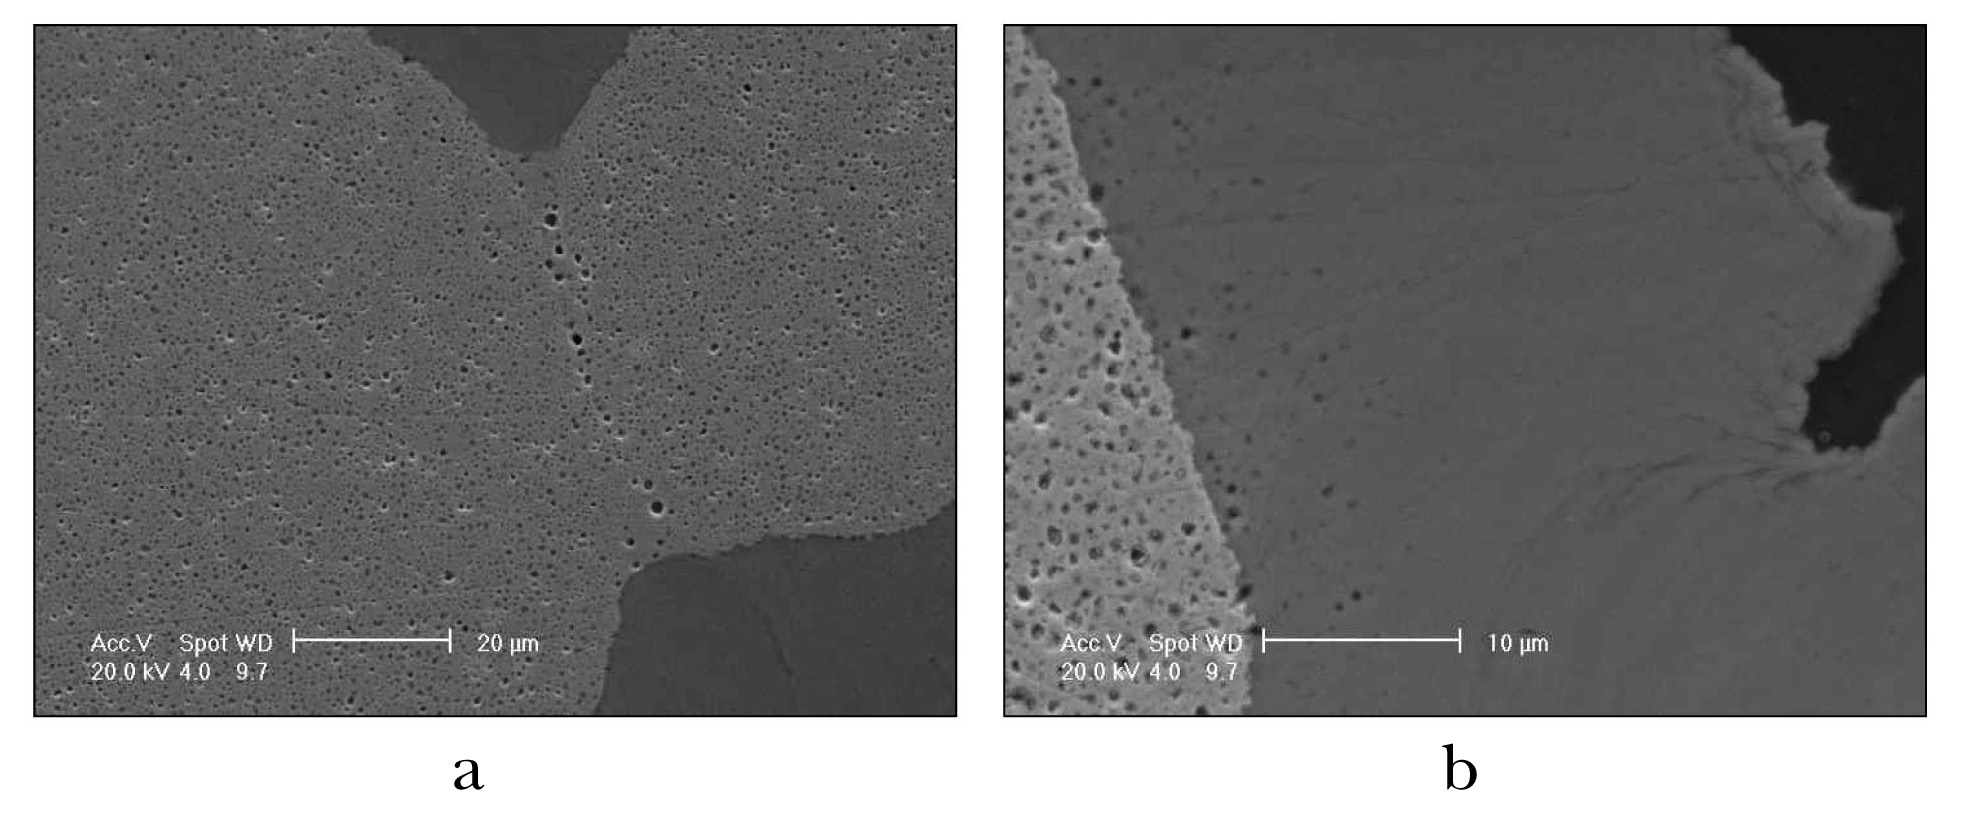
Larger pores to be up to 2.5μm in diameter appear at the boundaries of interacting particles (Fig.13- a). No pores were revealed at the boundary line of interaction layer and matrix at a burnup of ~85%. But the interaction layer exhibits porosity (pores are less than ~1.0μm in diameter) close to the fuel particle boundary at this burnup (Fig.13- b).
As the burnup increases from 60 to 85 %, a volume fraction of pores increases by a factor of ~ 3.2. In this case, re-distribution of U fission products takes place in the UMo alloy. Xenon and cesium are uniformly distributed in the grains of the U-Mo alloy at a burnup of 60%. It can be proved by the Xe and Cs distribution maps (Fig.14).
As a burnup of 85% is achieved, almost all Xe and Cs accumulate in the micro-areas. As a result of this, a lot of pores are formed. Precipitates of new phases appear both at the boundaries and in the grains of the U-Mo alloy (Fig.15). One can see pores and secondary phase precipitates on the SEM photographs (Fig.10).
As to Zr distribution, it shows that Zr remains in the solid solution of the U-Mo alloy up to a burnup of ~ 85% 235U.
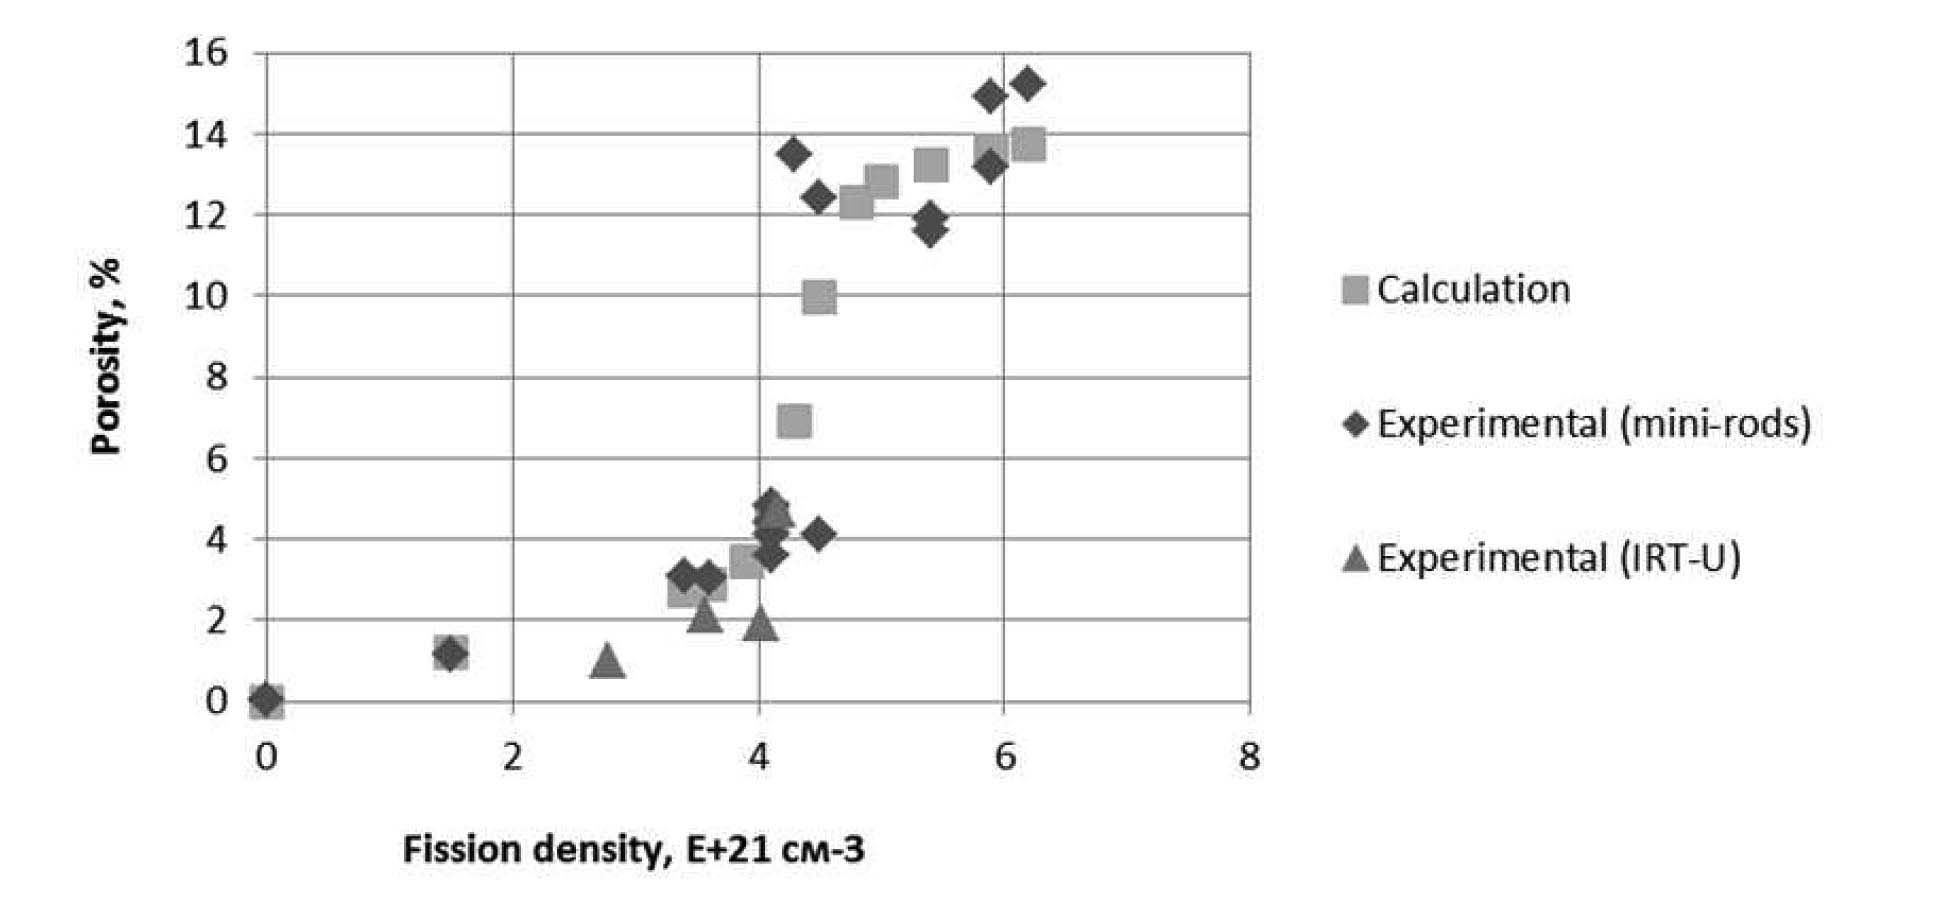
Fig. 16 demonstrates a volume fraction of pores in the U-9.4%Mo fuel particles in relation to the fission density. At a burnup of ~(65-70)% 235U or ~(13-14) % of total U or a fission density of ~ (4.3-4.5) 1021cm-3, a critical concentration of fission products in the fuel particles is achieved that leads to a certain restructurization of fuel and intensive porosity. With the further burnup growth, a degree of porosity intensity decreases abruptly.
A volume fraction of pores in fuel particles can be described as f
ΔV/V=K1(F2+(F/Fc)(2a+b)/(F+K1/K2(F/Fc)2a),
where F is fission density, ×E-21cm-3; Fc=3.8 is a critical value of fission density;
K1=0.8, K2=12.11, a = 15, b = 0.261 are constants.
It seems reasonable to perform additional investigations to clarify this dependence, including those at higher fission density values.
Summing up the results and PIE data related to minirods with U-Mo/Al dispersion fuel makes it possible to prove a well-known fact about a strong influence of the irradiation conditions on the degree of the fuel-matrix interaction. The 1st batch of mini-rods having U density of ~ 4g/cm3 and ~ 6g/cm3 were irradiated in the same irradiation rig besides fission rates were the same in fuel particles while thermal loads (heat rate and thermal flux from the surface) were in a direct proportion to the U density. It can be stated that the temperature of fuel meat having ~ 4 gU /cm3 was (10-15) ℃ lower as compared to the fuel meat having ~ 6 gU /cm3 those temperature was maintained at (85-105) ℃. The results of long-term irradiation show that the IL thickness in the mini-rods having lower density was (1-2) μm less that made up 10-20% of the total layer thickness provided that they were irradiated at 10-15 ℃ lower temperature. To develop the computation models enabling computation of the IL formation rates, it is necessary to obtain the irradiation data under a long-term maintenance of specified power and temperature values. Unfortunately, when the 2nd batch of mini-rods was irradiated, the thermal power changed cyclically in a wide range and as a result a thick (60-70μm) oxide film was formed that made the computation and analysis of temperature conditions rather complicated. Generally speaking, in order to provide experimental data support of computation models, specific experiments should be carried out because when fuel is irradiated under standard cooling conditions, the inlet coolant temperature changes, as a rule, depending on the reactor operating conditions but changes in the power of experimental fuel rods depend on both burnup and periodic refueling at the reactor.
According to the PIE data of mini-rods with the UMo/ Al dispersion fuel, any gas blistering was not observed in the fuel meat compared to the plate-type fuel rods [8]. Under the irradiation conditions given in the Table 1, gas blistering was not present both at the boundary of interaction layer and Al and at the boundaries of the U-Mo particles. Probably, the pin-type mini-rods having the above mentioned characteristics are irradiated under the specified conditions, the stresses and strain values are not enough to rupture the fuel meat while this fact takes place during irradiation of plate-type fuel elements up to a certain burnup.
The interaction layer is uniform both regarding its structure and distribution of U and Al over the thickness (Fig.2). The atomic ratio Al/(U+Mo) in the matrix of pure Al is within a range of ~ (7-9) but this value is much higher compared to the data obtained in the experiments IRIS-1 ~ (6-7), IRIS-2 ~ (4,4-5,8) and FUTURE (3,3-4,7) [9,10]. As to the matrix incorporating 2% and 5% of Si, the atomic ratio of (Al+Si)/(U+Mo) is ~ (5–6) and these data agree with the results discussed in ref. [11,12]. As Si has a restraining effect on inter-diffusion of Al and U, the lower (Al+Si)/(U+Mo) atomic ratio in the alloyed matrix as compared to the Al/(U+Mo) atomic ratio in the pure Al matrix is reasonable. The Al-U system has three intermetallic compounds UAl2, UAl3 and UAl4 in. Based on Al-U ratio, one can say that none of these compounds is formed in the interaction layer. According to the X-ray investigation of fuel with pure Al matrix irradiated up to burnups of 45%, 65% and 85% 235U, there were no any other crystal phases, except for Al and U. Numerous SEM and OM examinations did not reveal any phase precipitates in the interaction layer. Probably, the interaction layer is a non-stoichiometric amorphous alloy of Al and U to some extent. Another interesting fact is that at high burnups and thick interaction layer (~ 20μm) pores appear at a distance of ~ 10μm from the boundary of fuel particle. This distance corresponds to the free length of fission products in the U-Al layer (Fig.13b). In doing so, the interaction layer is not transparent for GFP and when a certain GFP concentration is achieved, gaseous porosity forms in it. It is worth noting that pores are larger close to the boundary of fuel particle and interaction layer.
According to the PIE data obtained for the mini-rods of the 1st batch [5], the 2nd one and the IRT-U fuel-size fuel rods, gaseous porosity formation in fuel particles becomes intensified at a burnup of ~(65-70)% 235U or (~12-14)% as to the total amount of U or at a fission density of ~4.5×1021cm-3. The size and number of pores tend to increase at the U-Mo grain boundaries and moreover, pores grew in the grain. Beyond that, new phase precipitates appeared both at the boundaries and in the U-Mo grains. Further increase of burnup from ~70% to ~90 235U leads to an abrupt decline in pore formation process. The XRD data of samples irradiated up to burnups of ~ 45% and ~67% demonstrated that the parameter of a γ-U unit cell increased by ~0.37% and ~0.39%, respectively
Conveniently, swelling of fuel particles could be broken up into three components:
1) Swelling resulted from the increase of the U lattice parameter. It was found out that the unit cell volume increased by 1.16% at a burnup of ~67%. Actually, the increase of the U crystal structure parameter stops when a burnup of 45% is achieved;
2) Solid swelling caused by solid fission products that are new phase precipitates at high burnup values;
3) Swelling resulted from gas pores formation. It is obvious that there is a nonlinear dependence of pore volume fraction on the burnup. Moreover, there is a kink region when the process of gas porosity formation intensifies abruptly at a fission density of ~4.5×1021cm-3. Later the rate of pore formation decreases abruptly after fuel restructuring.
An interesting fact that was noticed during PIE of fuel with Si additives in the matrix [3] is that the peripheral zone of some U-Mo particles was enriched with Si and porosity formation in that layer was essentially less than in the U-Mo particle on the whole.
In our opinion to restrain the effect of an abrupt increase of the gas porosity at attaining a certain critical value of fission density, the ternary systems U-Mo-Si could be promising. At the same time the interaction between U-Mo-Si and Al-matrix can be restrained and the effect of gas swelling can be reduced.
According to the PIE data of mini-rods incorporating Si additives in Al matrix, which were irradiated in the MIR reactor, the presence of 6-15 wt% Si in the U-Mo alloy prevents the process of gas porosity formation here.
The interaction layer of the U-Mo particles with the matrix is uniform both regarding its structure and distribution of U and Al over the thickness in the mini-rods irradiated up to a burnup of ~ 85% 235U. The EPMA data showed that the Al/(U+Mo) atomic ratio in the pure Al matrix was in a range of ~ (7-9). As for the matrix incorporating 2% and 5% of Si, the (Al+Si)/(U+Mo) atomic ratio amounted to ~ (5–6). According to XRD data of fuel with pure Al matrix irradiated up to burnups of 45%, 67% and 85%235U, there were no crystal phases, except for U and Al ones.
At a burnup of ~(65-70)% 235U or (~12-14)% as to the total amount of U or at a fission density of ~4.5×1021cm-3, gaseous porosity formation in fuel particles becomes intensified. The size and number of pores tend to increase at the U-Mo grain boundaries and moreover, pores grew in the grain. Beyond that, new phase precipitates appeared both at the boundaries and in the U-Mo grains.
Conveniently, swelling of fuel particles could be broken up into three components:
1) Swelling resulted from the increase of the U lattice parameter;
2) Solid swelling caused by solid fission products that are new phase precipitates at high burnup values;
3) Swelling resulted from gas pores formation.
The data on the structure of the fuel meat and porosity of the U-Mo alloy particles in the full-size fuel rods are in good agreement with the reveled regularities for minirods. The IRT-U fuel rods reveled an abrupt increase of porosity in the U-Mo alloy at a burnup of 40% to 60% 235U.