Many ways to reduce coastal beach erosion have been introduced, including the typical method of constructing a conventional submerged breakwater. However, the conventional breakwater has the disadvantage of rapidly changing its neighboring wave field, due to excessive wave reflection or wave energy dissipation. To overcome such disadvantage, smooth wave energy control may be required. In this respect, many studies have been conducted on a horizontal plate with a relatively larger transmitted wave energy ratio (Tuck, 1975; Isaacson et al., 1998; Cho and Kim, 1998; Cho, 2002; Kee et al., 2006; Cho and Kim, 2013). Meanwhile, the hydrodynamic performance of a perforated horizontal porous plate was investigated by a series of analytical and numerical investigations (Liu, et al., 2007; Liu et al., 2008; Liu et al., 2013).
It is considered possible for the submerged horizontal dual plate to control the transmitted wave height, thanks to the correlation between the incident wave length and the plate width. Kweon et al. (2005) proposed a permeable breakwater that uses a horizontal dual plate with a submerged depth as the wave energy dissipation plate, and named the structure a “steel-type breakwater” (STB). A series of related researches (Kweon et al., 2008; Kwon et al., 2011; Lee et al., 2011; Kweon et al., 2012) that followed verified the stability and functionality of the detached steel-type breakwater, using a horizontal porous dual plate with a submerged water depth as the dissipation material, through structural design methodology, and experimental verification in a real sea.
In particular, Kweon et al. (2011) proposed a method of estimating the vertical uplift force that acts on the horizontal plate, applicable to the design of the pile uplift drag force. Then, Kweon et al. (2012) confirmed the validity of the load estimation methodology suggested by Kweon et al. (2011), by measuring and analyzing the displacement of a steel-type breakwater that was installed in a real sea. However, the difference between the method proposed by Kweon et al. (2011), which estimates the wave force based on the maximum pressure at an individual point, under the action of a regular wave that corresponds to the significant design wave, and the wave force measured at a different time without a phase difference, have not yet been clearly compared. This research intends to verify a reasonable method of estimating the external design force that acts on the horizontal plate, by conducting a hydraulic model test.
Meanwhile, Goda (1974) proposed a wave pressure equation that acts on an unfolded caisson breakwater, based on the results of a number of hydraulic model tests and site observations. After its validity was proven from worldwide use, Goda’s equation was accepted as the standard means of estimating the wave pressure that acts on the vertical breakwater walls, replacing Hiroi’s equation (Hiroi, 1919). Goda’s equation is based on quasi-static approaches to the wide ranges of wave pressure and force measurement data, and basically presents the maximum wave pressure at each point area that acts on a vertical breakwater wall, rather than the simultaneous pressure. Therefore, there are many cases in which the wave pressures acting on a vertical wall at a particular moment and a particular point area are much smaller, than those measured with Goda’s pressure equation. In normal structural design, such as a caisson breakwater, the total wave force obtained by integration of Goda’s pressure formula over the entire height of the vertical wall is conventionally considered as the external design force. In addition, Goda (1974) recommended use of the equation
EXPERIMENTAL SETUP AND DATA ACQUISITION SYSTEM
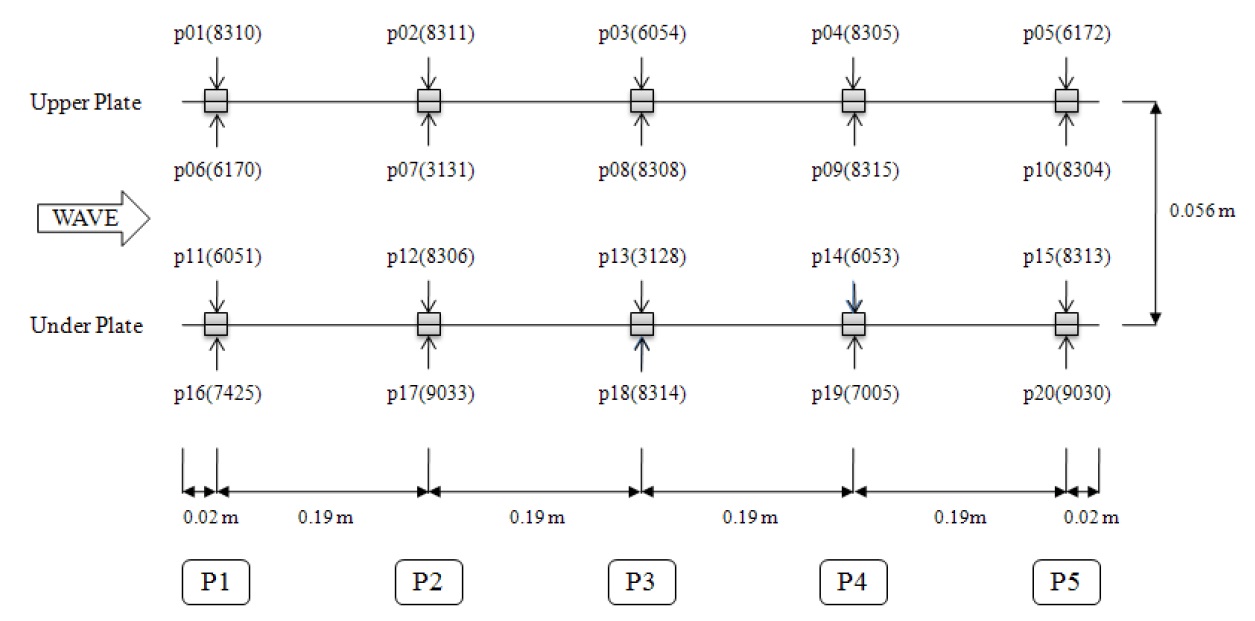
A 1/25-scale model section was installed in a one-directional flume to measure the wave pressure, the wave pressures of the waves that passed the middle part of the wave maker were measured by point area. The experimental section was divided into three sections, by assembling the measurement subjects, i.e. the upper and lower plates, in the middle, to be independent of each other; and the wave pressures were simultaneously measured and monitored.
>
Design and manufacture of the model
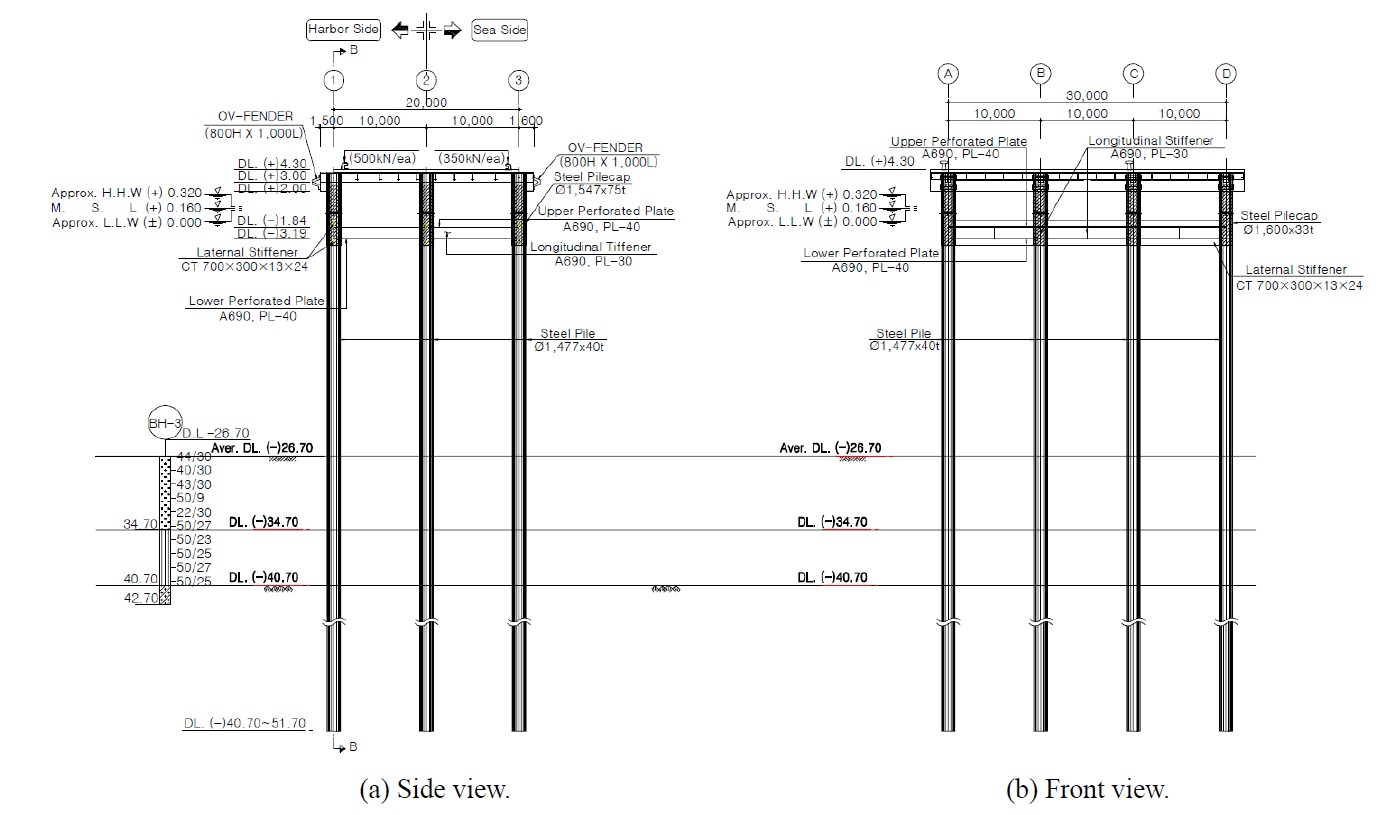
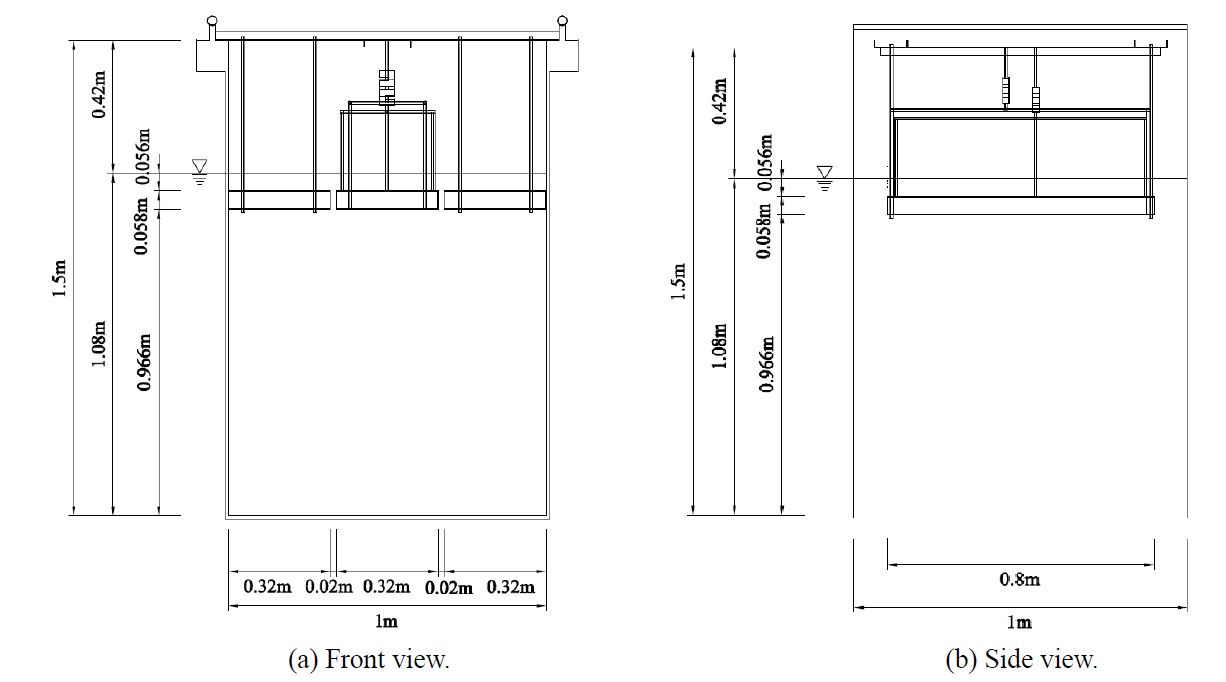
The test model was manufactured according to the design of D breakwater, composed of vertical piles and horizontal porous plates (see Fig. 1). The experimental setup of the model breakwater is presented in Fig. 2. The model scale was determined to be 1/25, considering the dimension of the wave flume and the wave maker capacity. The horizontal porous plate was made of steel, and divided into three sections in the transverse direction, as shown in Fig. 2(a). The gap between each of the three sections in the transverse direction was set to be 2
The model breakwater was connected by a support pole to the horizontal bar attached to the upper part of the wave flume, as shown in Fig. 2. The upper and lower porous plates were connected to the two load cells independently, through the support system. The support system for the upper and lower plates did not contact each other. In particular, the vertical pole holding the lower plate was designed to not touch the upper plate. In this manner, the wave load acting on the upper and lower plates could be measured independently. The middle plate was 0.8
>
Experimental equipment and measurement system
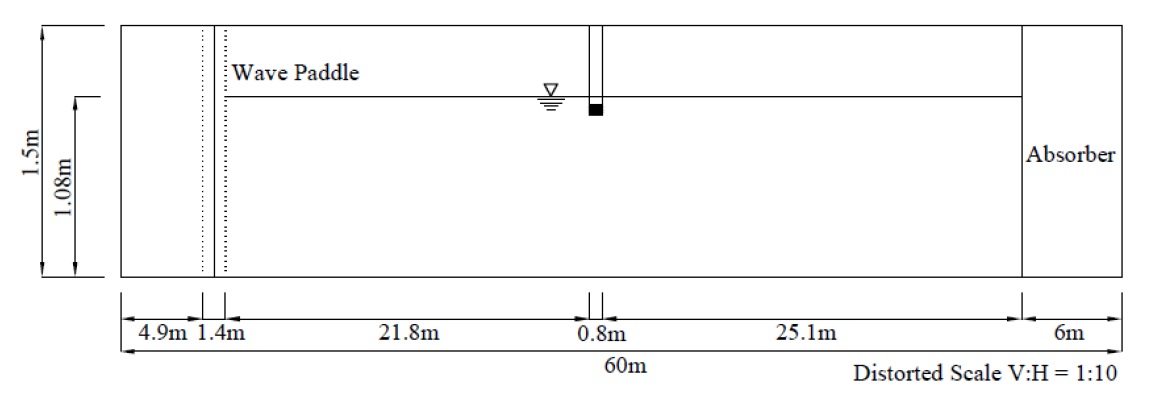
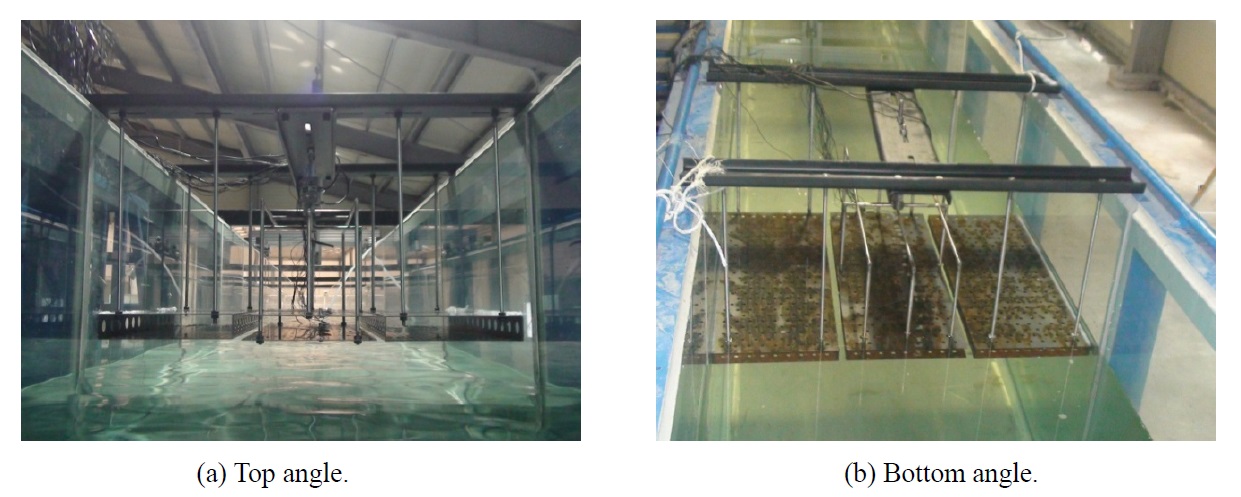
The hydraulic model test was conducted in a two-dimensional wave flume of 60.0
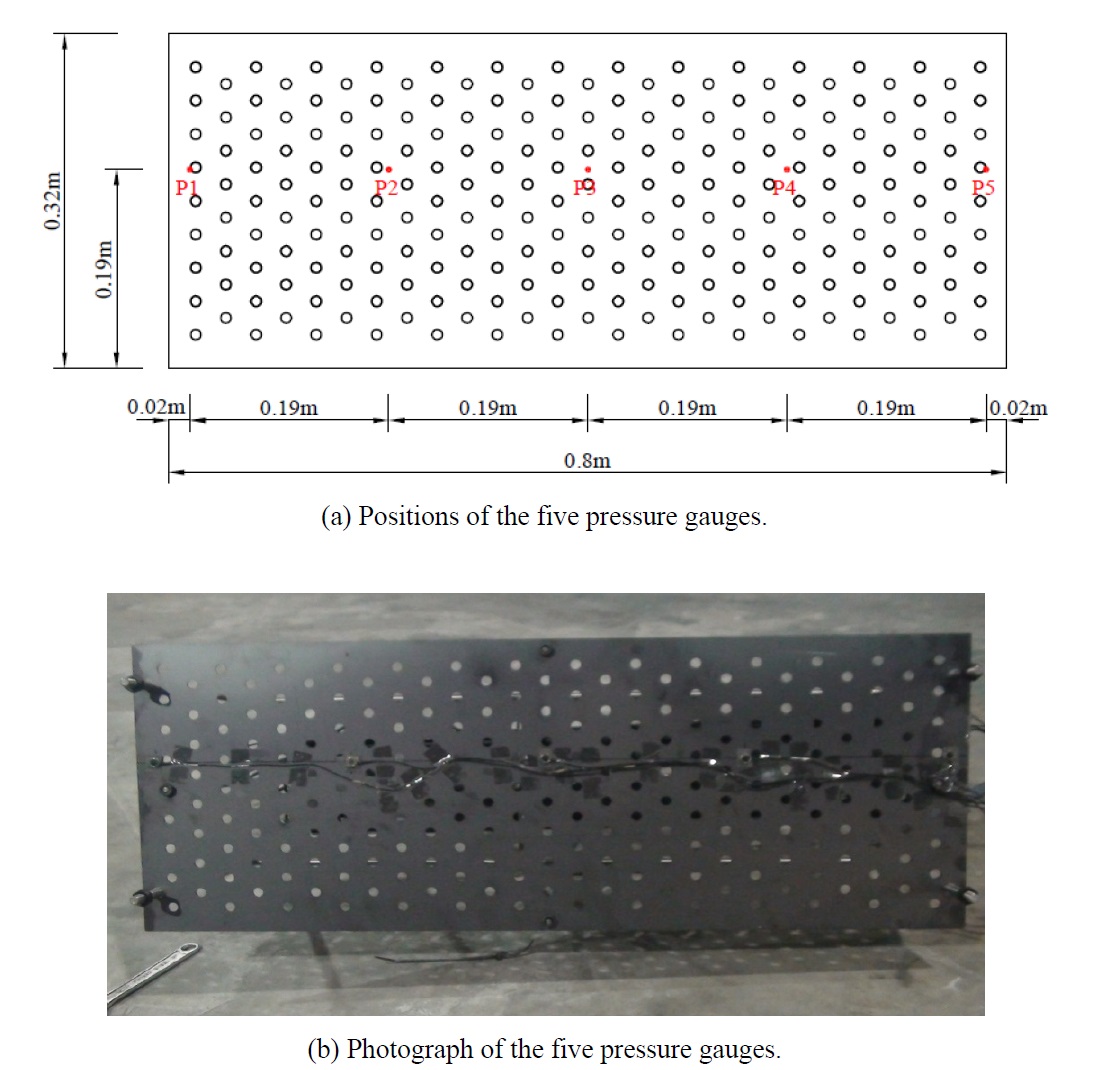
Adhesion-type pressure gauges manufactured by SSK Co. Japan were used in the experiment. The capacity of these pressure gauges was 10
In order to verify and enhance the accuracy of the wave pressure measurement, the wave forces acting on the horizontal plates were simultaneously measured by load cells connected to the support system. Fig. 6 shows photographs of the supporting bars holding horizontal plates and the load cells, which were connected to the support system at the upper part of the wave flume. Meanwhile, the measurement data obtained from the pressure gauges and load cells were collected using a data acquisition system, transferred to a notebook PC through a USB cable, and saved on hard disc. The wave pressure signals were monitored in real time during the experiment, using data acquisition software.
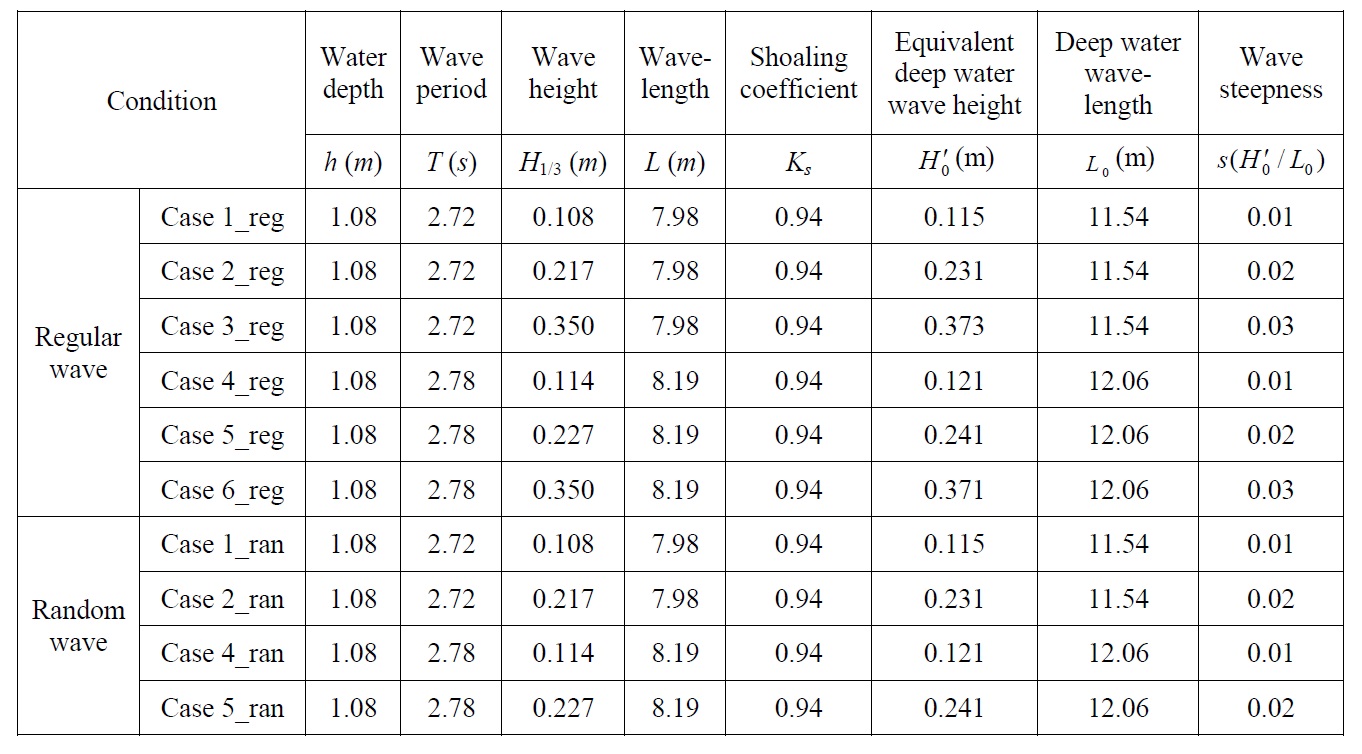
The incident waves for the experiment were selected so that the wave steepness (
[Table 1] Experimental wave conditions.

Experimental wave conditions.
The methods with regular waves and random waves were analyzed, and compared with the wave force estimation method proposed by Kweon et al. (2011), using the maximum wave pressure at the point areas produced by the regular wave that corresponded to the significant wave. The incident waves for the experiment were selected so that the wave steepness (
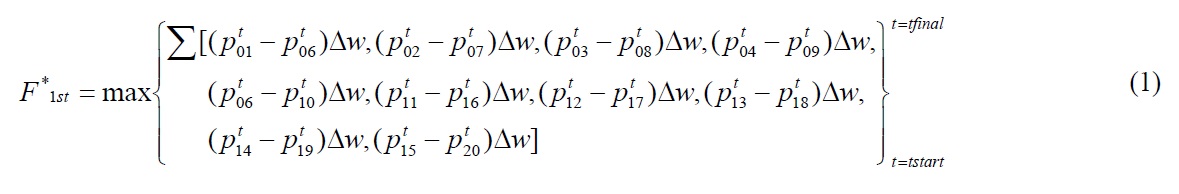
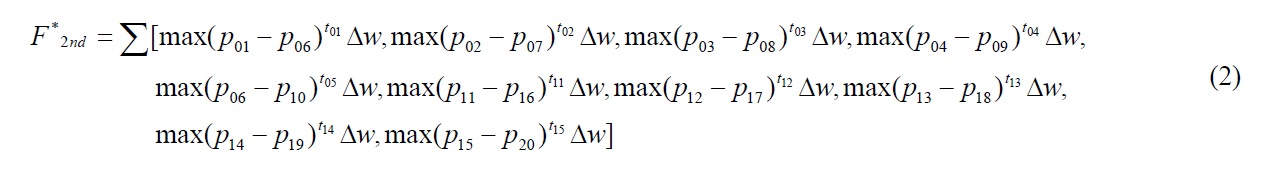
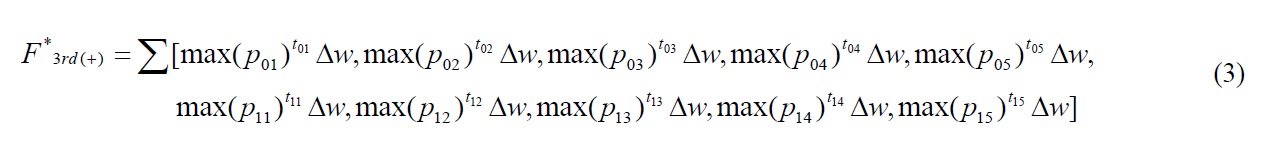
To calculate the total wave force acting on the horizontal plate, three different methods were used, considering differences in wave pressure distribution along the plate. In the first method, the maximum wave forces were calculated from the instantaneous pressure distributions obtained at exactly the same time. In the second method, the total wave forces were calculated based on the wave pressure distributions with consistent wave phases, but at different times. In the third method, the total wave forces were estimated from the maximum pressure distributions, irrespective of the influence of the wave phases, as well as acting time. For all the three methods, the difference in wave pressure between the upper and lower sides of the horizontal plate was calculated, and used for estimating the net wave force acting on the plate. The analysis methods according to the aforementioned three types of wave distributions are referred to as methods A, B and C, respectively. The mathematical equations corresponding to the three methods are presented in the following:

where,
By the first analysis method

the total wave force was calculated, based on the wave pressure distribution at a certain particular time (
>
Results of the wave pressure analysis
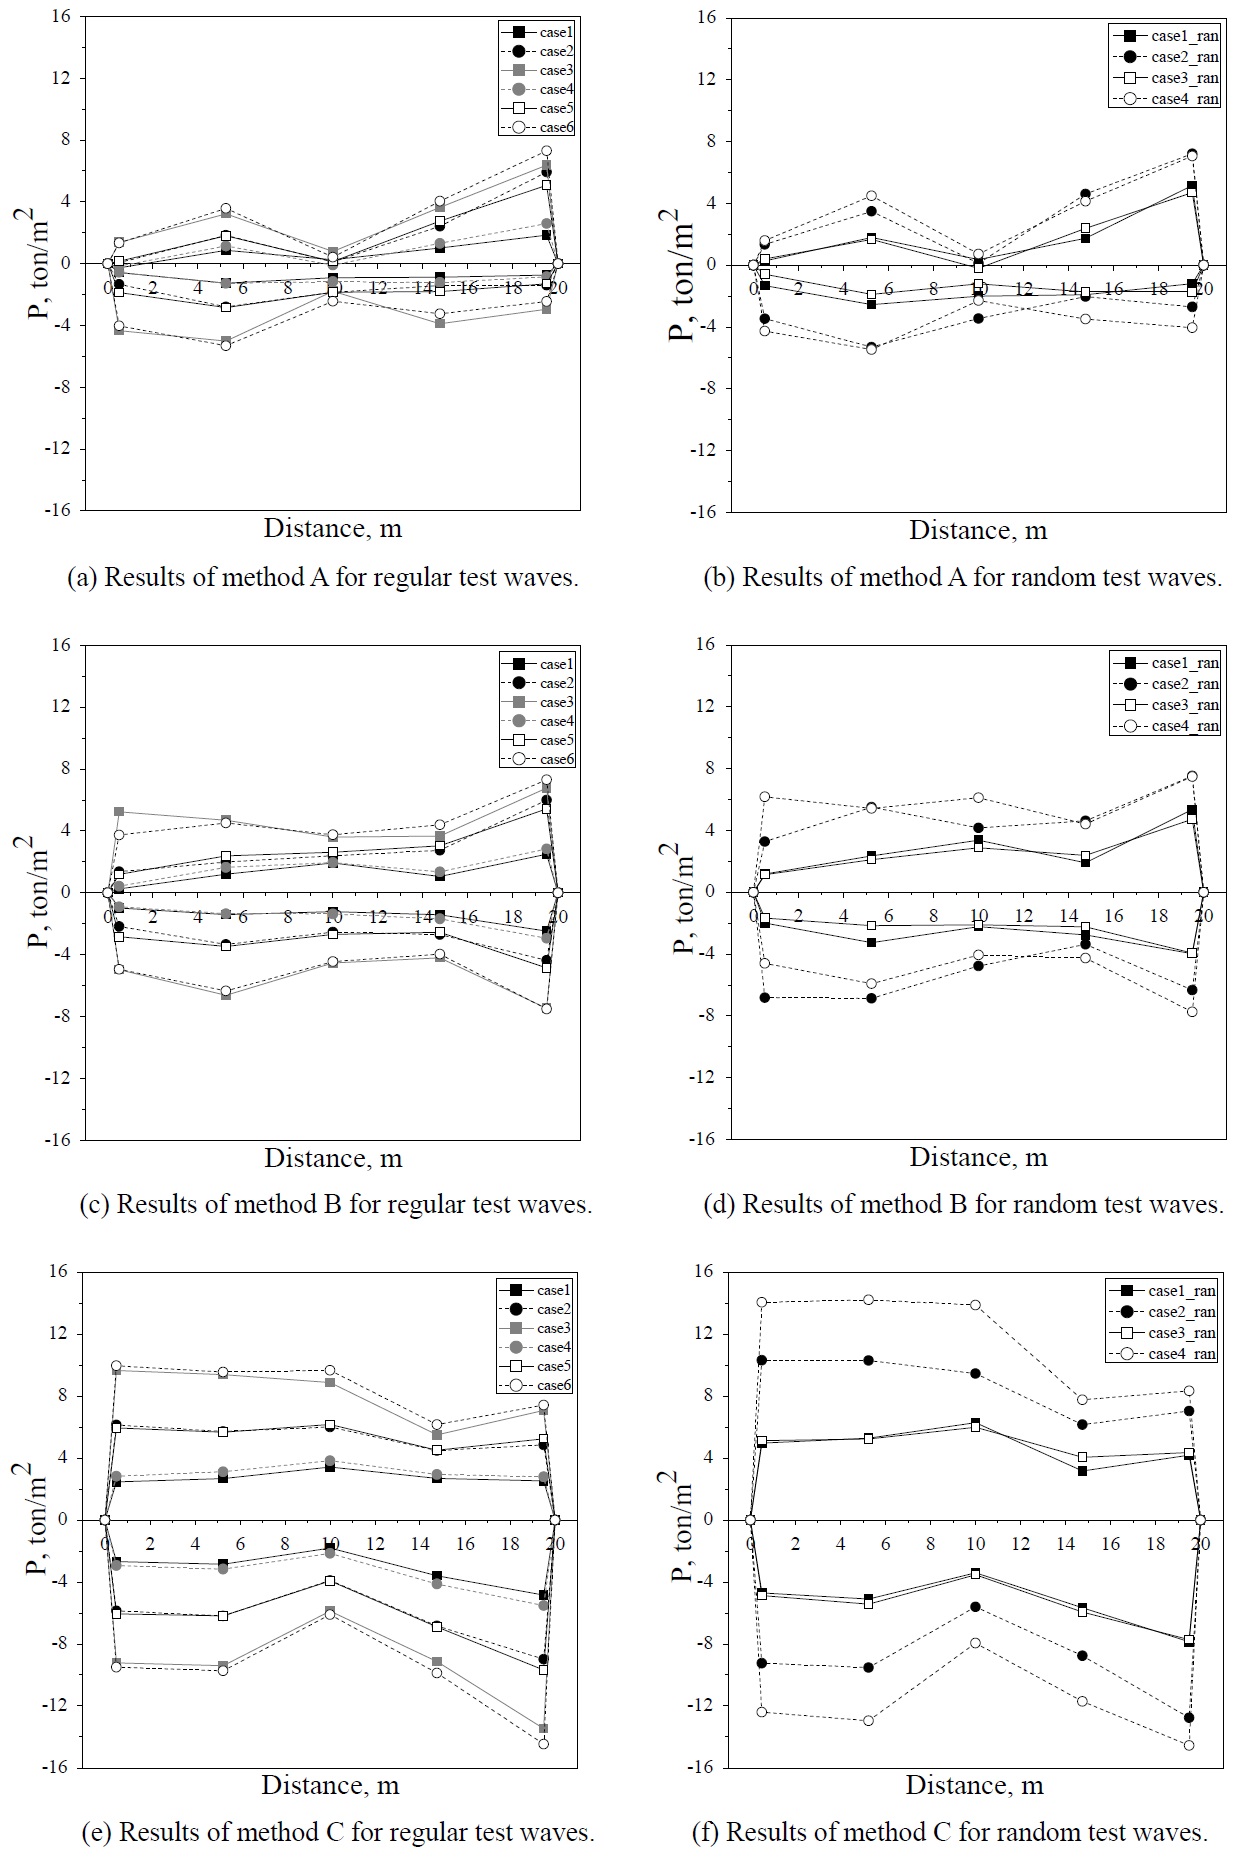
The wave pressures measured in the experiment were converted to values corresponding to the real sea. Fig. 7 shows wave pressure distributions along the horizontal plate, where positive ( ) value represents downward pressure, whereas negative (-) depicts uplift force. The figure shows that the magnitudes of the wave pressure were different, according to the measurement point. In addition, pressures of the random waves were generally larger than those of the regular waves having similar wave height. The magnitude of wave pressures were larger sequentially, with the order of analysis method A, B and C. When method A was used in the analysis, the maximum pressure was measured at the most downstream pressure gauge. The difference in pressure magnitude between the regular and random wave was relatively small by this method. This implies that the differences in pressure distribution between the regular and random waves were insignificant, if the wave pressures on the upper and lower sides of the horizontal plate were taken into account together. In contrast, the apparent pressure difference between the results of regular and random waves was shown, when method C was applied in the analysis, as clearly seen in Figs. 7(e) and (f). This indicates that significant difference in pressure distribution might be obtained between the regular and random waves, if only the wave pressures acting on either one of the upper or lower side of the horizontal plate are considered. One noteworthy thing in Fig. 7 is that the pressure magnitude in Fig. 7(d), corresponding to the random wave result by Goda’s method (1974), is rather smaller than that in Fig. 7(e), corresponding to the regular wave result by the method presented in Kweon et al. (2011).
>
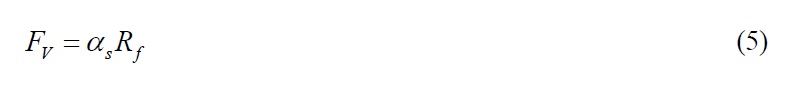
Safety factor of the pile uplift force
The external design force that was applied on the pile against the uplift or pullout force can be estimated as follows:
where,
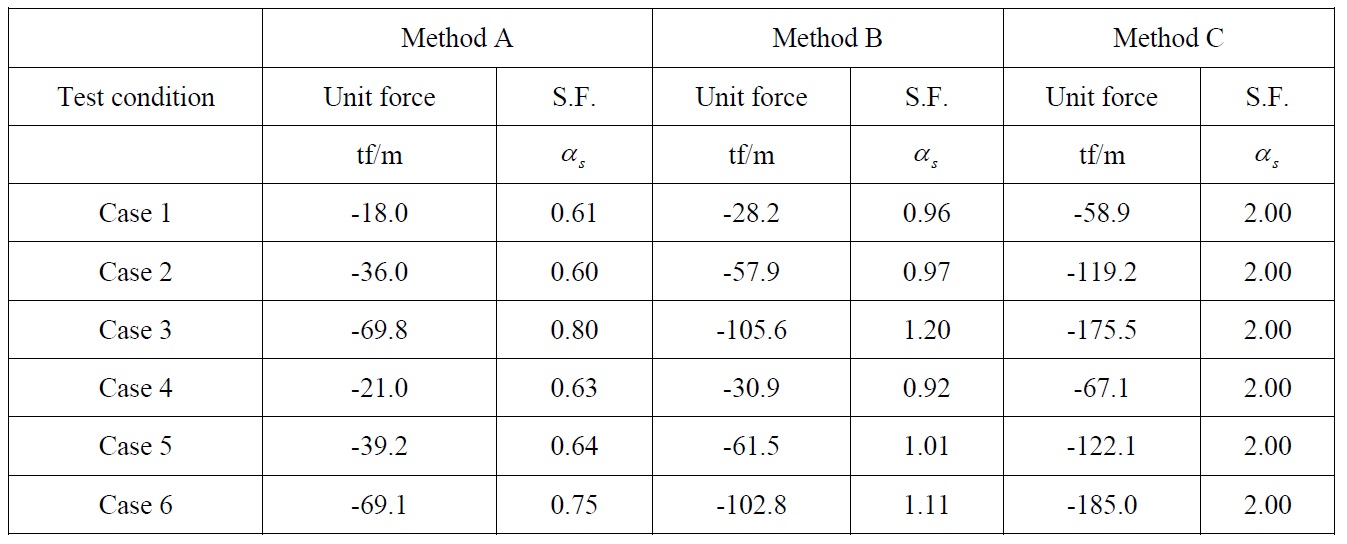
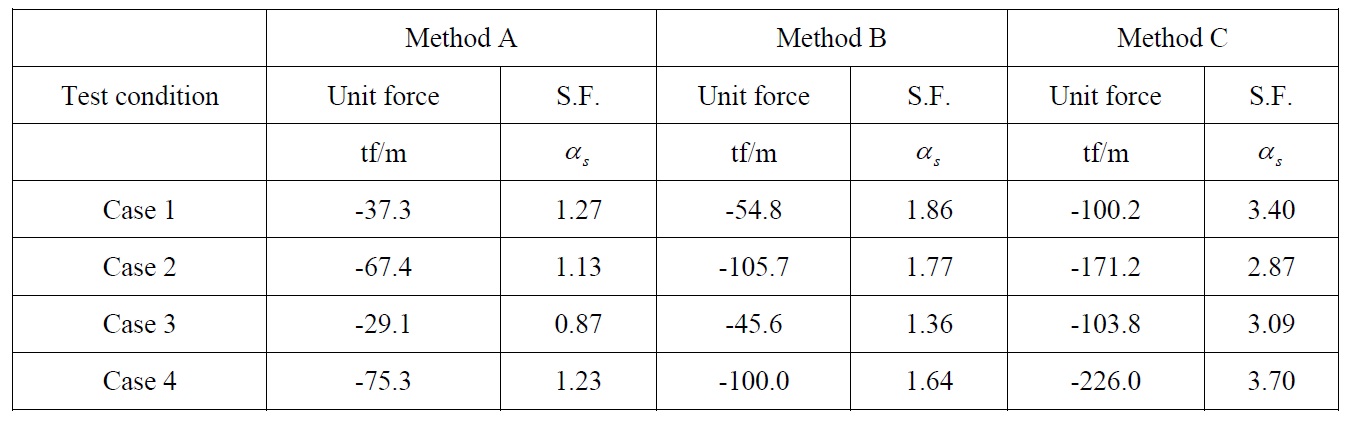
In order to calculate and compare the safety factors by the other two methods, the unit wave force acting upward on the horizontal plate was obtained by integrating the pressure distributions along the plate shown in Fig. 7. Then, the integrated wave forces by the two methods were divided by the corresponding value for the regular wave case, calculated by method C. Finally, the divided values were multiplied by two, for easy comparison. Tables 2 and 3 show the thus obtained safety factors for the regular and random wave cases, respectively. The safety factors shown in the two tables can be interpreted as relative factors, compared to the proposed value of 2.0, by the method shown in Kweon et al. (2011).
[Table 2] Comparison of the uplift forces and safety factors (regular wave case).

Comparison of the uplift forces and safety factors (regular wave case).
[Table 3] Comparison of the uplift forces and safety factors (random wave case).

Comparison of the uplift forces and safety factors (random wave case).
As shown in Table 3, safety factors by method C for the random wave case were only larger than those corresponding to Kweon et al. (2011). In the other four cases, the estimated factors were smaller than 2.0. The average safety factor according to method A for the random wave case was approximately 1.0, almost half of the results by Kweon et al. (2011). In particular, the safety factors estimated by method B, corresponding to Goda’s formula, were comparable, but still smaller than 2.0. Although the design uplift force can be satisfactorily estimated by using Goda’s formula, the method proposed by Kweon et al. (2011) might be more convenient to use, as it is based on the pressure distribution obtained from regular wave action.
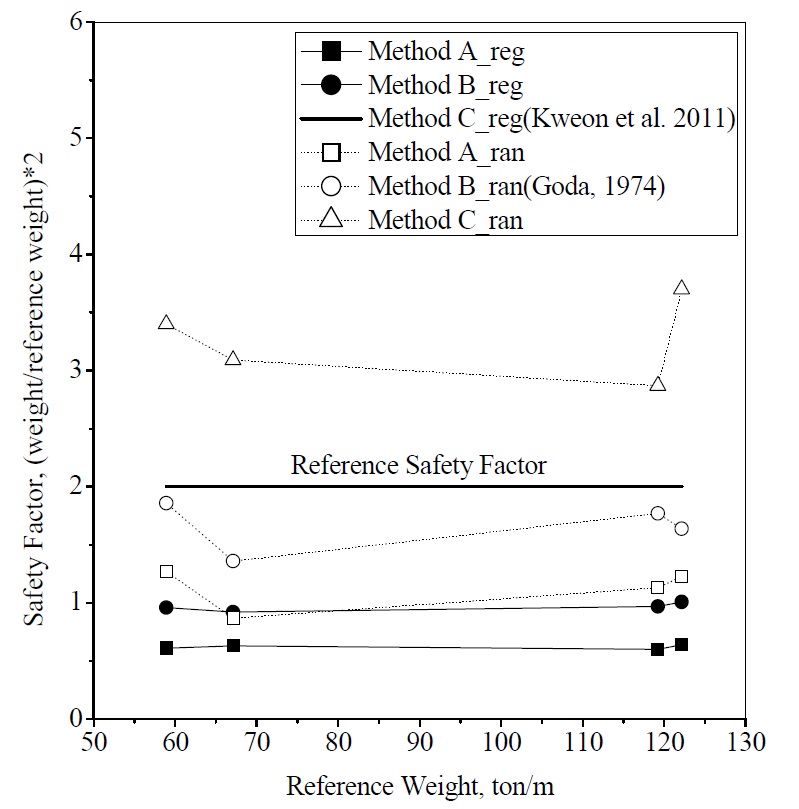
Fig. 8 shows the values of safety factor for the wave load acting on unit length, calculated by the above methods, respectively. As shown in the figure, the safety factor due to method C for the random wave case was 3.0, which is greater than the method of Kweon et al. (2011). Meanwhile, the value was smaller for all the other four methods. In particular, it was only 1.0 on average, when estimated by the method A for random waves, where wave loadings are acting at the same time. The method B for random waves, corresponding to the case applying Goda’s method to the horizontal plate, also yields a smaller safety factor than 2.0.
The steel-type offshore breakwater that is supported by vertical piles and dual horizontal plates should be designed safely against the uplift force acting on the plates. Kweon et al. (2011) proposed a method for estimating the design uplift force, based on the regular wave corresponding to the design significant wave. This method was verified by real sea experiment, as reported in Kweon et al. (2012), which demonstrated that the safety factor of 2.0 could be satisfactorily used, by restricting the possible pile displacement within some allowable limit. However, this method has not been clearly compared with the conventional design methods, particularly with the well-known pressure equation proposed by Goda (1974). In order to further investigate this imperfection, a hydraulic model test was conducted in this study, by measuring the wave pressures acting on the horizontal plates. By estimating the wave forces using three different analysis methods, and comparing the relative safety factors for the pile uplift force, according to the use of the different methods, the following conclusions were obtained.
(1) The safety factor of the pile uplift force estimated from the randomly varying wave pressure acting at the same time was estimated to be approximately 1.0, on average.
(2) The safety factor of the pile uplift force estimated by Goda’s pressure estimation method was smaller than 2.0, on average. Use of Goda’s method might underestimate the uplift force, as the corresponding safety factor is found to be smaller than that estimated from the real sea experiment of Kweon et al. (2012). This study applied Goda’s concept for the vertical barrier to the horizontal one.
(3) The safety factor estimated by method C for random waves was approximately 3.0 on average, so that this method might overestimate the pile uplift force.
(4) The methodology of estimating wave force based on the maximum upward pressure of the regular wave corresponding to the significant design wave, suggested by Kweon et al. (2011), seems to be used as a reasonable design method, for estimating the pile uplift force acting on the steel-type offshore breakwater. This method has the advantage of using the regular wave, in estimating the design uplift force.