Taking into account the increasingly stringent legislation on emissions from marine engines, this work aims to analyze several internal engine modifications to reduce NOx (nitrogen oxides) and other pollutants. To this end, a numerical model was employed to simulate the operation cycle and characterize the exhaust gas composition. After a preliminary validation process was carried out using experimental data from a four-stroke, medium-speed marine engine, the numerical model was employed to study the influence of several internal modifications, such as water addition from 0 to 100% water to fuel ratios, exhaust gas recirculation from 0 to 100% EGR rates, modification of the overlap timing from 60 to 120°, modification of the intake valve closing from 510 to 570°, and modification of the cooling water temperature from 70 to 90 ℃. NOx was reduced by nearly 100%. As expected, it was found that, by lowering the combustion temperature, there is a notable reduction in NOx, but an increase in CO (carbon monoxide), HC (hydrocarbons) and consumption.
Over the last few years, as concern about air pollution increases, several legislative measures have been taken. In terms of marine engines, the Environmental Protection Agency and the European Commission limit emissions in the United States and the European Union respectively. On an international level, the International Maritime Organization (IMO) has set up and maintained a comprehensive regulatory framework for shipping. In 1973, the IMO adopted Marpol 73/78, the International Convention for the Prevention of Pollution from Ships, designed to reduce marine pollution. Particularly, Marpol Annex VI places limits on SOx (sulphur oxides) and NOx. With the former, it limits the sulphur content of fuels. For the latter, it establishes a curve that indicates maximum allowable NOx emission levels depending on engine speed, geographical area and manufacturing data.
Due to the special attention that legislation pays to NOx emitted from marine engines, various reduction methods have been developed over recent years. The main factors influencing NOx formation are concentrations of oxygen and nitrogen, along with local temperatures in the combustion process. Therefore, internal engine modifications focus on lowering oxygen and nitrogen concentrations, peak temperature and the amount of time in which combustion gases remain at high temperatures.
A very common internal modification to reduce NOx from marine engines is water addition. This measure reduces NOx formation for two reasons. The specific heat capacity of the cylinder gases is increased because water has higher specific heat capacity than air. Moreover, the overall oxygen concentration is reduced. Water’s effects will vary with the engine type, but generally 1% percent of water reduces NOx by 1%, Woodyard (2009).
Another common way to reduce NOx emissions is exhaust gas recirculation (EGR). This lowers the combustion temperature, and, consequently, NOx, by recirculating a portion of the exhaust gases to the charge air. As is the case with water addition, EGR reduces NOx formation due to an increase in the specific heat capacity of the cylinder gases and reduced overall oxygen concentration. Geist et al. (1998) found a 22% NOx reduction with 6% EGR in the Wärtsilä 4RTX54 research engine. However, they postulated that EGR increases smoke, HC and CO. Millo et al. (2011) analyzed EGR combined with other modifications in a Wärtsilä W20 marine engine and obtained NOx reductions of up to 90%.
Another way to reduce NOx is by modifying the injection pattern. In this way, a delayed injection leads to lower peak pressures and, therefore, temperatures. Retarding injection timing also decreases the amount of fuel burnt before the peak pressure, thus reducing the residence time. Okada et al. (2001) applied an injection timing retard of 7° to the MAN B& W 4T50MX research engine and obtained a NOx reduction of about 30% and an increment in consumption of about 7%. Li et al. (2010) also analyzed the influence of the fuel injection advance angle on NOx emissions. In another study, Moreno Gutiérrez et al. (2006) looked at consumption and NOx emissions in several marine engines with different injection timings. Al-Sened and Karini (2001) found that pre-injection can be used to shorten the delay period and thus decrease the temperature and pressure during the early stages of combustion, resulting in reduced NOx. Fankhauser and Heim (2001) also found that pre-injection reduces NOx with a slight increase in fuel consumption. They studied a Sulzer RT-Flex common rail engine. With triple injection, they injected the fuel charge in separate, short sprays in succession. With sequential injection, each of the three nozzles in a cylinder was actuated with different timing. The results showed about a 30% NOx reduction with about an 8% increase in fuel consumption.
In addition to these engine modifications, downstream cleaning techniques are also commonly employed to remove NOx and other pollutants from exhaust gases. According to Sulzer (1994), MAN B& W (1997), Caterpillar (2001) and Wärtsilä (2002), SCR can eliminate more than 90% of the NOx. The drawbacks of using catalytic converters in ships are well known. Reducing agents are required and the catalytic reactor takes up additional space, making catalytic convertors unsuitable for marine diesel engines. Consequently, modifying the internal engine is the best option for reducing the formation of pollutants on board ships.
The aim of the present work was to analyze the potential of internal engine modifications to reduce NOx and other pollutants in the Wärtsilä 6
DESCRIPTION OF THE ENGINE AND NUMERICAL PROCEDURE
The Wärtsilä 6
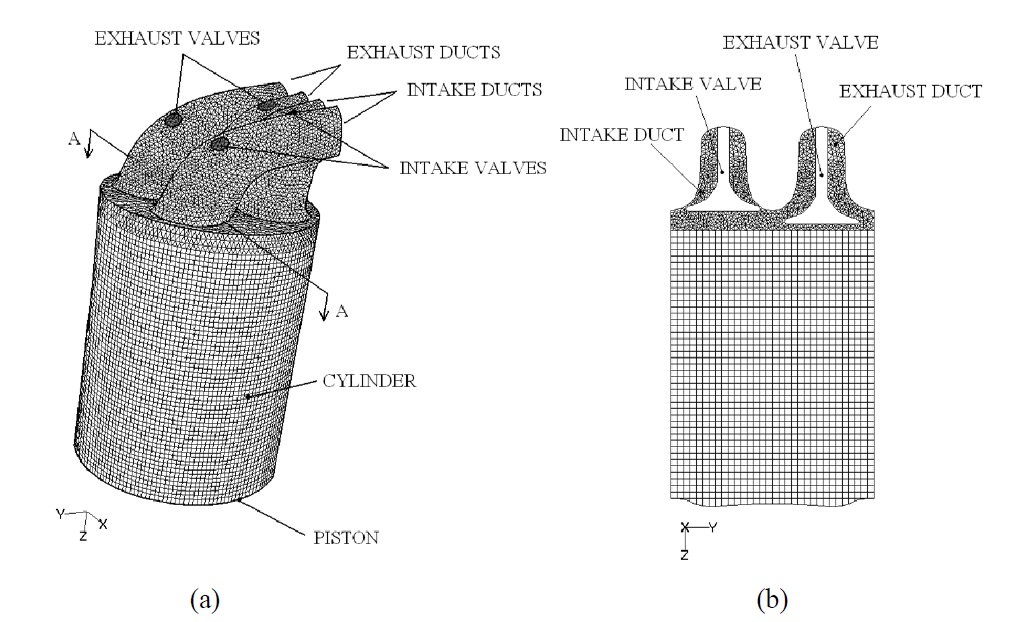
The numerical simulation was developed in Lamas et al. (2012), with the exception of the combustion process, which was treated in Lamas and Rodríguez (2013). Both works employed the commercial software ANSYS Fluent for the numerical computations and SolidEdge for the CAD 3D design. Fig. 2 shows the computational mesh at the crankshaft angle position corresponding to BDC.
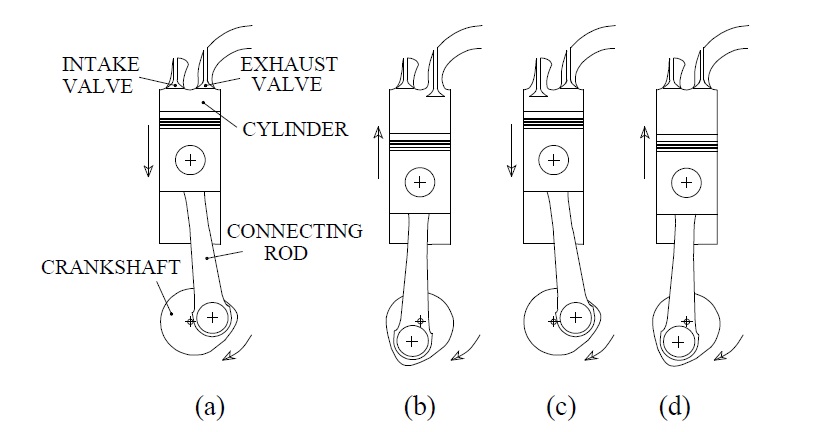
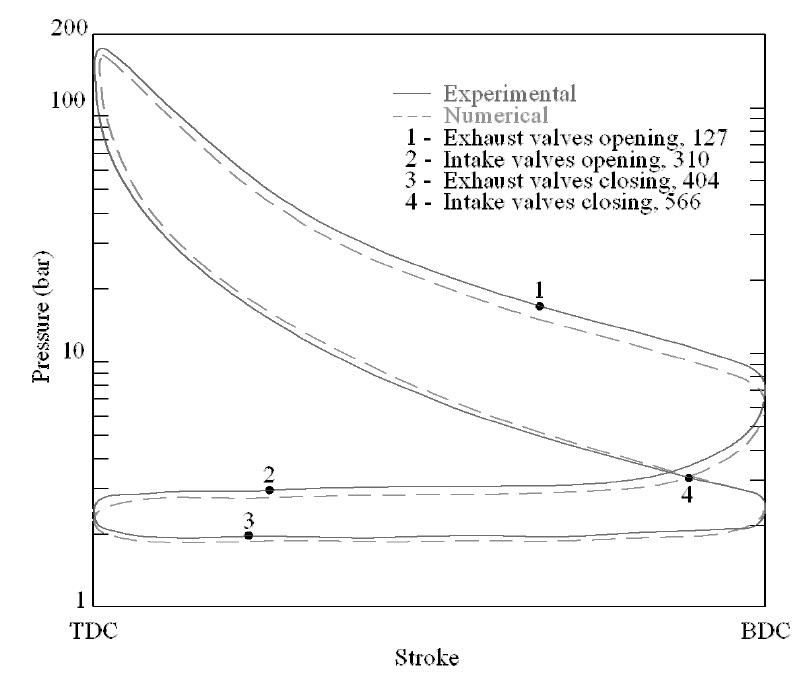
The Lamas et al. (2012) and Lamas and Rodríguez (2013) models can be joined to simulate the entire operating cycle. These results and a comparison with experimental data are shown in Fig. 3. This figure represents the experimentally and numerically obtained results for in-cylinder pressure, in logarithmic scale, against the piston position. In this figure, the experimental results were obtained using the MALIN 6000 (Malin Instruments, Ltd.) engine performance analyzer. As can be seen, a good concordance was obtained. Assuming the reference was in the TDC at the beginning of the power stroke, the exhaust valves open at 127° and close at 404°, while the intake valves open at 310° and close at 566°. There is a valve overlap period, between 310° and 404°, in which all the valves are opened at the same time.
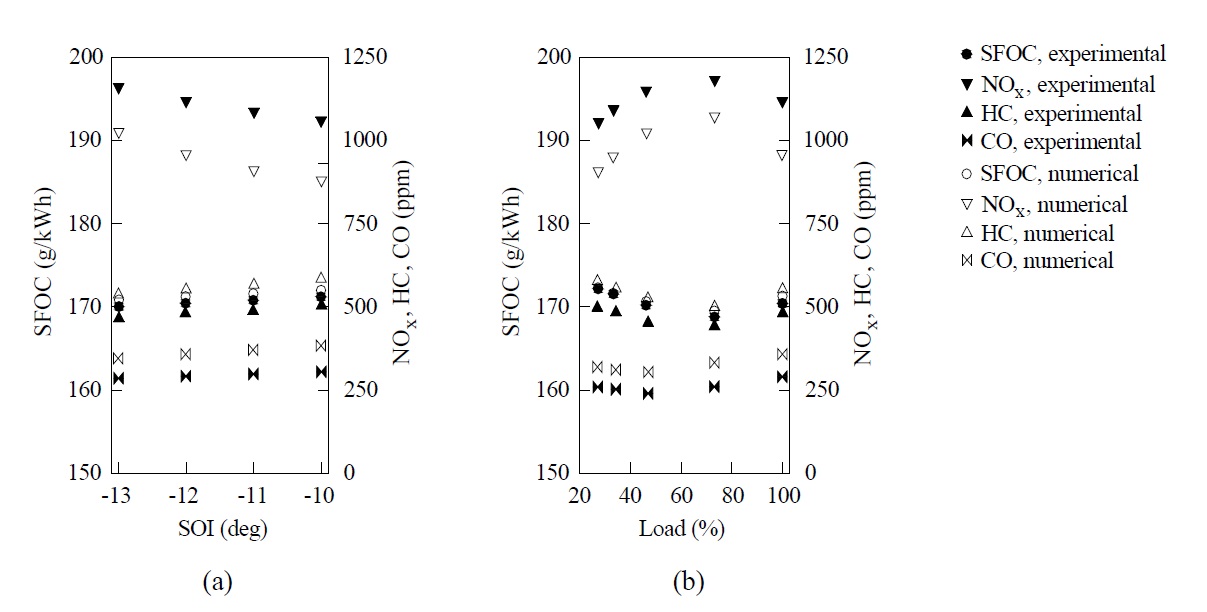
Another comparison between the numerical and experimental results is given in Figs. 4(a) and (b). These figures show a satisfactory correspondence between both procedures. According to the NOx Technical Code, the tests correspond to the E2 cycle, that is, a constant engine speed is kept. Fig. 4(a) provides the SFOC (Specific Fuel Oil Consumption) and NOx, HC and CO emissions against the start of injection. Numerically, the SFOC was computed as the relation between consumption and the indicated power. The indicated power was obtained from the indicated work, which is the area under the pressure-volume diagram. A conclusion obtained from Fig. 4(a) is that delayed injection timing reduces NOx but increases SFOC, CO and HC.
Briefly, a delayed injection leads to less burning time and, consequently, less NOx is produced. It also reduces temperature and pressure and, consequently, there is greater SFOC. Retarding injection timing increases HC and CO emissions because a shorter burning time causes deficient combustion.
Fig. 4(b) shows the SFOC and emissions of NOx, HC and CO against the load. Experimentally, the NOx, HC and CO emissions were measured using the G4100 (Green Instruments), Gasboard-3040 (Wuhan Cubic) and Gasboard-3050 (Wuhan Cubic) analyzers, respectively. This figure also shows a good concordance between experimental and numerical results. It can be seen that NOx increases with load and then decreases. At approximately an 80% load, the temperature is at its maximum and, consequently, NOx emissions are as well. At a low load, there is not enough fuel to promote high temperatures. However, at a high load, a rich combustion takes place, producing temperatures lower than the maximum reachable ones. SFOC also increases and then decreases with load because the power is at its maximum at high temperatures and pressures. As for CO and HC, they increase with load due to the incomplete combustion which occurs with rich mixtures.
Once it was validated, the numerical model was employed to study several internal modifications such as water addition, exhaust gas recirculation and modification of the overlap timing, intake valves closing and cooling water temperature. Results are shown below.
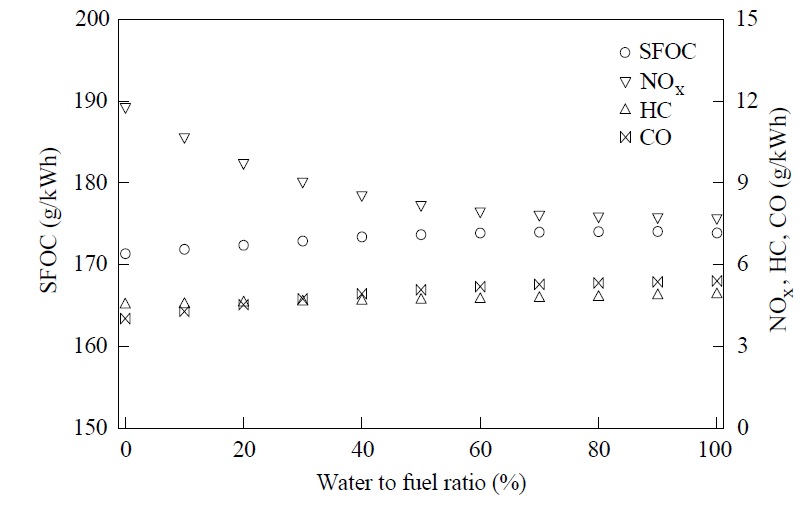
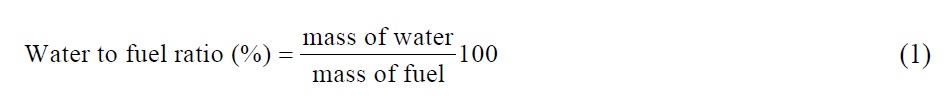
In practical applications, there are three possible ways to introduce water into the combustion chamber, introducing it into the charge air as humidity, through direct injection in the cylinder or through a water-fuel emulsion. In this work, water addition was simulated as an injection of a water-fuel emulsion. A water to fuel ratio, Eq. (1), between 0 to 100%, was analyzed. The results of NOx, HC, CO and SFOC against the air to fuel ratio are shown in Fig. 5. In order to be of greater relevance, the emissions are indicated in g/kWh instead ppm.
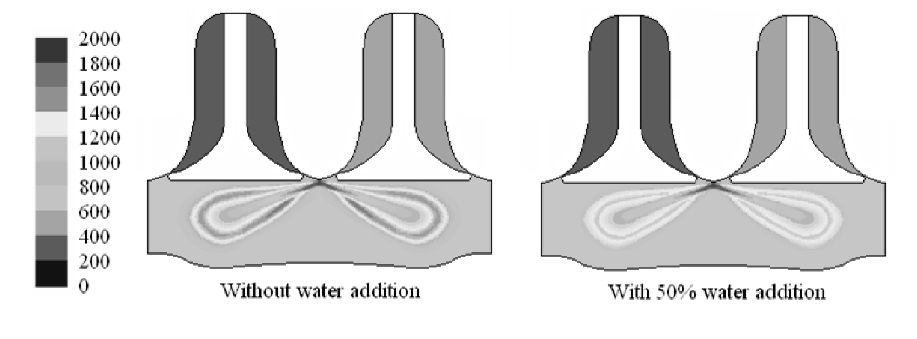
As can be seen in Fig. 5, water addition reduces NOx but increases CO, HC and SFOC. Water absorbs energy for evaporation, increases the specific heat capacity of the cylinder gases (H2O and CO2 have higher specific heat capacity than air), and reduces the overall oxygen concentration. This in turn leads to an increase in the number of moles in the gases that must be raised to combustion temperatures to make a given amount of oxygen react with fuel. Water also reduces the availability of oxygen for the NOx forming reactions. The increase in HC and CO is caused by the lower temperatures, which trigger slow combustion and partial burning. SFOC is also increased due to the lower peak pressure, which promotes lower power. The incylinder temperatures at a -5° crankshaft angle (5° before TDC) without water addition and with 50% water addition are indicated in Fig. 6. As can be seen, water addition notably reduces the combustion temperature.
>
Exhaust Gas Recirculation (EGR)
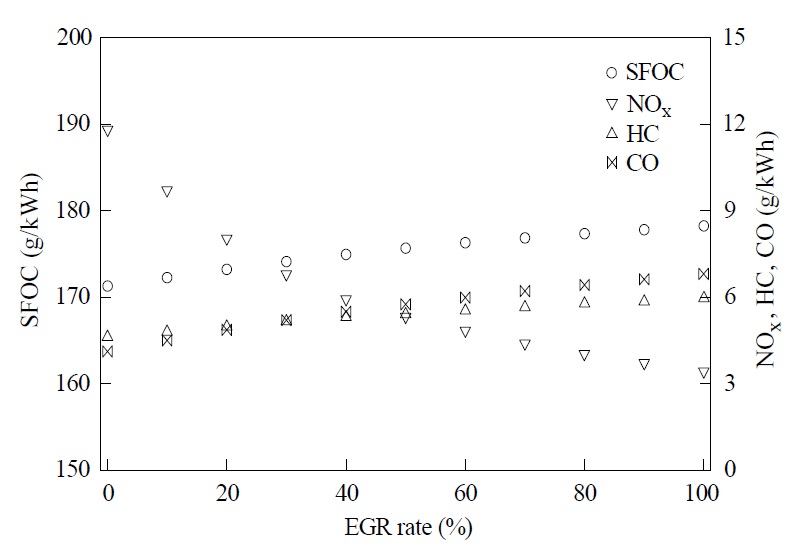
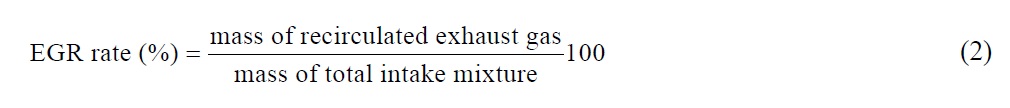
EGR involves mixing a portion of the exhaust gas into the intake air to constitute a mixture of air and inert gases with a lower local oxygen concentration. The results of NOx, HC, CO and SFOC against the EGR rate, Eq. (2), are shown in Fig. 7.
As can be seen in Fig. 7, EGR lowers NOx emissions but increases HC, CO and SFOC. Recirculated exhaust gasses displace the fresh air entering the combustion chamber. As a result of this air displacement, a lower amount of oxygen in the intake mixture is available for combustion. In other words, the air-fuel ratio is lowered. In addition, mixing exhaust gases with the intake air increases the specific heat of the intake mixture. This results in a lower flame temperature. For this reasons, NOx is highly reduced. As indicated, EGR is an effective method for NOx control. Nevertheless, practical applications do not usually use more than 50% of the EGR rate because particles from the exhaust gasses damage the engine, Lamas and Rodríguez (2012).
The increase in HC and CO with EGR is caused by lower temperatures and the reduced amount of oxygen available for reactions, which promote slow combustion and partial burning. SFOC is increased with EGR due to the lower peak pressure which supposes lower power.
Another NOx reduction method related to intake air involves using a correction factor, known as kHDIES, for humidity and temperature. This remains out of the scope of the present work.
>
Modification of the overlap timing
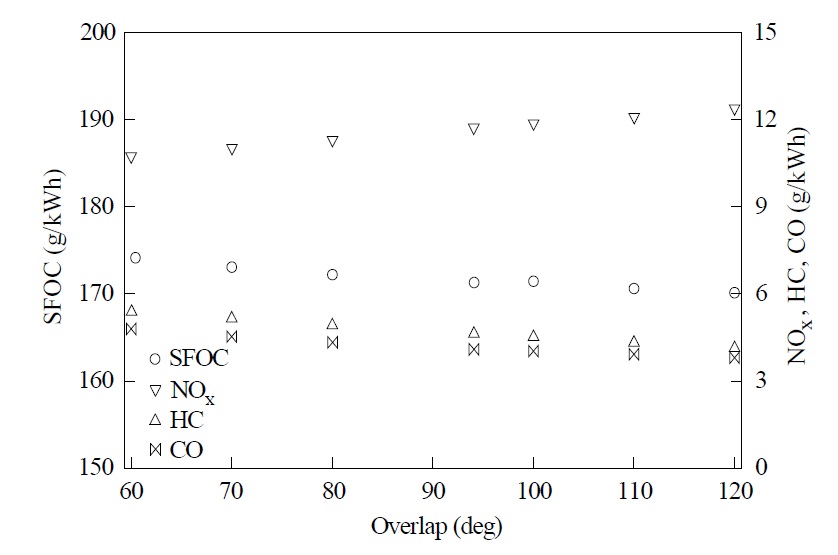
The CFD model was also employed to analyze different values for the overlap timing. The overlap timing is the interval of time in which the intake and exhaust valves are both open. The results are shown in Fig. 8. In this figure, the intake valves’ opening angle and the exhaust valves’ closing angle were increased and reduced by the same amount.
As can be seen in Fig. 8, NOx emissions increase with the overlap timing, while CO, HC and SFOC decrease. The overlap period mainly affects the scavenging of the combustion gases, Puskar and Bigos (2010). With short overlap timings, a high quantity of residual gas is retained in the cylinder. For this reason, NOx emissions are low during short overlap timings and increase as the overlap timing is raised. HC and CO decrease with the overlap duration. During short overlap timings, combustion is poor and incomplete due to the high quantity of residual gas. However, combustion improves as the overlap timing is extended. SFOC decreases with the overlap timing due to lower temperatures and pressures reached during longer overlap timings.
>
Modification of the intake valves closing
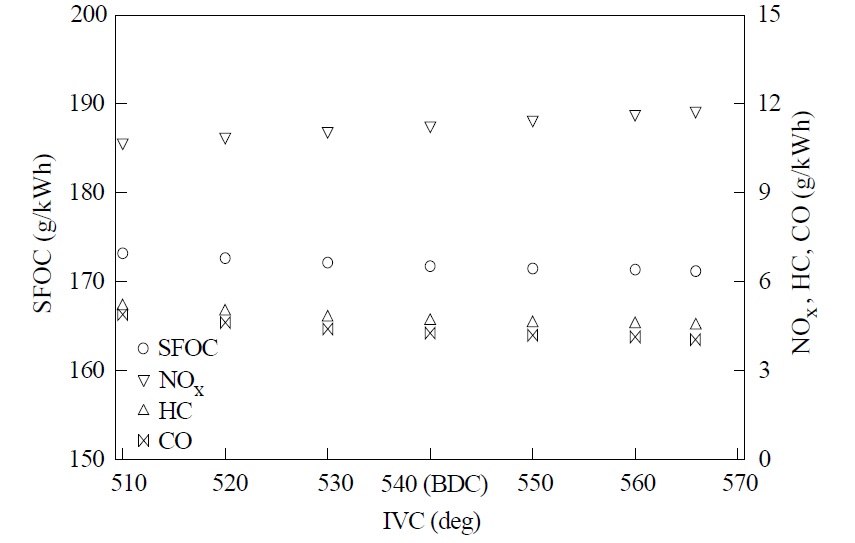
Another way to reduce NOx emissions is by advancing the intake valves closing. The results are shown in Fig. 9.
As can be seen in Fig. 9, NOx emissions increase as the intake valves closing is delayed. When the intake valves are closed earlier, more air is trapped in the cylinder. Consequently there are higher combustion temperatures associated with higher NOx emissions. Nevertheless, with a later intake valves closing, there is a lower quantity of air inside the cylinder. The consequence is a lower temperature and lower NOx emissions. Concerning HC and CO, they decrease as the intake valve closing is delayed due to the incomplete combustion associated with a higher quantity of exhaust gasses. In the case of BSFC, it decreases as intake valve closing is delayed due to higher pressures.
>
Modification of the cooling water temperature
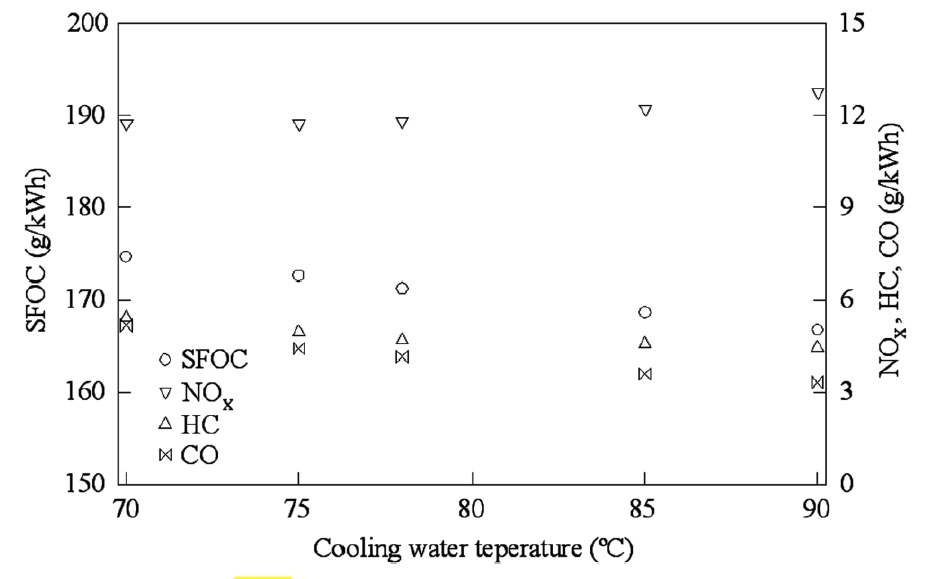
The last measure proposed to reduce NOx emissions entails reducing the cooling water temperature. In the numerical model, the cooling water temperature appears as a boundary condition at the cylinder wall. The heat transferred from the cylinder to the cooling water is given by the following expression:
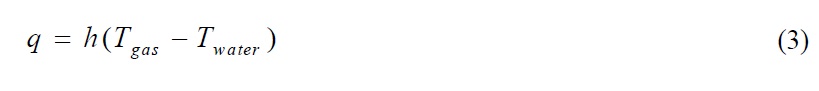
where
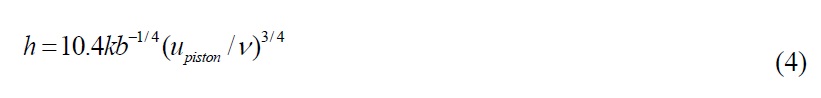
where
The results for different values for the cooling water temperature are shown in Fig. 10. As expected, NOx emissions increase as the cooling water is increased. Nevertheless, CO, HC and SFOC decrease with the cooling water temperature due to poor combustion.
In the present paper, a numerical model was employed to analyze the potential emission reduction capabilities of several internal engine modifications. The driving force of this study was legislation related to NOx emissions from marine engines. Also analyzed were consumption and CO and HC emissions. The NOx-reducing modifications studied here involved water addition, exhaust gas recirculation, modification of the overlap timing, modification of the intake valve closing and modification of the cooling water temperature. As its main contribution, this paper provides a cheap and fast tool for studying the effect of several NOx reduction measurements. On the other hand, experimental tests are too expensive and laborious for marine engines. A four-stroke marine engine, the Wärtsilä 6
The numerical model showed that a reduction in the combustion temperature notably reduces NOx but increases CO, HC and consumption. A NOx reduction of almost 100% with a fuel penalty of 4.6% was obtained using EGR. Water addition also lead to a significant NOx reduction with a fuel penalty of 1.7%. Nevertheless, in practical applications, the EGR rate poses limitations, as does the water to fuel ratio in terms of engine performance. The remaining modifications- related to modification of the overlap timing, intake valve closing and cooling water temperature- provided lower NOx reductions.