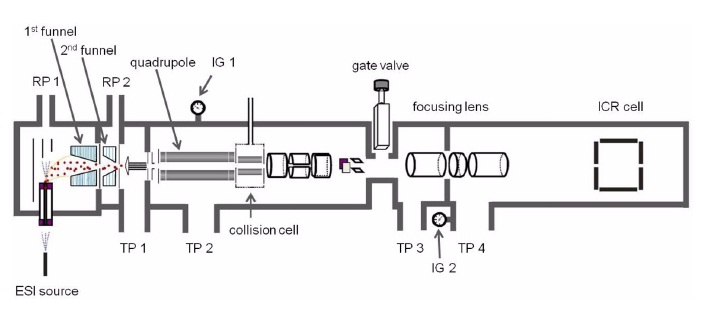
The novel ion funnel interface was implemented in 1997 to improve ion transmission at the first vacuum stage of atmospheric pressure ionization mass spectrometry (API-MS) with differential vacuum stages. 1 An improved design was introduced to resolve the m/z discrimination problem of the original ion funnel, which confirmed the usefulness of ion funnel-type ion guides in API-MS.2 The first ion funnel-type ion guide was implemented in commercial instruments by Bruker. They used a unique ion funnel-type ion guide, which is referred to as aquadrupolarion funnel in thisreport. Thequadrupolar ion funnel is composed of gradually decreasing quadrupolar ring stacks instead of the simple ring stack of the original ion funnel.3 The quadrupolar ion funnel-equipped ion sources have been implemented in Bruker’s ultrOTOF, quadrupole time of flight instruments, and Apex-Qe Fourier transform mass spectrometer (FTMS)4. We calculated ion trajectories to examine the functions of quadrupolar ion funnels installed in our 15 T Apex-Qe Fourier transform ion cyclotron resonance mass spectrometer (FT-ICR MS; Bruker, Billerica, MA). The 15 T FT-ICR MS had a dual ion funnel system driven by a single RF generator in the ion source region (Figure 1). The ion intensity profile as a function of the mass-to-charge ratio (m/z) was predicted from experimentally observed pre-amplifier gain profiles. However, it was difficult to plot the transmission shape of the funnels from the experimental mass spectra because the experimental mass profile was affected by funnel transmission efficiency, as well as the spatial distribution of the sample ions, the transmission of ions through the quadrupole ion filter, and the amplification efficiency profile by the signal frequency. In this study, we explored the ion guiding performance of the dual quadrupolar ion funnel system. The simulation was performed using ion trajectory calculation software, SIMION 8.1.5 The simulation results can be used to develop an FT-ICR MS dedicated to metabolomic research. The sensitivity was optimized for metabolite ions in the m/z range from 60 to 1,000. Ion transmission in the low m/z region was specifically optimized for the new FT-ICR MS because ion transmission in the m/z range from 60 to 200 was considered too low for our current FT-ICR MS. The dual quadrupolar ion funnel system used in this study is shown in the schematic drawing of the Apex-Qe FT-ICR MS (Figure 1).
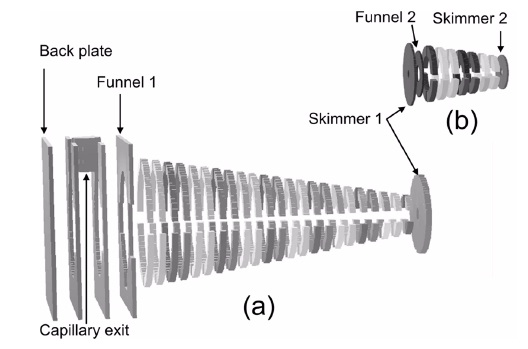
The first funnel was composed of electrodes with a back plate, 3 rings, and 23 4-divided rings that taper in inner diameter (i.d.) from 26 mm to 4 mm (Figure 2a). Each 4-divided electrode was 1.5 mm thick (same thickness as the spacer). An electrospray capillary was located between the ring electrode and behind the back plate to introduce analyte ions. The second funnel was composed ofseven 4-divided ring electrodes, which
were the same as the last seven electrodes of the first funnel section (Figure 2b). The first and second funnels were located at the same axis in the front and back of a conductance-limiting electrode (skimmer 1), which was 1.8 mm i.d. (Figure 2).
RF was applied to the 4-divided ring electrodes, and the phases of neighboring divisions were opposite at a frequency of 1.2 MHz. Each ring had a step down DC bias with the same RF amplitude. A DC voltage of 300 V was applied to the capillary exit, 260 V to the back plate, 200 V to the funnel 1, and 20 V to skimmer 1 to guide ions in the first ion funnel. Two DC voltages, 15 and 4 V, were applied to funnel 2 and skimmer 2, respectively, in the second funnel. Gradually decreasing DC biases were applied along the electrodes of the dual ion funnel system derived from applied biases and resistive dividers. Applied RF amplitude values were 50, 80, 100, 150, and 200 Vpp, and the ion transmission behavior was calculated for each RF amplitude value through m/z of 40~6,000. RF amplitude of over 200 Vpp should be avoided to prevent glow discharge in the first vacuum stage.
Transmission efficiencies of the singly charged 300 ions were simulated for every selected mass in the first funnel. The mass increasing steps were 20, 50, 100, and 500 for the mass regions of 40~500, 500~1,000, 1,000~2,000, and 2,000~6,000, respectively. Smaller mass increasing steps at lower mass regions were required to accurately plot the ion transmission
profile in the low mass region. The model ion source of simulation had unique orthogonal capillary inlet configur-ations, and it was difficult to implement realistic initial conditions for ions. Thus, we applied simplified initial ion conditions. It is known that the ion transmission efficiency of the conventional ion funnel is mostly determined by conditions of the exit region and not by the initial conditions.6 In agreement with this, we found that the ion transmission efficiency is determined in the exit region of the quadrupolar ion funnel. We believe that simulations with simplified initial conditions could be used to increase our understanding of ion transmission. The time of birth of the ions was uniformly distributed from 0 to 1.66667 µsec, which corresponded to approximately two cycles of 1.2 MHz RF. The birth position of the ions was the inlet capillary exit. Ions showed a Gaussian speed distribution with a mean value of 0.4 mm/µsec and 45o angular distributions centered on the inlet capillary axis.
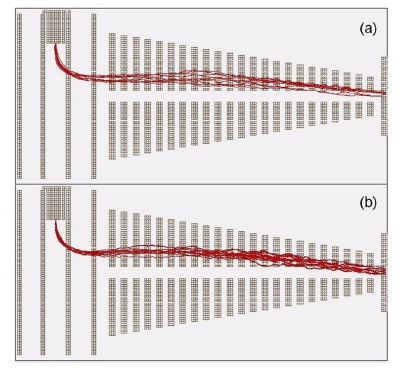
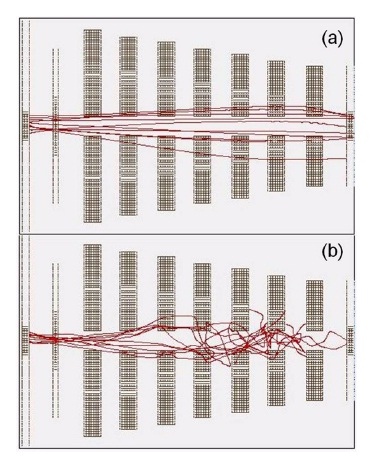
Figure 3 shows the trajectories of m/z 3,000 ions (a) and 120 ions (b) at RF 150 Vpp in the first funnel region. Using 1,000 singly charged ions with the same selected mass in the first funnel, ion trajectories were calculated for the second funnel, and the total transmission efficiency of the dual ion funnel system was calculated based on the results of simulations from each funnel. The initial conditions of ion trajectory simulations in the second funnel were generated based on the final conditions of the transmitted ions in the first funnel simulation. Hundreds of collisions within every 1 mm of movement resulted in the ions having similar speeds. Therefore, trajectories were similar even for ions of different masses in the first funnel region (Figure 3). The collision frequency was reduced by over 100-fold in the second funnel. Additionally, the ion trajectories differed significantly between 3,000 amu and 120 amu in the second funnel due to the low frequency of the collision compared to the first funnel (Figure 4).
The hard-sphere (HS1) model included in SIMION 85 was applied to consider background gas pressure in this
study. Pressures of 3 mbar and 10−2 mbar were applied to the first and second funnel, respectively.
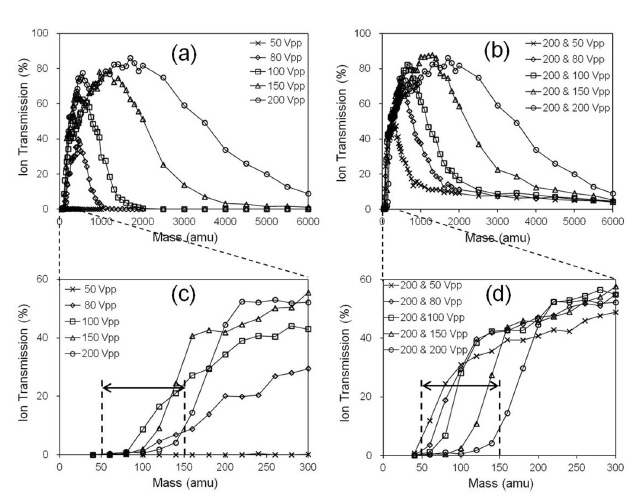
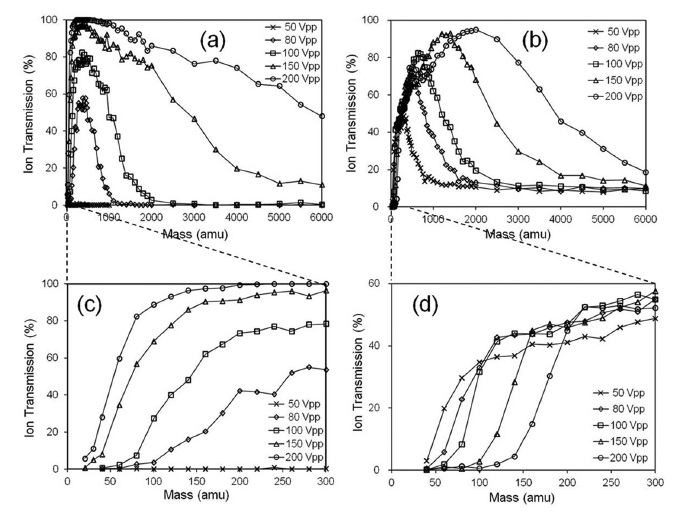
Ion transmittance depends on ion masses at specific RF amplitudes, and the transmission profiles depend on the RF amplitude applied to the funnels. In each funnel region, there was both a low mass limit and high mass limit for ion transmission efficiencies (Figure 5) due to ion stability in the pseudo-potential produced by the RF electric field. Compared to the first funnel region (Figure 5a), the second funnel region showed narrower transmission bands in the m/z range from 40 to 6,000 (Figure 5b).
The transmission efficiencies of high mass ions depend on the driving conditions of both funnels, and higher RF voltage shifts the limit to the higher m/z range. The order of transmission efficiency increased as a function of ion mass in the low mass limits and showed opposite results between the first funnel and second funnel regions (Figure 5c, 5d). At the first funnel region, higher RF amplitude reduced the low mass limit (Figure 5c). On the contrary, lower RF amplitude reduced the low mass limit at the second funnel region (Figure5d).These differences aredue to different pressures in the regions. For the current dual funnel system (Bruker), one RF generator was used to supply RF voltage to both funnels. Figure 6 displaysthe simulation results of the total ion transmission efficiency through the dual funnel system at given RF amplitudes. Based on these results, higher RF voltage results in wider transmission bands. However, the transmission bands at200Vpp and 80Vpp are narrower thanthe transmission bands at 100Vpp and 150Vpp in the expanded plot of Figure 6a (Figure 6c). This is due to different transmission efficiencies between the first and second funnel. The simulation
results and experimental ion transmission dependency to RF voltage as the tuning parameters in the current instrument (Apex-QE, Bruker) showed very good agreement. Based on our experiments, high RF amplitude is required to obtain a spectral range of high m/z mass, and adjustment of the RF amplitude to below 150 Vpp is required to observe low mass samples. We next fixed the RF voltage for the first funnel at 200 Vpp as an optimal value and determined the transmission by changing the RF amplitude of the second funnel (Figure 6b). These results demonstrate a simple method to increase transmission efficiency for the low m/z region. The m/z region from50 to 150, which has very low transmission efficiencies using the current ion funnel system, is important for research in metabolomics, the environment, and natural substances.
Transmittance of ions through an ion funnel at a given background pressure depends on their mass at specific RF amplitudes. The transmission profiles depend on the RF amplitude applied to the funnel and the background pressure.
The simulation results show that for ion funnel 1, the transmission efficiency increased as RF amplitude increased for all ions with m/z from 40 to 6,000. On the other hand, for ion funnel 2, the transmission windows shifted from a low mass region to high mass region, and the ion transmission efficiency of ions in the m/z range from 40 to 200 decreased as RF amplitude increased. The reduced transmission efficiency at increased RF amplitudes could be explained by ion instability in an RF ion guide. On the other hand, the instability of low m/z ions in funnel 1 was not observed, which could be explained by an expanded stability region through a collisional damping effect.7
By operating the two ion funnels at different RF amplitudes (for example, ion funnel 1 at RF amplitude 200 V and ion funnel 2 at RF amplitude 50 V), the ion transmission for the m/ z range from 50 to 150 could be significantly improved. We are applying the modified control system of the dual ion funnel system to our instrument to obtain increased transmittance in the low mass region of 50~1,000 amu. The new operational conditions would be very useful for instruments with similar ion guide systems that require high transmission efficiency for low m/z ranges, such as metabolomics studies.