

The speed of technological and market changes are increasingly accelerating in response to the rapid progress in globalization and the openingfby business type, business of markets, and accordingly there has been an increase in the uncertainties and risks involved in technological development. All countries and companies are now required to build close partnerships and to select and focus on key strategic areas of technology in order to ensure the efficient utilization of facilitate responses to these urgent changes in the market environment. Since the enactment and implementation of the
However, for small and medium enterprises (SMEs), there are challenges to applying the technology roadmaps designed at the national scale to the technology development plans of individual companies. This is because technology maps at the national level cannot fully encompass the detailed contents of technological development pursued at the level of SMEs. Moreover, since SMEs have only limited research resources, it is not easy for such companies to develop such technological roadmaps on their own in the planning stage prior to R&D. It is difficult to forecast how technology will progress in the future and the efforts of smaller companies to develop specific technology development strategies and implementation plans are also impeded by their limited access to information, their lack of professional staff and the restrictions of cost. To resolve this problem and to support SMEs in their efforts to establish technology development strategies, Korea's Small and Medium Business Administration has been operating a program providing support for the development of technology roadmaps by individual SMEs since 2008. Korea Institute of Science and Technology Information conducted a feasibility analysis for the implementation of the program in 2007 and the 1st session of the program was implemented in 2008. As of 2012, the 5th session of the program is currently in progress. Meanwhile, in the private sector, institutions such as large corporations and associations are also pursuing various technology mapping programs. There have been programs executed to develop a variety of technology roadmaps, representative examples of which include a technology roadmap for a Korean model of semi-conductors (Samsung Electronics), the U.S.-Korea flat display roadmap (Electronic Display Industrial Research Association of Korea), and the electronic commerce integration roadmap (Electronic Commerce Integrated Forum).
As a tool for technology planning, such technology roadmaps have been evaluated to be highly useful, with the advantages of offering a focus on future demand, mid-term and long-term perspectives, and milestones for stage-bystage technology development. However, though many companies have indicated the need for performance evaluation and the identification of key success factors (KSF) for utilizing technology roadmaps, relevant research does not yet exist in this field. In Korea, the Small and Medium Business Administration has implemented the "Support Program for the Individual Company Technology Roadmaps" to promote the establishment of technology development strategies by SMEs, but there remains an urgent need to enhance the efficiency of technology planning given the limited resources available to SMEs.
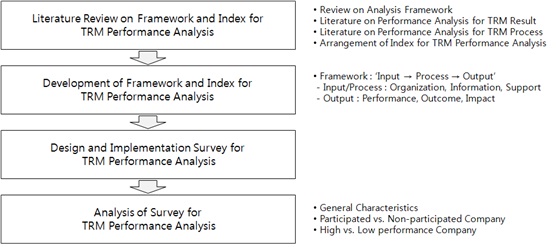
In response, this study developed the framework and indices for performance analysis, also designed and implemented survey for TRM performance analysis based on a literature review. This study compared the supported companies (with responses from 97 companies) and the companies that were not supported (with responses from 102 companies that failed to be selected) to analyze the effects of received support and also analyzed quantitative/qualitative performance and satisfaction levels among the supported companies to compare low-performance companies and highperformance companies. This study aims to examine the key success factors of technology road mapping in terms of input and process.
II. Introduction of TRM Support Program
The "Support Program for Individual Company Technology Roadmaps" is a program targeting technologically innovative SMEs, with the goal of supporting the development of technology roadmaps that can be used for R&D planning to pioneer new future markets. This forms a contrast to conventional technology roadmaps that were mainly utilized at the national or industry level or by large corporations, since the program aims to target SMEs to promote the efficient use of R&D resources by them and to enhance their success rate in technology development and commercialization by improving SME’s planning abilities.
In other words, this program seeks to identify technology development projects that can be pursued by SMEs in the planning stage prior to R&D and to support the derivation of future-oriented technology development projects that will enable Korea's SMEs, which are currently placed in a nut cracker situation in the international market, to leap forward to a new level of qualitative enhancement.
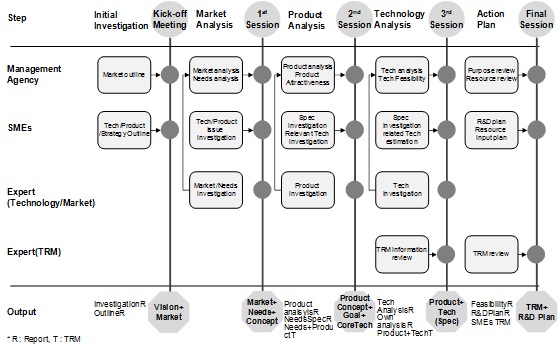
Individual SMEs in promoting new R&D projects can apply to "Support Program for Individual Company Technology Roadmaps" and be supported through preliminary evaluation, deliberation and consultation. This program puts the technology roadmap planning team who are professionals in the corresponding sectors of the technology/market to participate with the R&D director of selected company. The team support customized R&D planning (technology/product/market roadmapping) through several stages including user needs analysis, product analysis, deriving elements technology and so on. The Road-mapping team diagnoses R&D resources and capability of company then select appropriate specific R&D projects by priority. On the selected R&D projects for an SME, the team makes out market-product roadmap, product-technology roadmap, R&D portfolio and the R&D planning report. The technology roadmapping process proceeds with market-product roadmapping: analysis on domestic and international market trends for projects ushering a promising new concept by combining existing product characteristics and product-technology roadmapping: analysis on technology paradigm shifts on projects and identification of technology development direction by combining characteristics of company and product 3) total roadmapping : establishment of company's R&D portfolio and strategy by combining above two roadmaps 4) R&D Planning : making a R&D planning and delivering established roadmaps to SME.
III. Research Contents and Methodology
This study aims to develop a framework and indices for analyzing technology roadmap performance and to analyze roadmap performance by designing and implementing surveys for the program between 2008~2011. At first, to conduct the analysis of technology roadmap performance, we developed a framework and indices based on a literature review in terms of the outcomes of technology roadmap and the process of technology roadmapping. Secondly, to analyze the performance of the "Support Program for Individual Company Technology Roadmaps", we evaluated and compared the TRM performance of companies that participated in this program to the conditions in companies that were not supported by the program, in the purpose to assess whether this program indeed made positive contributions to the participating companies. Finally, we distinguished between high-performance companies and low-performance companies and compared their respective characteristics to determine the key success factors.
For the survey research, two types of survey forms were developed respectively for the experimental group and the control group, and the survey was conducted targeting the companies that participated in the above program (146 companies). In this survey, the experimental group consisted of companies that applied and were selected as participants, who numbered 30 companies in 2008, 49 companies in 2009, 37 companies in 2010 and 30 companies in 2011. There were 146 companies with a final total of 143 companies after excluding 3 companies that were repeating applicants in the survey group while 102 companies that applied but failed to be selected for the program were set as the control group. Valid data were obtained from 83 companies in the experimental group and 101 companies in the control group and utilized in the analysis.
1. TRM Concept and Characteristics
Development of technology roadmap (TRM) is a type of technology planning process based on market needs, which identifies the technological alternatives required to fulfill the demands of the market or a product and assists in the process of selection and development. Such roadmaps also indicate the performance objectives that will be demanded in the future and express the research and development activities or technological alternatives that will be needed to achieve these objectives in the form of a time line (Garcia and Bray, 1997).
Generally, technology roadmapping proceeds from the stage of objectively reviewing the prospects of technological development and the stage of building upon this knowledge to select the technology to be targeted for development. The former is referred to as a technology map, which can be considered as a form of forecasting regarding future technological development. By distinction, the latter can be regarded as the process of technology selection. The basic components of a technology roadmap include 1) a chart that includes a temporal concept, 2) multiple levels, 3) a perspective on market conditions and technology, and 4) evolution and forecasting over the course of time (Phaal et al., 2001).
Technology roadmapping is a demand-oriented technology planning process which is differentiated from technology-oriented planning activities. Such roadmaps take into consideration the commercial viability of the technology to be developed from the initial stages of the planning process, which leads to a higher rate of utilization and success for the developed technology. Also, these roadmaps establish clear R&D objectives based on market needs and indicate the gap between future market conditions and the currently available technological alternatives, thereby contributing to the acceleration of technology development by stimulating competition among the agents of technology development.
The process of creating a technology roadmap involves negotiating a consensus based on objective data, constituting an open form of technology development which enables participants to select the most effective alternatives and search for available methods of technological development in their surroundings. Roadmapping is perceived to be a method of technology planning well adapted to the process of adjusting the direction and objectives of technology development through continual revisions and improvements, thus reducing the risk of failure and raising the probability of success.
2. Development of Framework and Indices
We required an analytical framework to perform an analysis of performance using technology roadmaps (TRM). Since the technique of technology roadmapping is a form of technology forecasting as the above backgrounds, we sought to use the analytical framework for technology forecasting performance. Also, to investigate the key success factors (KSF) for setting indices that affect the process of utilizing the result of developed TRM in the planning of actual research projects, we conducted literature reviews on the evaluation of outcomes yielded by TRM, with a focus on the quality of developed TRM and the actual utilization of these prepared TRM. To find the effects that the process of preparing a TRM has on technology planning, we reviewed literature related to evaluating the technology roadmapping process, from the perspective of evaluating and enhancing the process and assessing the anticipated effects of the TRM process.
2.1 Literature on Overall Framework
Li et al. (2009) developed the evaluation framework for technology forecasting program in terms of process evaluation and outcome evaluation. They considered efficiency, appropriateness, relevance and effectiveness of forecasting process and suggested eight factors for framework as follows: overall policy goals, inputs, strategic objectives, foresight activities, outputs, effects, outcomes and impact. Georghiou et al. (2005) investigated evolution of main evaluation index using generational models for evaluation strategies of foresight activities under variety of conditions at the national level. Such foresight required evaluation and improvements are necessary in terms of responsibility, validity and learning which leads on large investment of resources and time. There is fewer preceding research on performance of TRM directly, it is divided into evaluation of output and evaluation of process as framework for performance evaluation.
2.2 Literature on Performance Analysis of TRM Output
Though the performance of output could be evaluated from various perspectives, advanced research mainly evaluated in terms of quality and actual use of TRM. In terms of quality of TRM, KSF are suggested for developing 'high-quality TRM'. Meanwhile, in terms of utilizing of TRM, KSF are listed in the process of using developed TRM for research project planning after finish of development of TRM (Kostoff and Schaller, 2001; Lee, 2008a; Lee, 2008b; Lee et al., 2011; Whang, 2008).
Lee (2008a) considered support from management executives, appropriateness of main technology deduction and deployment of TRM and enhancement of relationship between departments. Lee (2008b) defined utilization of TRM as innovation process of actual utilization of TRM to R&D project after development of TRM. Whang (2008) surveyed and identified KSF for success of TRM and failure factors as follows. 1) KSF: business needs, consideration and involvement of executive managements, proper people and their roles, organization culture and politics promote participation and progress, timing, TRM process, effective tools / methods / techniques, promotion and education and availability of necessary data / information / knowledge 2) failure factors: lack of all KSF. Lee et al. (2011) suggested four indices that are the organizational support, effective roadmap process, suitable software system and goal of company in an empirical study for evaluating utilization of TRM at the corporate level and two perspectives consisted of inner business and innovation and learning for measuring R&D performance. Kostoff and Schaller (2001) provided ten requirements for developing highquality technology roadmap : support from executive manager, roadmapping mana-ger's motivation for developing TRM, professionalism and objectivity of professional, a sense of purpose of TRM and participating for TRM, using standardized form for TRM, applying defined evaluation criteria to developing TRM, reliability of repetition of roadmapping, actual realization to action-plan of TRM, sufficient investment of professionals, using worldwide information
2.3 Literature on Performance Analysis of TRM Process
Advanced researches on performance analysis of TRM are mainly focused on an evaluation and improvements in terms of process progress and in terms of expectations of TRM process(Brown and O'Hare, 2001; Kappel, 2001; McCarthy, 2003; Petrick and Echols, 2004; Phaal et al., 2003a; Phaal et al., 2003b; Rinne, 2004). As regards evaluation and improvements for process progress, contents and pros and cons of process for developing various TRM are suggested. Meanwhile, effects to technology planning from TRM process are provided in regards to the expectations of process.
Petrick and Echols (2004) identified that KSFs for TRM process are information sharing with participants, reducement of uncertainty and effect on decisions for prototype development in terms of expected effect. Rinne (2004) also identified state-of-art of technology and representation of information, utilization as a communication tool, tools for planning and coordination, technology forecasting and technology selection in terms of expected effect. Phaal et al. (2003a) suggested probability of unification of new technology to business, utilization for strategy or planning process, identifying new business opportunity with technology, providing refined information of technology that powers to business, communication and cooperation, deduction of market and technology knowledge gap, sourcing decision, resource allocation, risk management, decision of using technology and providing references and framework for continuous strategy planning in terms of expected effect of TRM. Phaal et al. (2003b) also proposed using and updating TRM continuously and combining top-down and bottom-up process for increasing utilization of TRM. Brown and O'Hare (2001) considered mainly that including professionals have multilateral major, holding a viewpoint on technology, product and market, keeping and managing a TRM sustainably. They also pointed out that providing co-understanding, using a communication tool, availability for prioritizing, unification of information from various sources and using a tool for integration of professional's knowledge. Kappel (2001) separated useful and unsuitable cases and analyzed both case in terms of stages, technology role, focus, possibility of foresight, sustainable, complex of issue and structure.
2.4 Framework for TRM Performance Analysis
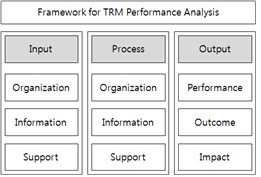
We suggest a framework for TRM performance analysis based on literature review in terms of flows of development and utilization of TRM by categorized as 'Input-Process-Output'.
With regards to 'Input' and 'Process' categories, we suggest classification of which 'organization, information and support' in terms of resource and operational concept for successful development of TRM. As regards 'Output' category, we suggest classification of which 'performance, outcome, and impact' in terms of result of TRM and using TRM.
2.5 Index of an Analysis Framework for TRM Performance
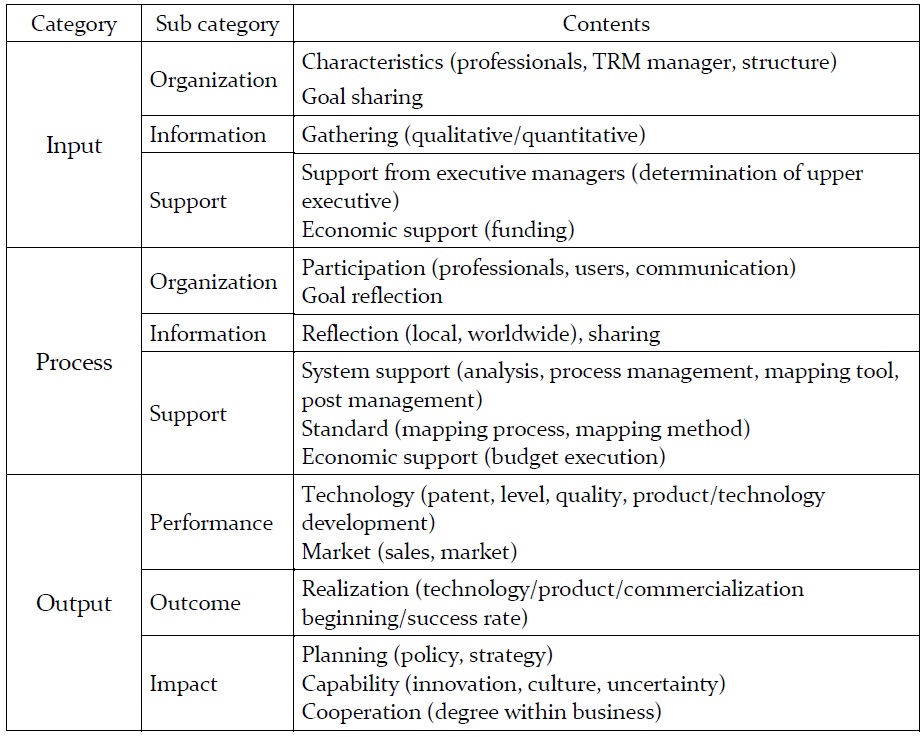
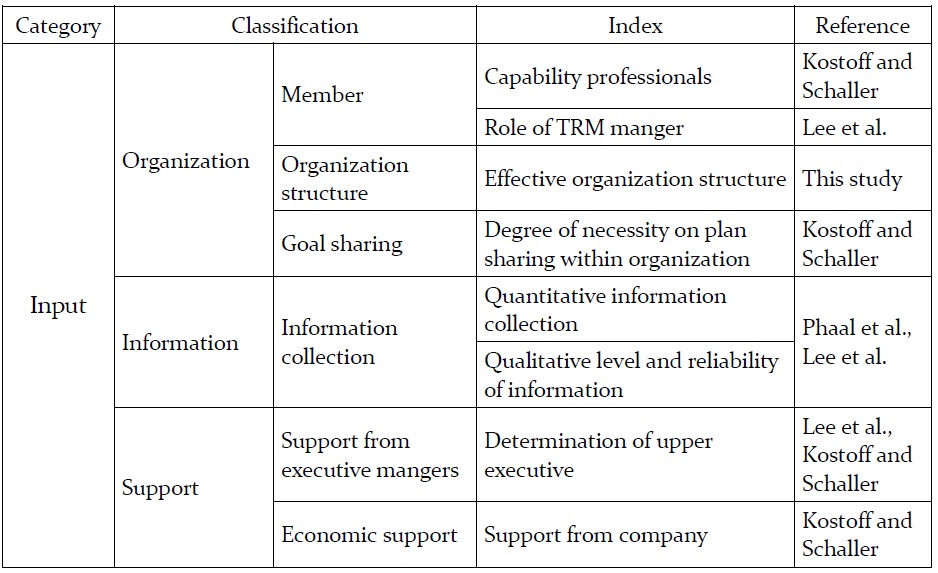
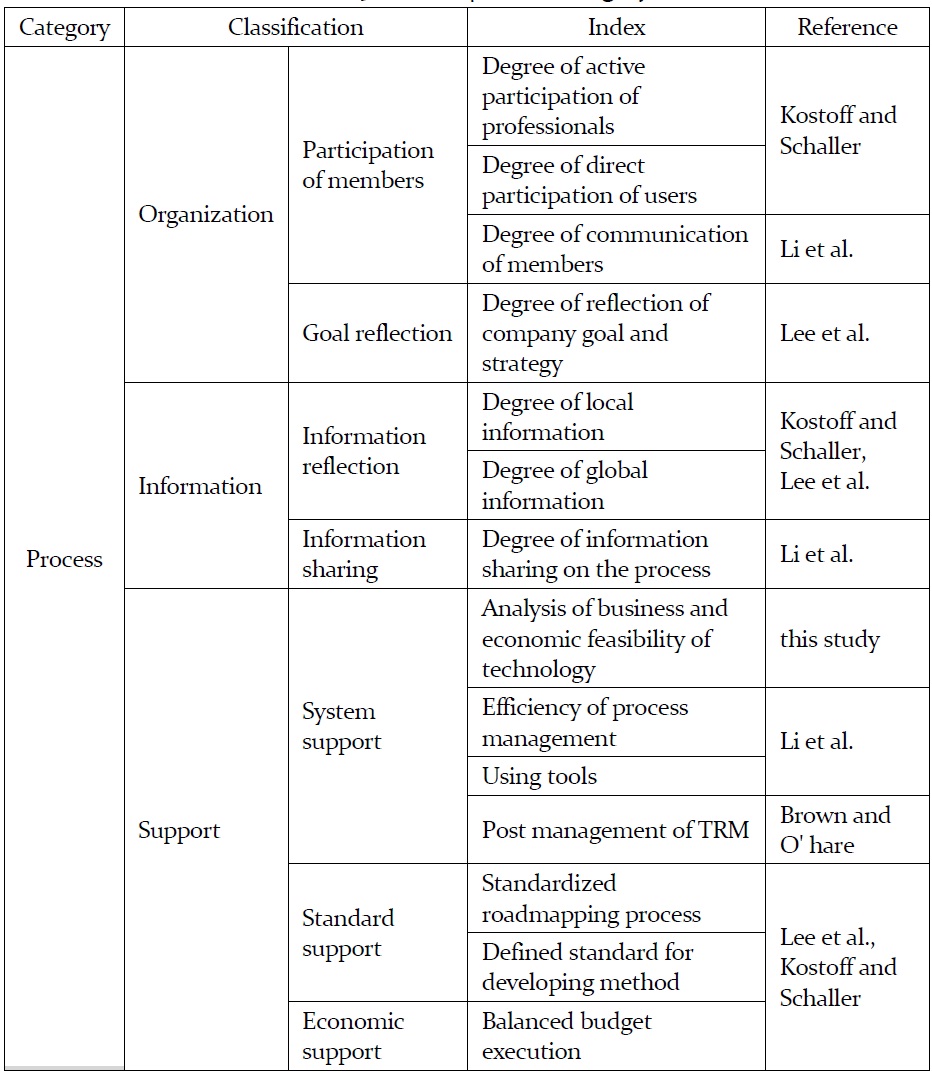
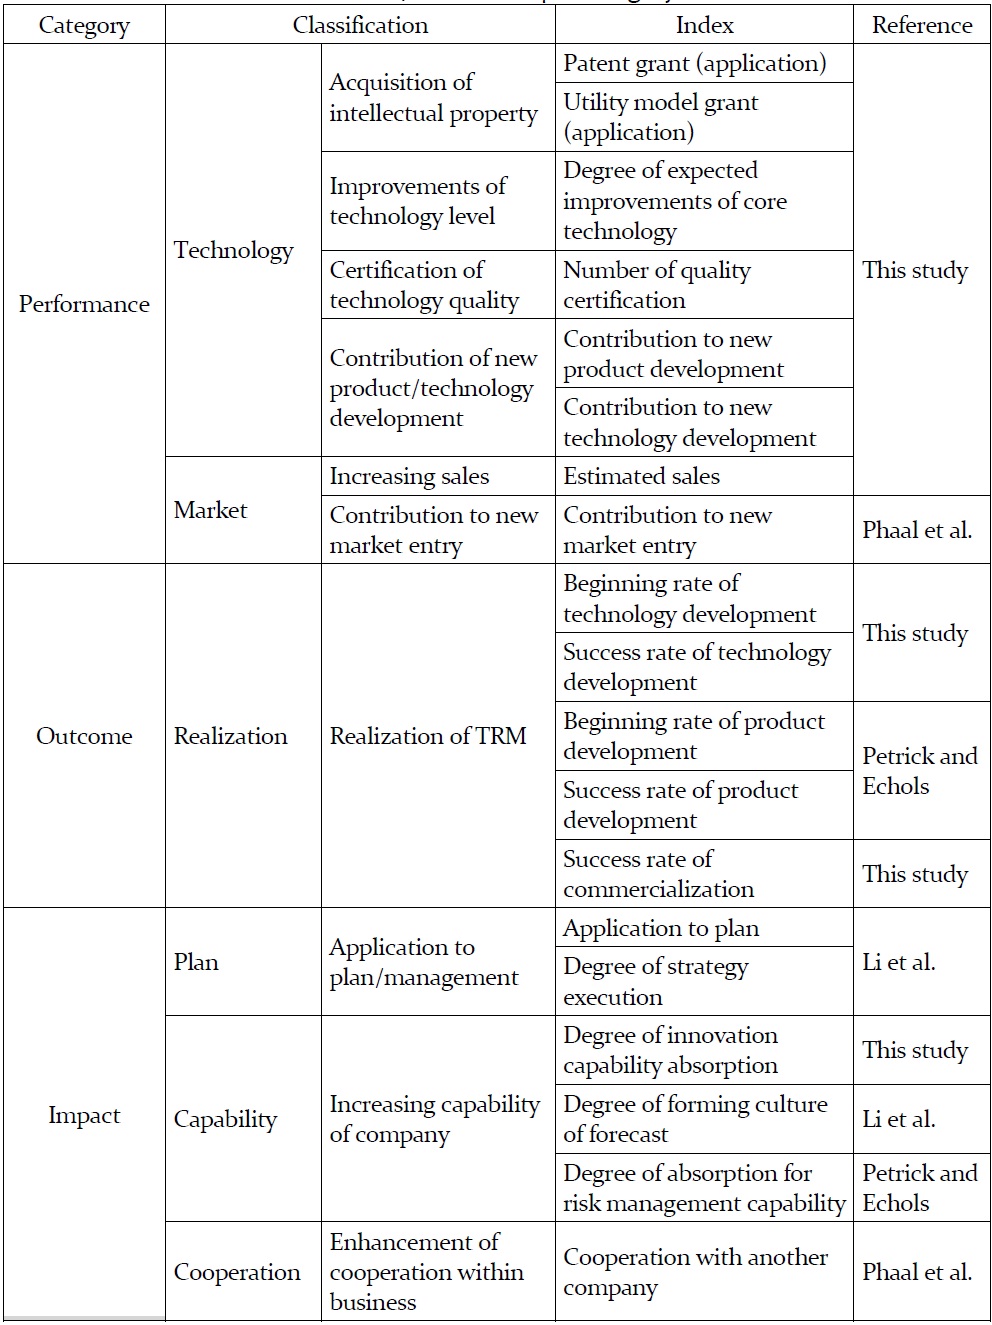
We arranged indices for TRM performance analysis in terms of input, process and output based on the literature review. Conceptually the 'Input' category is related to relevance and appropriateness of resources for TRM. The 'Process' category is in relation to efficiency of TRM process. The 'Output' category is in respect of effectiveness and behavioral additionality of TRM result.
[Table 1] Analytical framework
Analytical framework
[Table 2] Index of input category
Index of input category
[Table 3] Index of process category
Index of process category
[Table 4] Index of output category
Index of output category
V. Design and Implementation for Survey
To analyze the performance of "Support Program for the Individual Company Technology Roadmaps", we designed a survey form for investigating output, key success factors (KSF), satisfaction levels, items requiring enhancement, and basic statistical information.
In regards to output, the survey sought to examine the output obtained from the program (indices were used in the output factors). As regards KSF, the survey was designed to investigate the perception of SMEs regarding the success factors that are important when development of a TRM (indices were used in the input and process factors). The levels of satisfaction experienced by companies regarding the program were classified in terms of input, process and output and the survey attempted to indicate the degree of satisfaction regarding the program itself. In addition, the survey investigated aspects requiring improvement, and identified various items of information regarding the companies (basic information and statistical data regarding the surveyed companies).
1.1 Output Factors
Output factors are classified in terms of 'performance, outcome and impact' as analysis framework for TRM performance in this study. In the output category, there are factors of 'the number of acquired intellectual property (patent grant/application, utility grant/application)', 'the degree of contribution of new product/technology (degree of expected improvements of core technology, number of quality certification, contribution to new product development, contribution to new technology development), and 'the degree of contribution to market (sales increasing, contribution to new market entry). In the outcome category consists of 'the beginning rate of technology development', 'the success rate of technology development', 'the beginning rate of product development', 'the success rate of product development', and 'the success rate of commercialization'. As regards impact factors, there are 'the degree of application to plan/management', 'the degree of increasing capability of company', and 'the enhancement of cooperation within business'.
1.2 Key Success Factors
We classified KSF into input factors and process factors as analysis framework for TRM performance we develop. The input factors consist of 'the capabilities and the organization of the roadmap team', 'the role of roadmap manager', 'the qualitative/quantitative level of information', and 'the economic support and the determination of the management executives'. The process factors consist of 'the degree of participation and communication of members', 'the degree of utilization/sharing of information', 'the efficiency of roadmapping process management (using a tool or system, periodically update), and 'using standardized process and method for TRM'.
1.3 Degree of Satisfaction
The factors of degree of satisfaction divided into input, process, output in analysis framework developed in this study and support program categories. The input factors consists of 'the capabilities and the organization of the roadmap team', 'the role of roadmap manager', 'the qualitative/quantitative level of information', and 'the economic support and the determination of the management executives'. The process factors are consisted of 'degree of participation and communication of members', 'degree of utilization/ sharing of information', 'efficiency of roadmapping process management (using a tool or system, periodically update), and 'using standardized process and method for TRM'. Output factors are classified in terms of performance, outcome and impact. With regards to support program itself, 'easiness of access', 'degree of communication', 'degree of reflection of request', 'speed of support process', 'overall satisfaction level', and 'willingness to participate again' is surveyed.
1.4 Improvement Items
We surveyed that 'additional area for focused analysis', 'time for development of TRM', 'support items for next stage', 'improvement for selecting company' and 'contribution area of support program' for identifying improvement items.
1.5 Company Information
We collected information about company for statistical analysis as name, address, establishment year, full-time employee number, company type and technology field. Also business model (target market, core customer, main product, competitive strategy, revenue, and etc.) and holding core technology (original technology, converged technology, production technology and engineering technology) are surveyed.
2.1 Companies Included in the Survey and Survey Method
The experimental group was defined as all of the companies selected as participants supported by technology roadmap program since 2008 (total of 147 companies). This target group included 30 companies from 2008, 49 companies from 2009, 37 companies from 2010, and 31 companies from 2011. The control group was selected from among applicant companies that were not selected for technology roadmap support in the years of 2008, 2009, 2010 and 2011. For this control group, the same number of companies was selected for each year and the selected companies were similar to those of the experimental group in terms of the companies’ size, average sales, and business models. The survey was conducted on-line by a commissioned survey research institution (Embrain), and participants were contacted by phone to encourage their participation.
2.2 Survey Results
Embrain, a professional survey institution, performed the Type I (experimental group) survey and the Type II (control group) survey. The Type I survey targeted a total of 146 companies that were supported by the technology roadmap program in the years 2008 through 2011, while the Type II survey targeted 1,633 respondents who had not been selected to receive program support. These surveys were conducted by e-mail. In the case of the Type II survey, since the sample pool of 1,633 respondents included both working-level staff and management executives, it can be deduced that the actual number of companies was significantly smaller. The actual survey began on Tuesday, March 27th 2012, and total of three-mails were sent every two days, to request the participation in the survey. In the case of the Type I survey, continued requests for responses were sent to companies that failed to respond and the survey was completed on Friday, June 15th, 2012. Meanwhile, the Type 2 survey was ended once around one hundred survey response forms were collected, which was similar to the number of responses targeted for the Type 1 survey.
[Table 5] Survey response rate and number of valid samples

Survey response rate and number of valid samples
2.3 Method of Survey Analysis
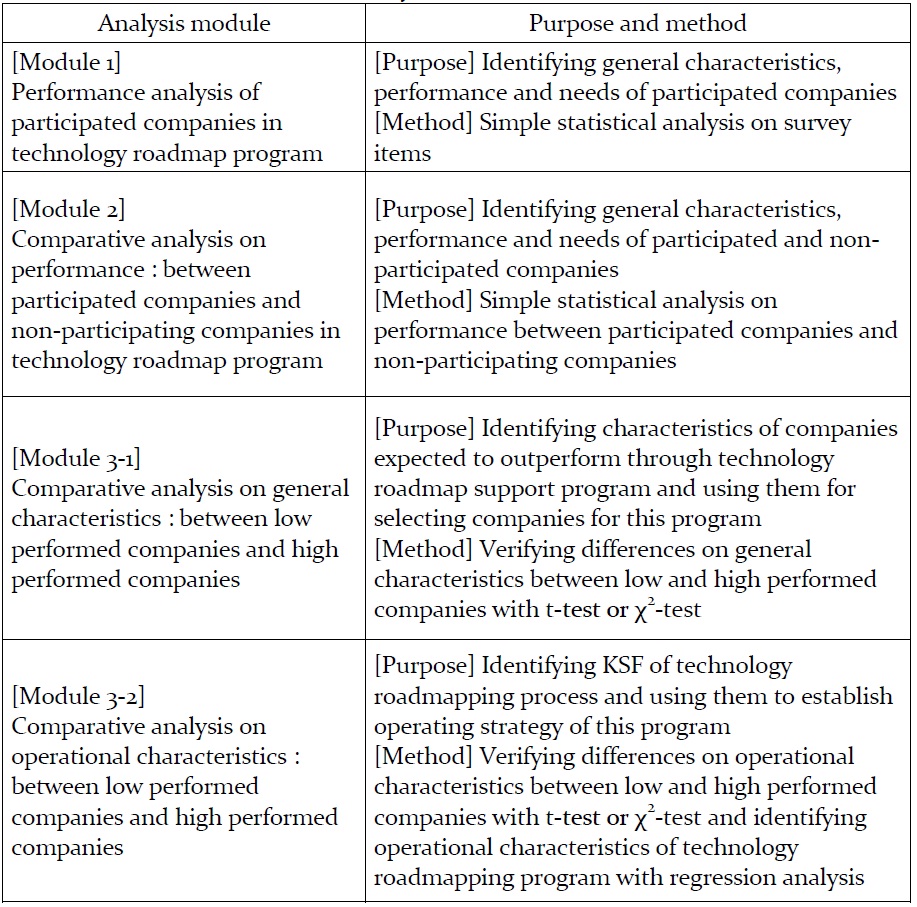
Based on a study of the frequency for each item in the responses from supported companies, the survey enabled us to derive the key success factors, analyze the support program’s outcomes, analyze the satisfaction levels regarding the support program, and identify important areas requiring improvement. This study also analyzed the correlation between key success factors and performance as well as the correlation between company information (pertaining to the type of business and type of technology, etc.) and performance and between satisfaction and performance and performed a gap analysis between the importance of key success factors and satisfaction levels. The analysis also determined whether there were differences in performance between the supported companies and the unsupported companies.
[Table 6] Analysis module and method
Analysis module and method
VI. Analysis of the Performance
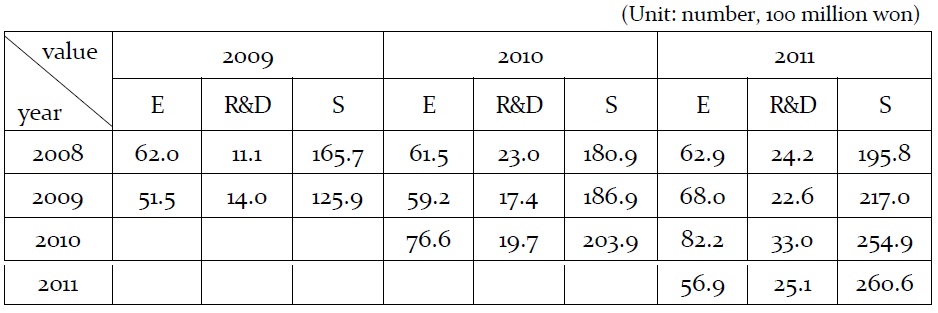
The companies that participated in the support program for technology roadmaps (based on valid data from a total of 83 companies) were SMEs with on average around 60 employees and 20 researchers employed in R&D and average annual sales of around 10 billion ~ 20 billion won.
The majority of the participating companies generated profit through sales of (92.8% of respondents) differentiated (61.4% of respondents) finished products (55.4% of respondents) through B2B channels (86.7% of respondents) in specialized domestic markets (45.8% of respondents), and responded that their core technologies consisted of original technology (54.2% of respondents) and convergence technology (22.9% of respondents).
[Table 7] Average employees, R&D researchers and sales
Average employees, R&D researchers and sales
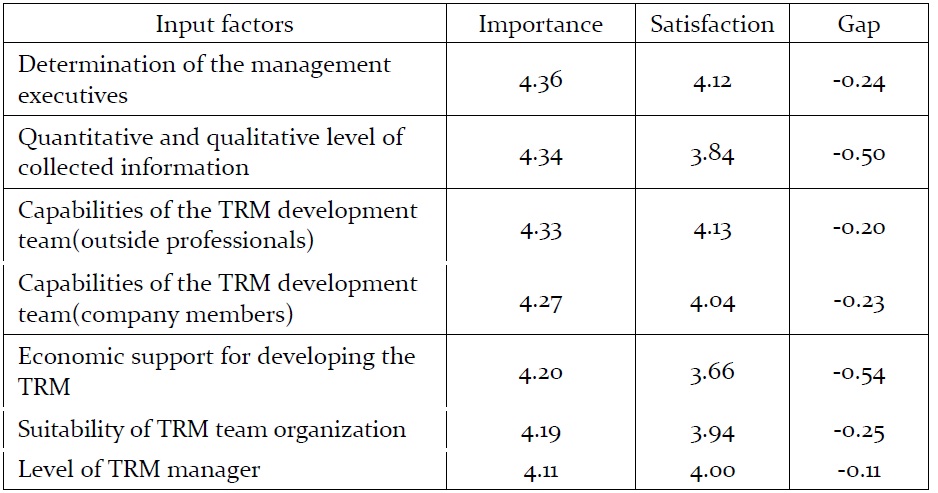
The respondents identified the key success factors (KSF) for the SMEs' TRM to be 'the capabilities of the roadmap development team,' 'the determination of the management executives' and 'the level of collected information' and in particular, regarded 'regular updates of the roadmap' and 'the degree of information sharing/utilization' to be important factors in the process of roadmapping.
Overall, the level of satisfaction regarding input factors were high, but satisfaction regarding "the quantitative and qualitative level of collected information' and 'economic support for developing the technology roadmap' were relatively low considering the degree of importance placed on these elements, and therefore these factors were determined to be in need of concentrated support in the course of administering the program in the future. Also, satisfaction regarding the process factors were high overall, but notably, satisfaction regarding 'regular updates of the technology roadmap' was relatively low despite the high level of its perceived importance, indicating the need to introduce regular updates to the prepared technology roadmap as new support feature, or to include such updates in the existing program.
[Table 8] Importance and satisfaction level of input factors
Importance and satisfaction level of input factors
[Table 9] Importance and satisfaction level of process factors

Importance and satisfaction level of process factors
The analysis demonstrated that henceforth, priority should be given to improving factors found to have high levels of importance but currently failing to generate a high level of satisfaction, namely factors such as 'regularly scheduled updates,' 'economic support,' 'level of information,' 'information utilization and sharing,' and 'participation and communication.'
2. Technology Roadmap Performance
The surveyed SMEs judged that support for technology planning using TRM has contributed 50% or more to new product and new technology development and 20% or more to gaining entry into new markets, and estimated that the increase in sales achieved by developing the TRM will amount to an average of 700 million won or more.
Although it takes time for the outcomes of planning to become manifest and that various other factors in addition to successful planning may affect the technology development success, it was notable that 34.9% of the supported companies applied for one patent or more, and 23.1% registered one patent or more. Considering that the participating companies were SMEs that consists of around 60 employees, this is a very excellent level of performance, indicating that participation in the program has contributed to the expansion of intellectual property rights. Also, the level of contribution was found to be higher in terms of patent application and registration compared to utility models, which led to the conclusion that this program has a greater effect on planning larger, more significant inventions that SMEs usually find difficult to plan on their own. The contribution rate of the program was respectively 50% or more for both product development and new technology development, and therefore it is judged that support for the planning process can indeed enhance the performance of new product and new technology development among SMEs.
The amount of increase in sales generated by technology planning support was estimated to be around 717 million won (with some companies giving estimates as high as 10 billion won or more), and the rate of contribution to entering new markets was estimated to be around 25%. The fact that the relative satisfaction level was low compared to the responses regarding technology development can be interpreted as an indication that there is a significantly high level of expectation regarding technology roadmaps.
[Table 10] Contribution to product/technology development and market

Contribution to product/technology development and market
Since the survey targeted companies that participated in the program recently in the last four years, many of these companies still remain at the beginning stages of their technology development or product development projects, but 60% or more of the companies are currently engaged in technology development in accordance with planning outcomes and 20% or more of the companies have even reached the stage of successful product development and commercialization: these statistics demonstrate that the planning outcomes generated by the technology roadmapping support program have been actually utilized and reached fruition. As companies gradually progress through the stages of technology development, product development and commercialization, the rate of realization in comparison to plans and the companies’ sense of satisfaction begin to slightly decline. This decline can be attributed to the fact that some of these companies have not yet entered the stage of commercialization, or the fact that achieving ultimate success in commercializing developed technology requires not only planning capabilities but various other abilities as well, such as technological competitiveness, financing and marketing.
[Table 11] Current stage and level of outcomes

Current stage and level of outcomes
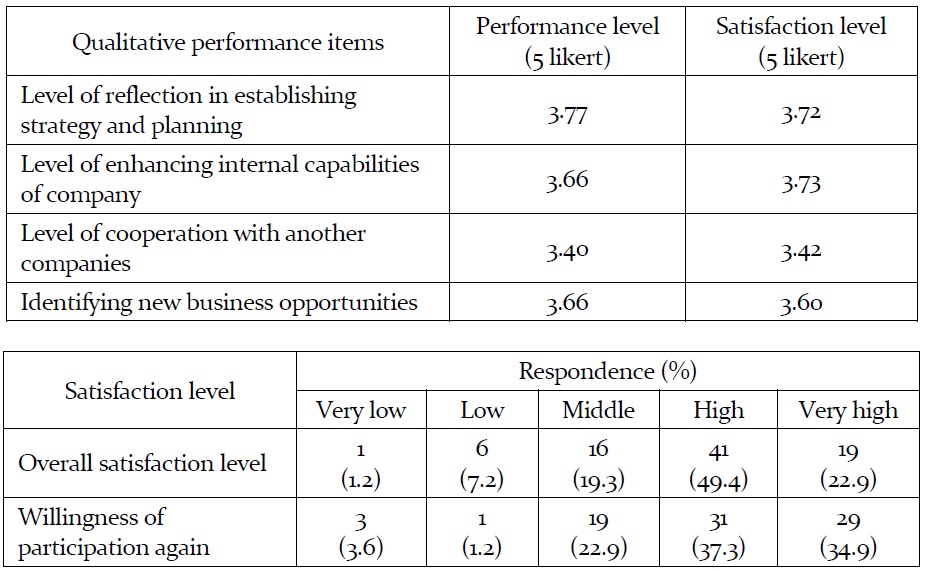
The outcomes of technology planning achieved by the program were reflected in the strategies and plans established by the companies, and ultimately generated qualitative performance improvements by enhancing the internal capabilities of companies and enabling them to exploit business opportunities. It appeared that the program achieved performance and satisfaction levels more remarkably in qualitative areas that are difficult to evaluate quantitatively. It was particularly notable that the technology roadmapping support program received an overall satisfaction rate of 90% or more, with 95.2% of the companies expressing a willingness to participate again and 34.9% of the companies responding that they definitely wish to particulate again.
[Table 12] Performance and satisfaction level and willingness of re-participation
Performance and satisfaction level and willingness of re-participation
VII. Comparative Analysis of Companies
We compares that companies participated in the program with companies that did not participate in terms of their "number of full-time employees, number of R&D employees and sales growth rate", "level of outcomes realized through the program". In this analysis, the respondents were compared by categorizing them into three distinct groups, namely ① companies that created their technology roadmaps through the program, ② companies that created technology roadmaps on their own, and ③ companies that did not use TRM. According to the characteristics of the respective item, the t-test or the χ2-test was performed to verify whether the values or distributions were the same for the group of supported companies and for the group of unsupported companies, and simple statistical analysis was performed to compare the characteristics of the two groups.
As regards the characteristics of the companies, the participating companies were found to be SMEs characterized by around 60 employees, around 20 employees engaged in R&D and annual sales of around 10~20 billion won. Non-participating companies had an average of around 40 employees, 6 employees engaged in R&D and annual sales of around 8~12 billion won. The non-participating companies were similar to participating companies in terms of their business models and were slightly smaller in size.
1. Number of Employees, R&D Employees, Sales Growth Rate
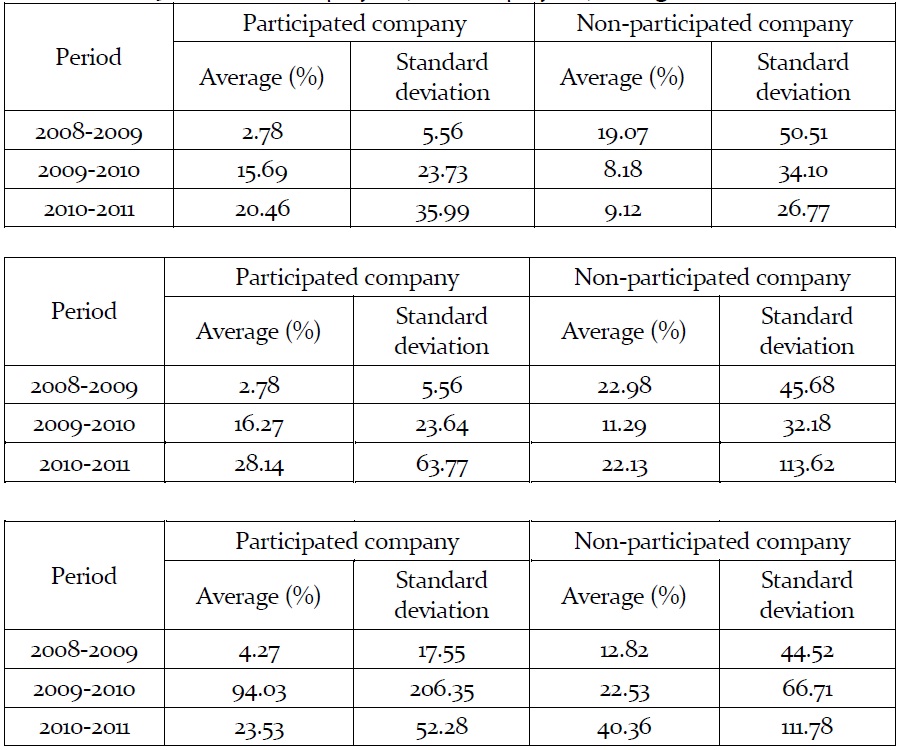
Based on the premise that participating companies (supported companies) and non-participating companies were similar in their basic characteristics, it was found that overall, participating companies exhibited a higher growth rate between 2009 and 2011 compared to non-participating companies.
[Table 13] Number of employees, R&D employees, sales growth rate
Number of employees, R&D employees, sales growth rate
The growth rate in the number of full-time employees was higher among participating companies compared to non-participating companies in both 2010 and 2011, excluding the growth rate for 2009 (compared to 2008). Likewise, the rate of increase in the number of R&D employees was slightly higher among participating companies compared to non-participating ones in both 2010 and 2011, again excluding the growth rate for 2009 (compared to 2008). In addition, the sales growth rate was significantly higher among participating companies than among non-participating ones in 2010, excluding the growth rate for 2009 (compared to 2008). In 2011, the non-participating companies showed a slightly higher growth rate, and this can be attributed to the fact that the sales growth rate was relatively higher in 2010. Specifically, it appeared that the improvements in sales performance for companies supported in 2008 became gradually manifested over the course of 2010 and 2011. (As for 2009, the time lag was not sufficient to properly evaluate the program's performance in 2008.)
2. Technology Roadmap Performance
The TRM performance in terms of rate of realization or satisfaction was found to be higher overall among companies1 that self-developed their TRM compared to the rate of realization or satisfaction yielded by plans created through the program. This indicates the importance of cultivating the companies' ability to self-develop their technology roadmaps while simultaneously supporting the roadmapping process for companies that current lack sufficient capabilities for developing a TRM.
[Table 14] Level of output by program, self TRM and self R&D(no-use) companies
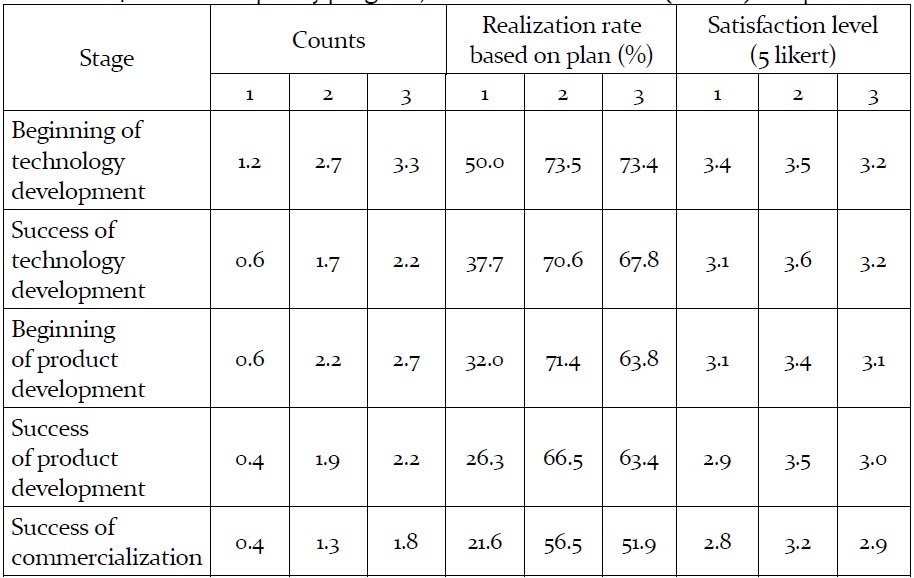
Level of output by program, self TRM and self R&D(no-use) companies
Companies that self-developed their own TRM were determined to be 'small, technology-based relatively growth model companies' or 'venture companies' that may be relatively small in size but have a high rates of R&D investment and sales. These are judged to be companies that have high levels of investment in R&D and therefore place a high degree of importance on technology planning based on meticulous preparation and implementation of TRM. It was found that companies that prepare TRM achieve a higher level of sales compared to their company size. However, against expectations, it was found that relatively larger companies were not engaged in self-developing their own TRM. This lead to the conclusion that companies with a smaller number of employees and R&D personnel are more likely to have technology developers participating directly in the TRM process, and that they tend to achieve a higher rate of realization based on planning and satisfaction levels in regards to the TRM.
[Table 15] Company characteristics for self developing and non-using TRM
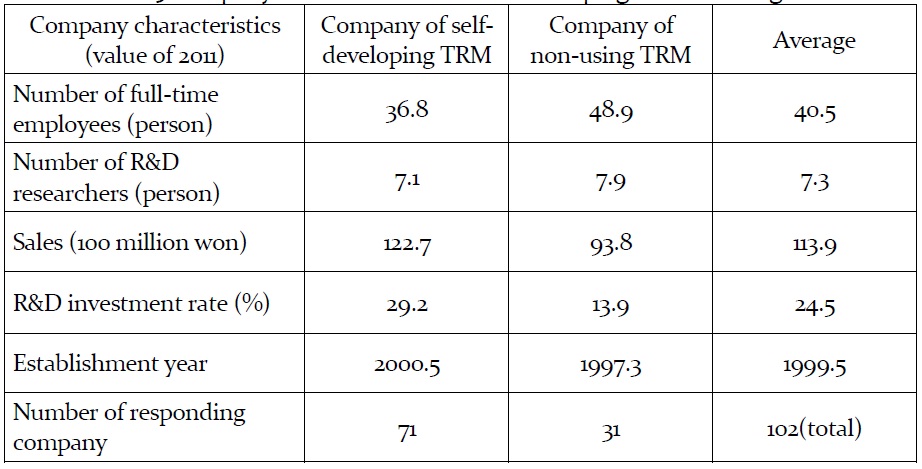
Company characteristics for self developing and non-using TRM
As regards the level of output in terms of rate of realization or satisfaction of TRM, although companies with the program is lower than companies that self-developed TRM, they showed a higher growth rate of sales and employees including R&D part between 2009 and 2011 compared to non-participating companies empirically.
1 In response to the question asking whether the company uses TRM, the companies that self-developed their own TRM were the ones that answered that they used a TRM for 'the majority of technology planning,' or used it 'frequently,' or 'sometimes'. Meanwhile companies that did not use a TRM included those that responded that they 'did not use TRM at all.'
VIII. Comparative Analysis of Performance
A group of high-performance companies and a group of low-performance companies was designated from among the participant companies based on their TRM performance and the characteristics of each group were analyzed comparatively. Based on comprehensive performance, quantitative performance and qualitative performance, the top 20% of the companies (16 companies) were defined as the group of high-performance companies, while the lowest 20 % companies (16 companies) were defined as the group of low-performance companies.
[Table 16] Comparative Analysis Method of performance
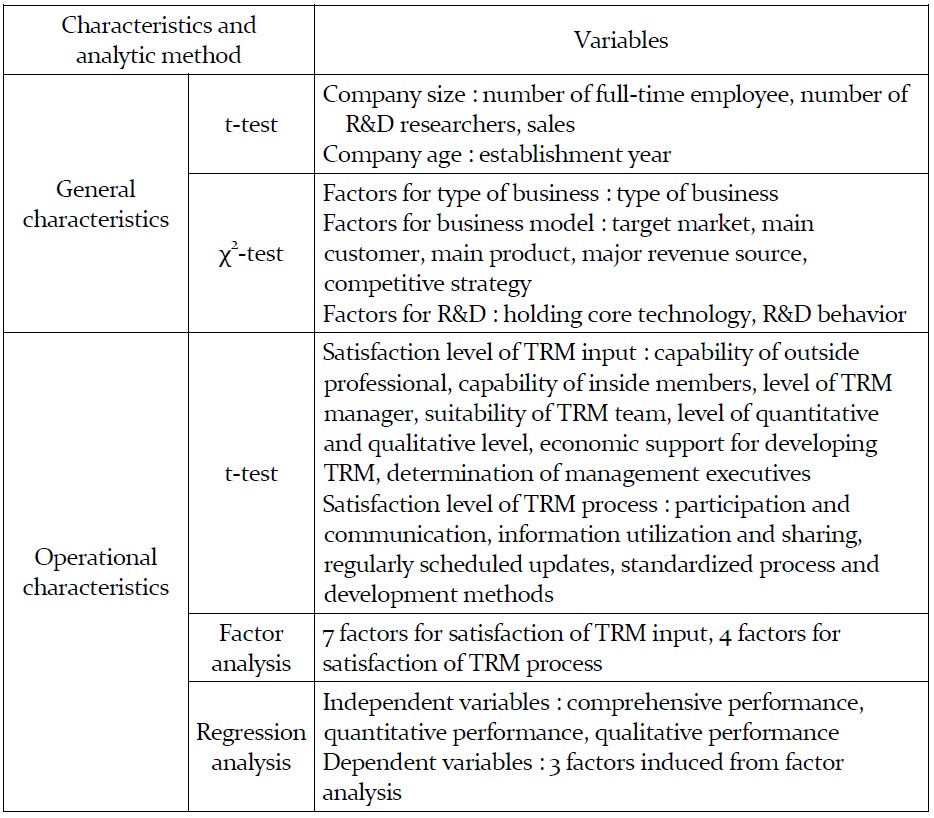
Comparative Analysis Method of performance
Comprehensive performance (with the highest score set as 21 points) was assessed based on the sum of both quantitative performance (with a highest score of 9 points, based on creation of relevant intellectual property rights, contribution to product/technology development, and market contribution) and qualitative performance (with a highest score of 12 points based on incorporation into company policy establishment and planning, enhancement in the company's internal capabilities, collaboration with other companies, and exploitation of business opportunities). High-performance companies scored in the range of 17-21 points, while low-performance companies were those that scored in the range of 7-10 points.
Depending on the characteristics of the item in question, the t-test or χ2-test was performed to verify whether the values or distribution of the highperformance group and the low-performance group were identical, and simple statistical analysis was used to compare the characteristics of the two groups. In addition, to more specifically identify the impact of operational characteristics on TRM performance, we developed a regression model to be used in the analysis.
The comprehensive performance was found to be higher among smaller companies with a relatively small number of full-time employees and low sales, and this appeared to be because the anticipated effects are relatively greater when support is received by small-sized companies that are significantly restricted in their ability to self-develop planning due to insufficient company resources.
[Table 17] Performance difference by company size
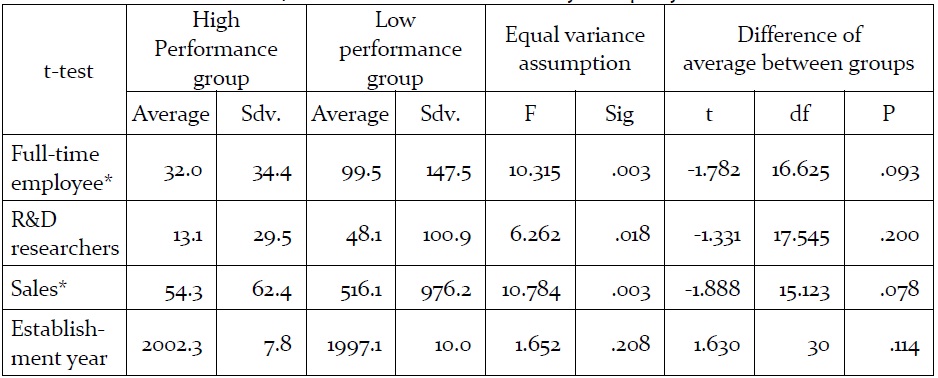
Performance difference by company size
Companies that received high comprehensive performance scores for the program were mostly companies that targeted specialized domestic markets, while those with low comprehensive performance scores mostly those that targeted overseas markets. The companies that can anticipate highly effective results from the program were those that build upon superior technological competitiveness to target their business to specialized domestic markets, and such SMEs will be able to benefit from various advantages if they are appropriately provided with market information and assisted in systematically establishing technology development plans.
[Table 18] Performance difference by business type, business model and R&D
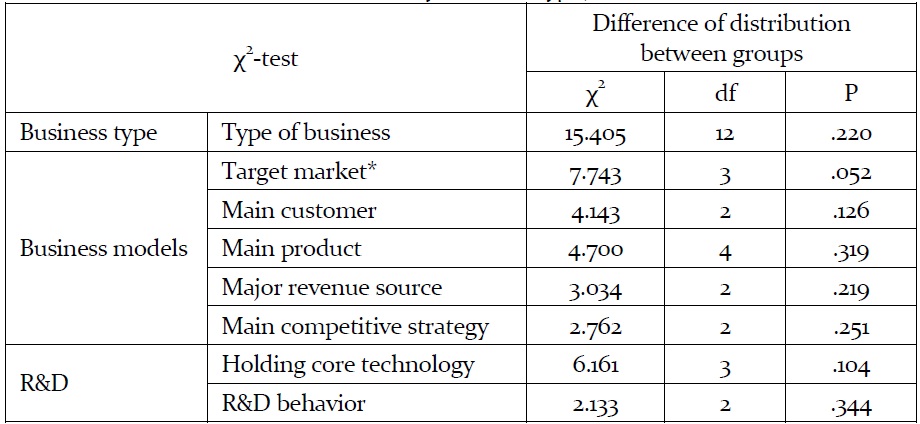
Performance difference by business type, business model and R&D
The items in which there were particularly notable differences on average were input factors including 'the degree to which administrators fulfilled their roles’ and 'suitability of members of roadmapping organization’ and ' quantitative/qualitative level of the information' as well as process factors including 'regular updates', 'utilization of standardized processes.’ To address shortcomings in these input factors, it will be necessary to develop and administer a systematic program to foster TRM facilitators to help SMEs, and to interlink the program with the capabilities of KISTI to provide a sufficient amount of high-quality information in the process of development of TRM. Also, it is essential to review whether the organization preparing the roadmap is composed of suitable members before initiating the technology roadmapping process. As for the process factors, support should not be limited to a form of one-time assistance; the program should support the development and consolidation of a ‘standardized process for SMEs' that will enable SMEs to self-implement their own technology planning and provide processes or support programs that will enable them to regularly update previously developed roadmaps.
The factors that affect comprehensive performance were derived by organizing the characteristics of the operational process into independent categories of ‘excellence of support infrastructure,’ ‘excellence of process,’ and ‘excellence of internal personnel,’ and it was found that all three factors had significant impact, and in particular, ‘excellence of support infrastructure’ was shown to have relatively higher importance in improving comprehensive performance.
[Table 19] Operational process by satisfaction level
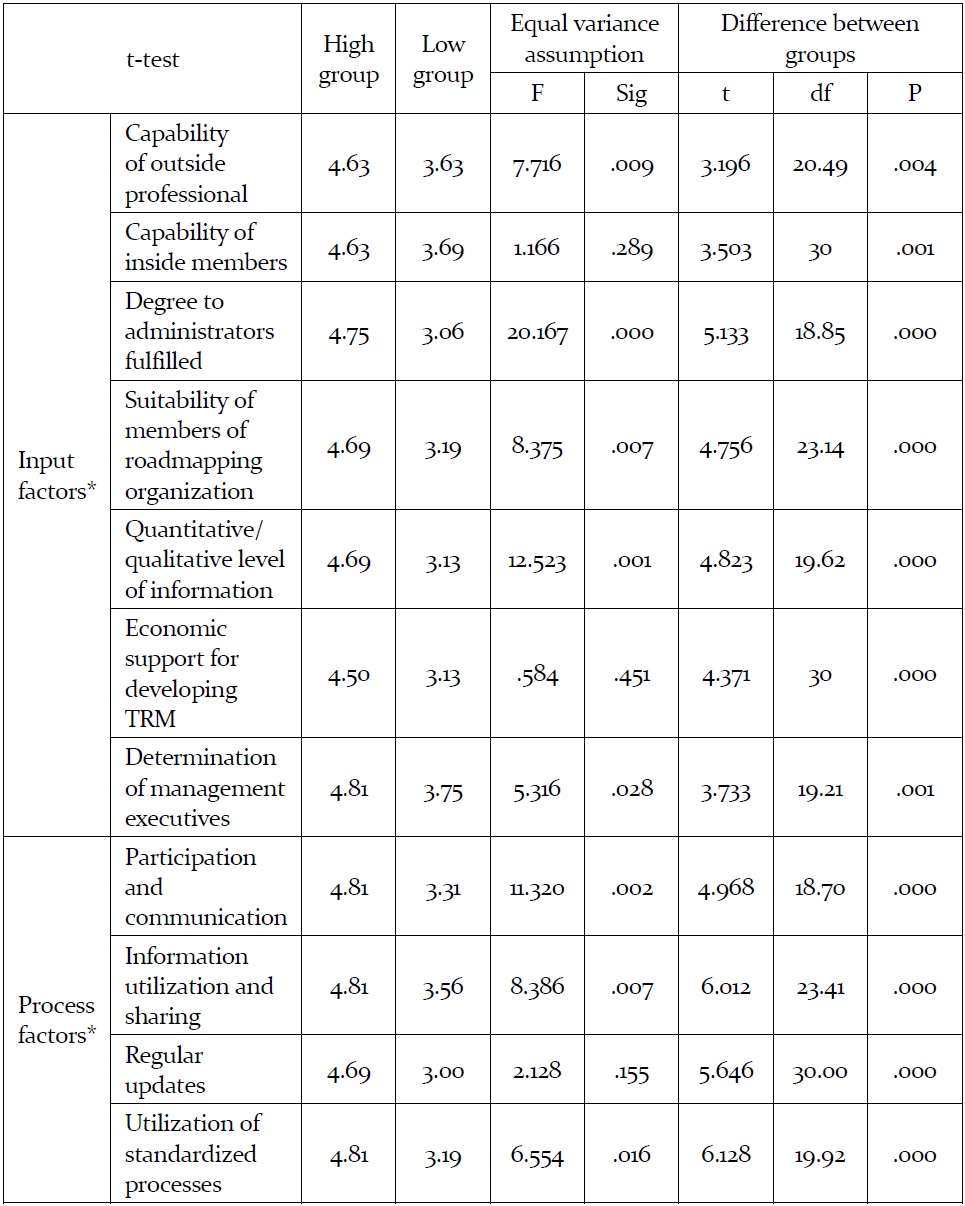
Operational process by satisfaction level
Based on the analysis of the factors related to the operational process, we extracted three mutually independent factors from points where the cumulative dispersion reached 80%. Examining each of the factors, four process characteristics and one input characteristic were grouped into one factor, while the remaining six input characteristics were grouped into two factors.
[Table 20] Factor analysis on operational process
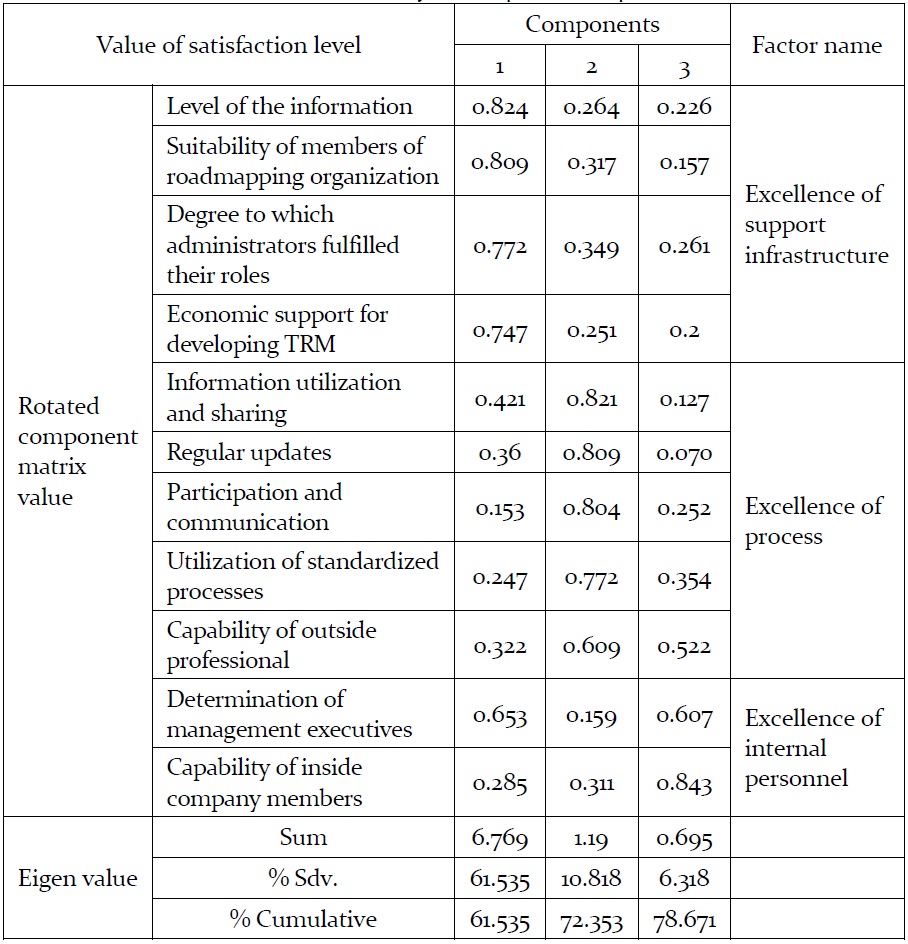
Factor analysis on operational process
Our analysis of the impact of each factor on comprehensive performance demonstrated that the KSF of TRM, which was only conceptually references in the existing literature, actually did exercise significant impact on actual performance, and in particular, ‘support infrastructure’ was found to have a relatively high degree of importance for small and medium businesses.
[Table 21] Factor effects for comprehensive performance
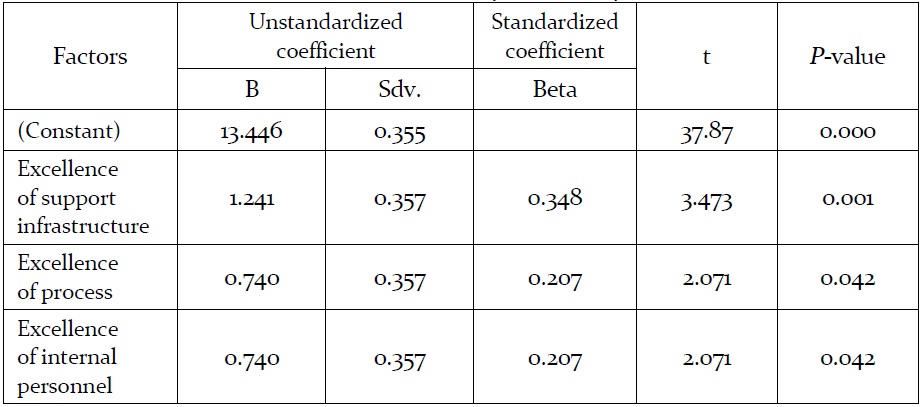
Factor effects for comprehensive performance
This study was an attempt to evaluate the performance of TRM and now that more than ten years have passed since TRM was first adopted into the private sector in Korea, this study will provide significant insights into the usefulness of TRM as a tool for technological planning and the task of evaluating their performance empirically. Since TRM can be regarded as a tool for technology forecasting, it is possible to adopt the analysis framework used for technology forecasting to evaluate TRM performance, and to proceed to evaluate TRM in terms of both their process and their outcomes. In regards to outcomes, the objective of the evaluation is to assess whether the 'outputs of TRM generated the anticipated effects', and we determined that these effects could be evaluated in terms of performance (degree of contribution to technology development and market creation), outcome (the degree to which the outcomes were actually realized) and impact (the degree of impact on the planning culture within companies). In regards to the process, the evaluation should determine whether the 'technology roadmapping process was implemented in a fair and valid manner', and we judged that this could be assessed from the perspective of input by evaluating whether suitable resources were provided and also from the perspective of the process by evaluating whether the 'TRM was developed through a fair process'. We believe that by continually evaluating the technology roadmapping process and its outcomes using the framework developed in this study, it will be possible to pursue improvements to the overall process of technology planning.
The framework was applied to empirical analysis performance of SMEs that created their TRM through the "Support Program for the Individual Company Technology Roadmaps" that was implemented by Korea’s Small and Medium Business Administration over the course of 4 years from 2008 to 2011. The results of this evaluative analysis indicated that performance was satisfactory both in terms of outputs and in terms of process. Since the companies surveyed for this study consisted of SMEs, it is understandable that TRM performance was even higher in terms of impact than in terms of performance or outcomes.
The results of our performance analysis of the program among SMEs indicated that overall the program yielded a high level of satisfaction, but there was a desire for linkage with funding support programs for future technological developments or commercialization efforts. Upon comparatively analyzing the respective performances of participating companies and nonparticipating companies, this study found that companies that participated in the program exhibited higher growth rates compared to companies that did not participate. However the level of utilizing the outcomes of technology roadmap planning was higher among companies that self-developed their own roadmaps. This points to the importance of concomitantly fostering the ability of companies to create their own roadmaps. The results of our comparative analysis of high-performance companies and low-performance companies indicated that companies with relatively smaller sizes (based on the number of employees and amount of sales) showed higher levels of performance, but qualitative performance was particularly higher among companies that had been more recently established. There were significant differences in terms of all eleven operational characteristics that were included in the evaluation. The differences in satisfaction levels were most notably large in regards to ‘the role of the TRM facilitator,’ ‘the quantitative/qualitative level of information’ and ‘regular updates.’
The purpose of this study was to develop a framework for evaluating the performance of TRM and to use the framework to analyze empirically the performance of companies that participated in the program operated by the Small and Medium Business Administration to support technology roadmaps for individual companies. Henceforth, there will need to be continued research to identify the KSF for enhancing performance or to derive Best Practice models. In this study, we utilized factor analysis and a regression model in an attempt to determine the KSF for each type of performance, but a more refined model will need to be developed and applied hereafter. In order to provide pragmatic assistance to SMEs seeking to develop technology roadmaps, we believe 'Best Practice' examples that refer to specific activities will be more helpful than KSF which may tend to be more abstract. Since there is a limit to the range of data that can be collected through surveys in general, this data should be supplemented by in-depth of analysis of companies that exhibit high-performance in technology roadmapping to obtain more detailed information pertaining to TRM performance. By identifying the characteristics shared only by such high-performance companies (such as the area of industry, size, and business model, and so on.), it will be possible to collect significant reference material that will help select the companies to be included in similar support programs in the future. In particular, a detailed analysis of the activities performed by such high-performance companies in the process of preparing their TRM presented in the form of a checklist will enable us to derive the Best Practices for the technology roadmapping program.

