Underwater mooring platforms (UMPs) are a class of underwater devices that are anchored to the seabed through mooring cables. Common UMPs include subsurface buoys, moored mines and self-mooring autonomous underwater vehicles (AUVs). Most of present UMPs are battery-powered and due to their limited energy supply, they couldn’t work underwater for a long time. To enhance the operating time, it seems promising to extract energy from the ocean and charge the batteries of the platforms. Researchers have tried utilizing ocean thermal energy to propel underwater gliders (Webb et al., 2001). However, energy density of the ocean thermal energy is very low and the vehicle must follow saw-tooth-liked trajectories to gain enough energy (Webb et al., 2001). Therefore ocean thermal energy utilization is not suitable for UMPs which are expected to perform fix-point monitoring underwater.
UMPs stay in moving water, such as ocean current and tide, all the time once deployed. The energy stored in moving water gives us a potential alternative to recharge the UMPs. Water turbines, which have been widely used for hydropower generation, can be classified into two categories depending on the orientation of turbine axis with regard to the water flow direction. The horizontal axis water turbine (HAWT) has an axis of rotation parallel to the current direction (Myers and Bahaj, 2010). This type of turbine has a propeller-type design with two or three blades and is rotated by the lift generated on the blades. The vertical axis water turbine (VAWT), also known as the cross-flow water turbine, rotates around an axis perpendicular to the current. VAWTs are less efficient compared with their horizontal counterparts, but they can operate regardless of the flow direction and are more suitable for small scale power generation (Yang and Lawn, 2011).
One of the most famous VAWT is the Darrieus turbine, which uses airfoils to create lift that maintains rotation. There has been considerable effort made to model the hydrodynamic forces on the Darrieus turbine (Declaire et al., 2009; Ye and Calisal, 2010). Darrieus turbine has also been studied extensively using CFD and experimental methods to optimize the performance (Jung et al., 2009; Howell et al., 2010).Variable pitch control mechanism (Hwang et al., 2009; Schonbore and Chantzidakis, 2007), channeling device (Ponta and Dutt; 2000), and twisted blades (Gupta and Biswas, 2010) have been adopted to further improve starting torque and efficiency, and deduce shaking of the Darrieus turbine.
Another type of extensively investigated VAWT is the Savonius turbine, which is composed of several arc-shaped blades. Savonius turbine has been studied experimentally and numerically to examine the effects of various design parameters such as the rotor aspect ratio, the overlap, the number of buckets, the rotor endplates, and the influence of bucket stacking (Saha et al., 2008; Irabu and Roy, 2011; Akwa et al., 2012). In addition, many researchers have worked to improve the efficiency and the starting torque characteristics of the Savonius rotor. Some of these include adding guide vanes or deflector plates in front of the rotor preventing the negative torque opposite the rotor rotation (Golecha et al., 2011; Altan and Atilgan, 2008).
In order to collect energy from the moving water and recharging the UMPs, a miniature VAWT that can be installed on UMPs is designed in this paper. This research focuses on exploring the operating performance and power output of the turbine with a two-dimensional computational fluid dynamics (CFD) method. Sliding mesh model, which uses a time averaged solution to determine the turbine performance, and has been proving to give relatively accurate results for a two-dimensional rotating rotor (Jung et al., 2009; Pope et al., 2011; Akwa et al., 2012; Yang and Lawn, 2011), was used in the simulation. The influence of structural parameters, including foil section profile, foil chord length and blocking ratio, on the turbine performance are investigated over a range of tip-speed-ratios (TSRs).
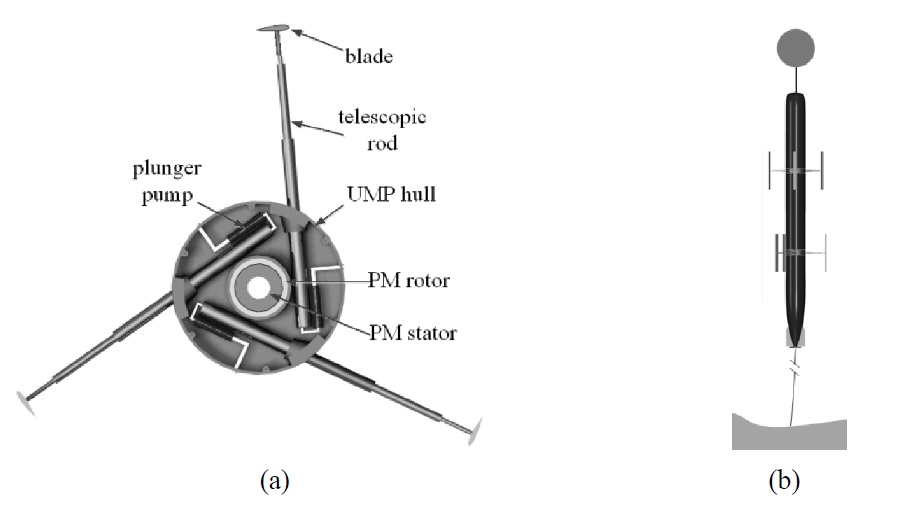
The VAWT is mainly composed of several straight blades, telescopic rods, plunger pumps and a permanent magnet (PM) generator, as shown in Fig. 1(a). The blade has an airfoil section and is mounted at the end of the telescopic rod. The telescopic rod, which has a hollow structure, is collected with the plunger pump. The telescopic rods, plunger pumps and the PM generator rotor are fixed at the hull of the UMP and the PM generator stator is fastened to the main axis of the UMP.
The blades can be opened or closed by controlling the plunger pumps to draw or expel sea water. When the blades are opened, the turbine is similar to a Darrieus turbine and uses the lift on the blades to propel the rotor. When they are closed, the blades fit closely to the surface of the UMP hulls without influencing other functions of the UMP. The location of the blade pivot point was determined at a 25% position from the leading edge, which is the aerodynamic center, in order to minimize the blade actuating force.
Fig. 1(b) shows the case when the VAWT is mounted on a self-mooring AUV. Two contra-rotating VAWTs are utilized to eliminate the roll torque on the UMP. The self-mooring AUV is intended to travel to a desired mooring location, moor itself on
the seafloor, and then release the mooring and return to a desired egress location (Robert, 2010). When the vehicle successfully moors on the sea floor the plunger pumps inside the VAWT start to draw in water to the telescopic rods and open the blades. During the whole mooring time, the VAWT works to provide sustaining energy for the vehicle. With the aid of the VAWT, the vehicle is capable of achieve a longer periods of mooring time. At the end of the mooring time, the pumps expel sea water and close the blades, and then the vehicle releases the mooring and returns to a desired egress location.
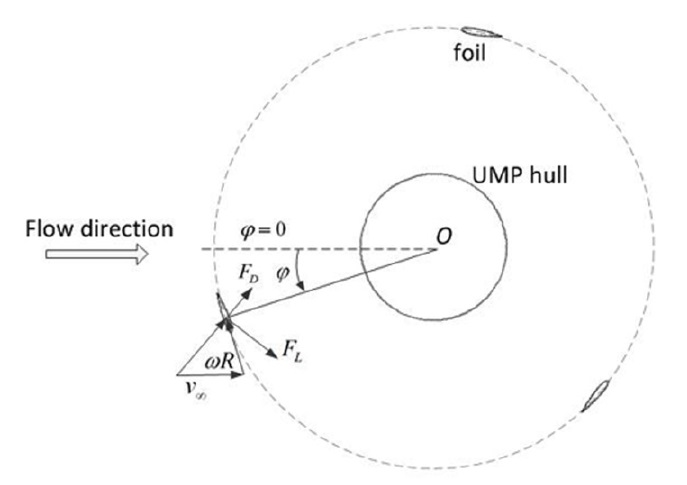
The VAWT introduced in this paper is different from the Darrieus turbine because the UMP hull locates in the center of the turbine. Therefore, it is necessary to explore the output performance of the turbine with the disturbance of the UMP hull considered.
The two-dimensional numerical simulations presented in this paper were carried out using the commercial code Fluent 13.0, which is based on finite volume method. A sliding mesh model was applied to perform the simulation.
Since the straight blades have the same cross section, the blade span effect can be ignored and two-dimensional simulations are chosen. In two-dimensional simulations, the blade has a unit span. Fig. 2 illustrates the situation where the turbine rotates with an constant angular velocity,
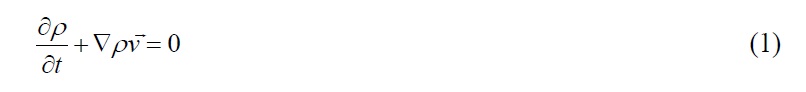
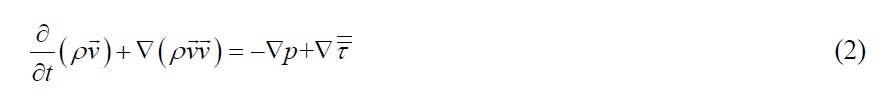
The governing equations are given by the incompressible form of the Navier-Stokes equations, including the continuity equation and momentum equation, as shown below,
where

refers to the stress tensor.
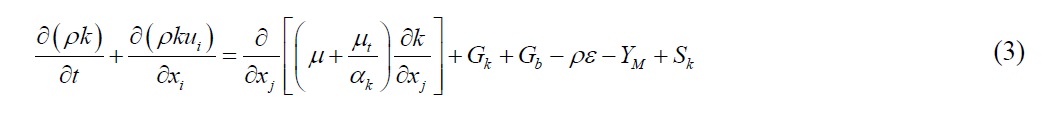
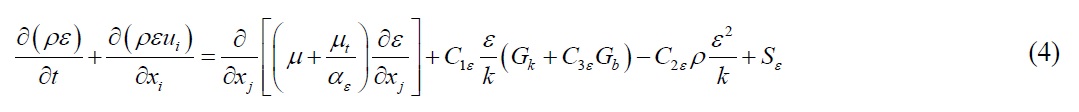
To predict the turbulence effects in the transient predictions, a standard two-equation
where
>
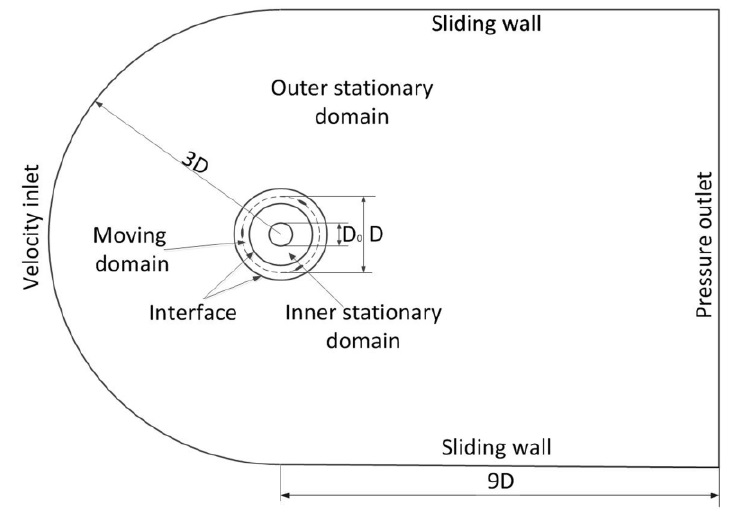
Computational domains and grid generation
The computational domain has a width of 6
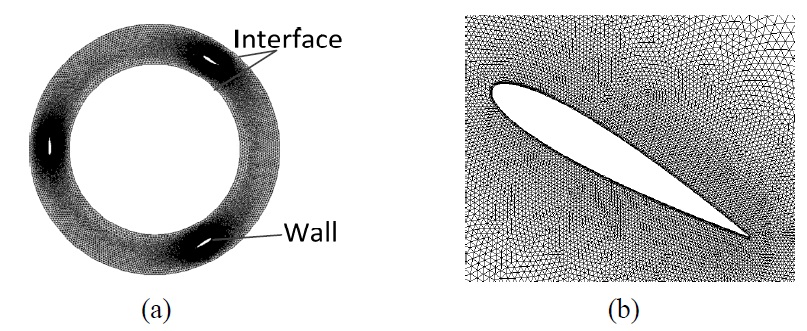
The overall domain was split into three subdomains, including an outer stationary subdomain, a rotational subdomain containing the blades and an inner stationary subdomain containing the UMP hull. The rotational subdomain is separated from the other two stationary subdomains by two sliding interfaces, which allow the transport of the flow properties. No-slip boundary conditions were imposed at the surface of the blade.
All the three subdomains were discretized with triangular elements. Grids closest to the profiles of the blades were refined with rectangular boundary elements to describe with sufficient precision the boundary layer flow (as shown in Fig. 4). Grid node density was higher in the rotational subdomain than in the steady subdomains. Moreover, to precisely present the flow field inside the turbine, grid node density is higher near the blades and the UMP hull. The grids were created so that the control volumes are finer near the walls and coarser towards the boundaries.
In this paper, all simulations were carried out with a constant flow velocity,
>
Numerical method verification and validation
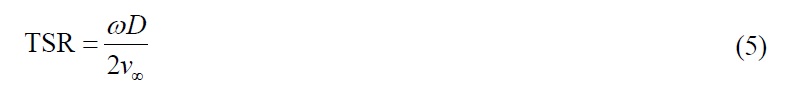
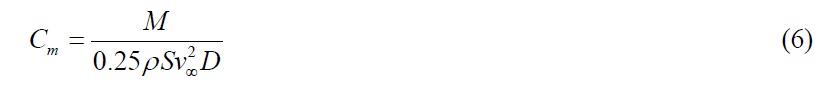
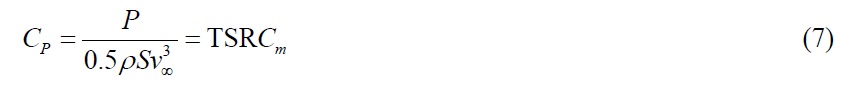
Tip speed ratio means the ratio between rotor blade tip speed and inflow water speed and is defined as
Performance of a water turbine can be characterized by the manner in which the two main indicators-power coefficient (Cp) and torque coefficient (Cm) -vary with
where
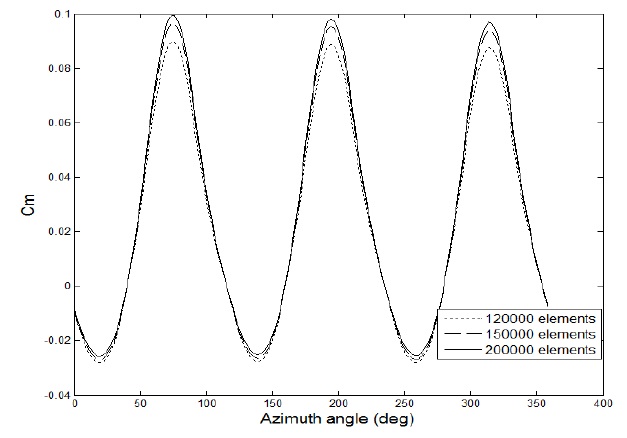
A grid convergence study was performed to evaluate the influence of grid density on the torque of the rotor. The simulations were conducted with a VAWT equipped with three NACA0015 blades (blade chord length
respectively. It can be seen that grids with approximately 150000 and 200000 elements gave substantially the same results. Considering the time economy in the simulation, the medium grid density was chosen for the following simulations.
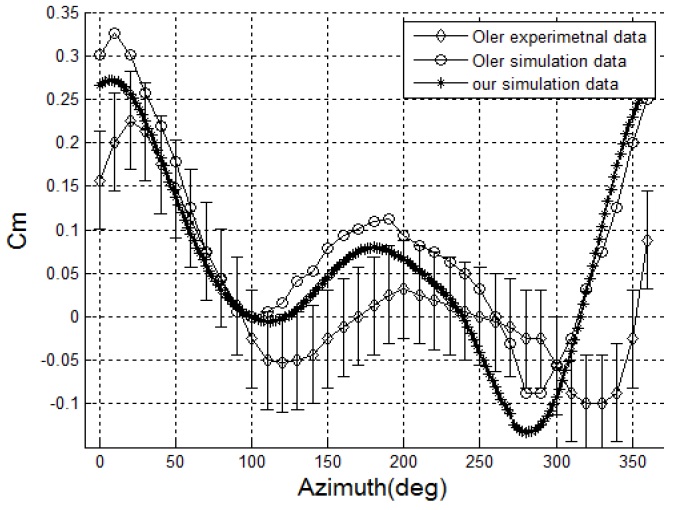
In order to validate the accuracy of the method used in this paper, we performed simulation of a one-bladed Darrieus turbine and calculated the moment of turbine. The numerical results are then compared with towing tank experimental data from Oler’s work (Oler, 1983). The setting of the experimental model is listed in Table 1.
[Table 1] Setting for the simulation verification.
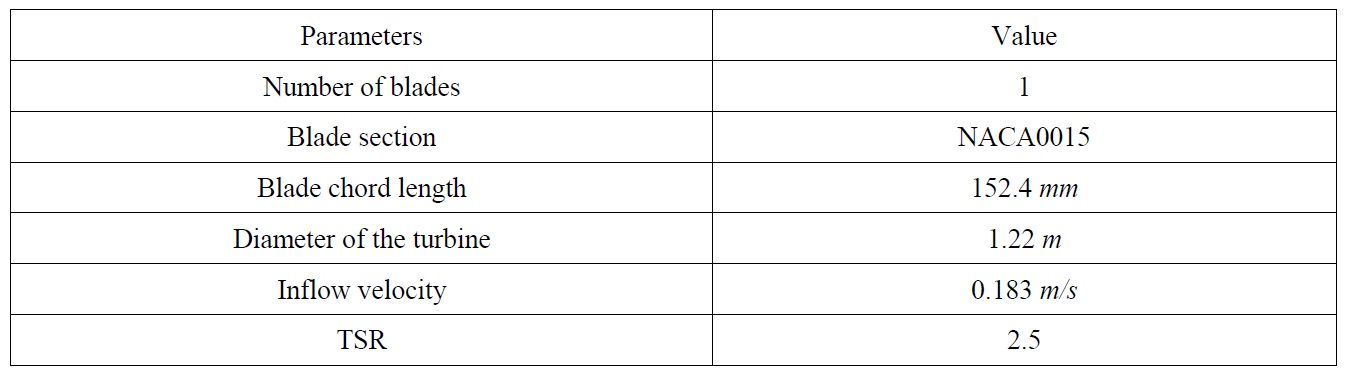
Setting for the simulation verification.
Fig. 5 shows the moment of the turbine according to the azimuth angle. It can be seen from Fig. 6 that our numerical results agree well with that of the Oler’s. Curve of the numerical results is a little higher than that of the experimental data. This phenomenon may be explained that experiment conditions is not perfectly ideal and two-dimensional simulations doesn’t consider the torque loss at the end of the blades.
>
Effect of blade profile on the turbine performance
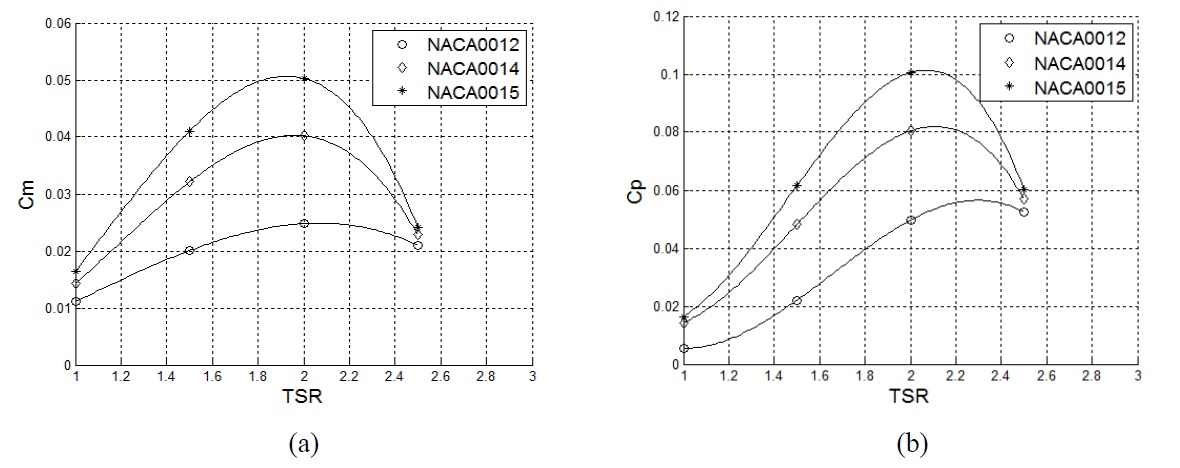
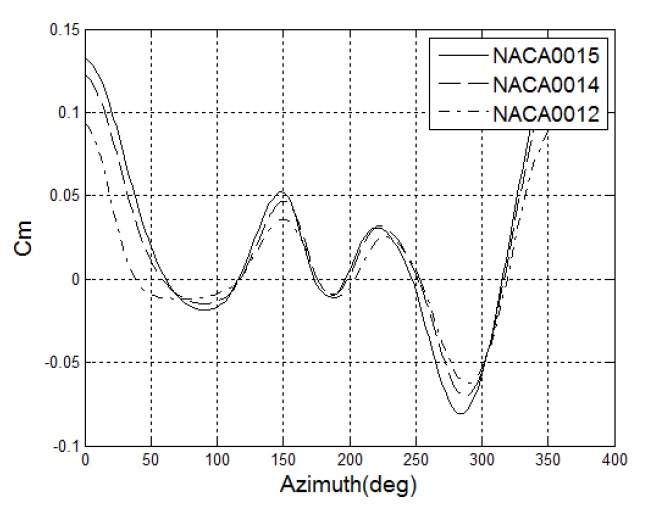
NACA 4-digit airfoils were selected to determine the influence of blade profile on the turbine power output. Three blade profiles, NACA0012, NACA0014 and NACA0015 were chosen. Fig. 7(a) and (b) show separately the averaged Cm and Cp of the turbine with respect to TSR for
As can be seen from Fig. 7(a) that the averaged Cm curve becomes lower and flatter as the blade becomes thinner. This means that turbine equipped with thinner blades generates lower torques and has poorer performance. The averaged Cm curve first rises and then decreases as TSR gets larger. This phenomenon is caused of the dynamic stalling on the blades.
The averaged Cp curve shown in Fig. 7(b) reflects the similar variation trend with the Cm curve. The TSR corresponding to the peak power is higher than that of the peak torque in each curve. The turbine with three NACA0015 blades generates the highest power coefficient, 0.1, at a TSR of 2.
Fig. 8 shows the dynamic torque coefficient of three blades throughout one revolution at TSR = 2. Fig. 8 demonstrates that thicker blades generate larger positive torque, but they also generate larger negative torque.
As shown in Fig. 6, the Cm on a single blade of a Darrieus turbine has two local maximum values throughout one revolution. The larger value locates at
>
Effect of rotor diameter on the turbine performance
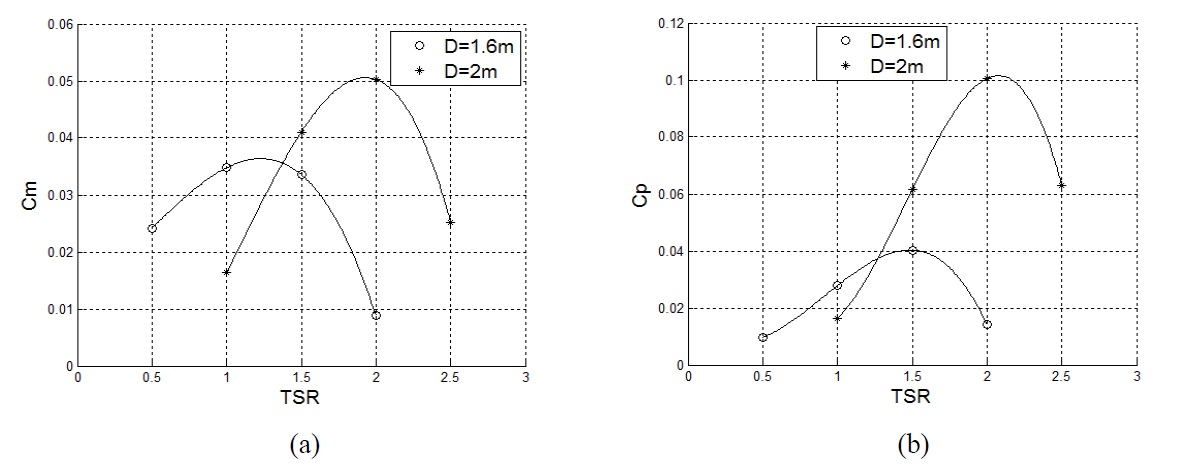
Fig. 9(a) and (b) show separately the averaged Cm and Cp curves of the turbine equipped with NACA0015 blades for
Fig. 9 indicates that the averaged Cm and Cp curves become lower and flatter as rotor diameter decreases. The TSR corresponding to the maximum power in each curve becomes lower as the rotor diameter gets larger. This means that the turbine with a small diameter generates the maximum power at lower TSRs, however, the output value is decreased.
The power coefficient was significantly enhanced when the rotor diameter increased, mainly caused by the reduced blocking effect of the UMP hull. The rotor diameter is a notable factor of the turbine output performance. It is expected that the turbine could draw as much energy as possible from the ocean and the rotor diameter should be enough large. However, the turbine radius is confined by the length of the telescopic rods, whose size must meet the strength requirements and cannot be too long.
>
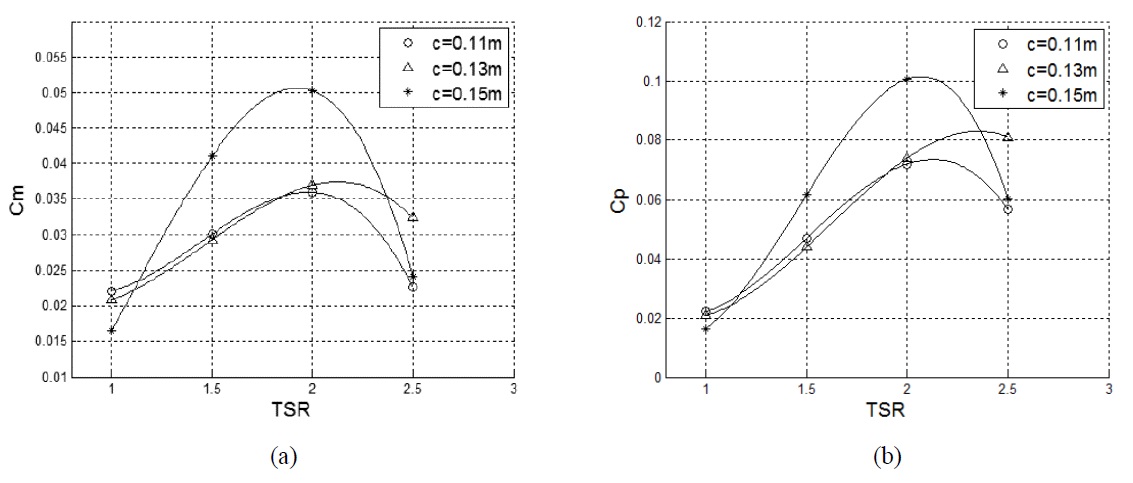
Effect of blade chord length on the turbine performance
Fig. 10(a) and (b) show separately the averaged Cm and Cp curves of a VAWT with NACA0015 blades and a diameter of 2
As can be seen from Fig. 10, the maximum Cm and Cp become larger as the blade chord length increases in the tested range. Turbine with a chord length of
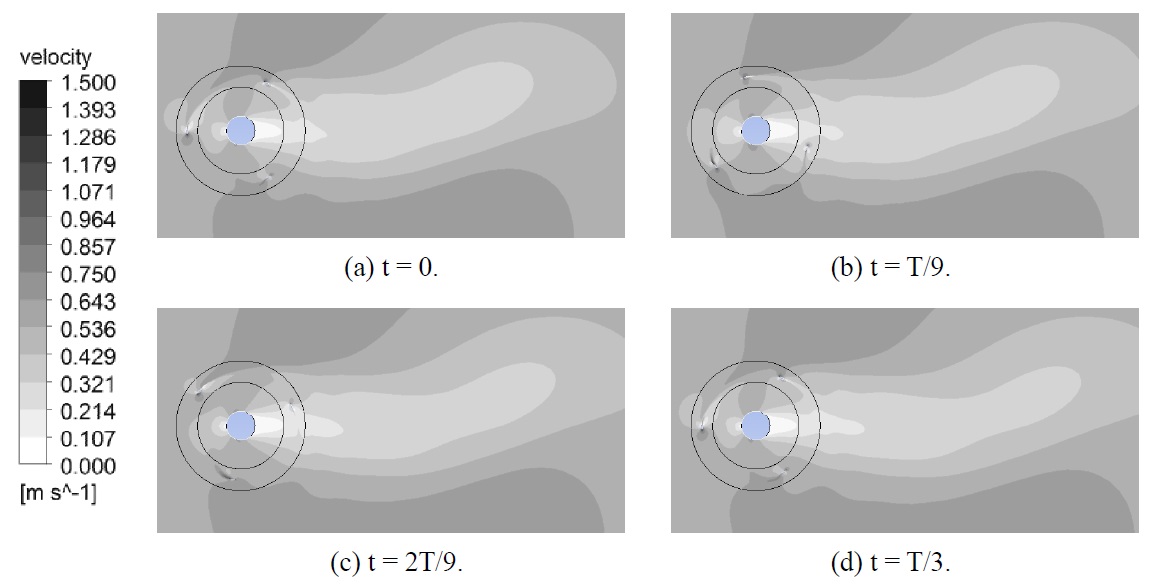
Fig. 11 shows the velocity contours of the turbine with NACA0015 blades when
In this research, a vertical axis water turbine (VAWT) with controllable blades was designed to supply energy for UMPs. Two-dimensional transient numerical simulations were carried out to investigate the influence of structural parameters, including foil section profile, foil chord length and rotor diameters, on the turbine performance. The simulation results demonstrated that:
(1) The averaged Cm and Cp curves have peak values while TSR varies between 1 and 2.5.
(2) The maximum averaged Cp can be enhanced by properly: (a) increasing blade chord length; (b) increasing blade thickness; (c) increasing turbine diameter.
(3) Turbine with three NACA0015 blades has the maximum Cp of 0.1, obtained at TSR = 2, D = 2 m and c = 0.15 m.
In this research, the turbine was supposed to rotate about a fixed axis (the long axis of the UMP hull) and the movement of the UMP was ignored. Actually the UMP will move in space under the forces caused by fluid and the mooring cable. The movements of the UMP will be considered in the future research.