For the last few decades, industries have confronted radical transition or complete dematerialization over time caused by various drivers such as technological development, regulations or changes in customer preference. This powerful phenomenon has been identified as technology convergence (Lei, 2000; Curran and Leker, 2011). Since the 1980s formerly discrete boundaries have already and considerably vanished within industries such as information technology, consumer electronics, and telecommunications, have already and considerably vanished within industries such as information technology, consumer electronics, and telecommunications, so called the Infocom sector (Lind, 2004a). The vision of convergence had considerable influence on corporate strategies in the 1980s and 1990s.
The empirical study of Lind (2004b) made an allusion to future convergence candidates. One allusion was the convergence between wireless and the Internet and the other was the convergence of nanotechnology (NT), biotechnology (BT), information technology (IT) and cognitive science (NBIC) from a long-term perspective. In the keynote of 2007 International Consumer Electronics Show (CES), Shaprio, the president and CEO of the Consumer Electronics Association, emphasized that the phenomenon of convergence in the information technology field has continued, while being combined with new technologies such as nanotechnology and biotechnology. During the paradigm shift, the economically developed countries that had already established national R&D plans and integrated the new technologies were the ones who enhanced both their economic growth and quality of life (Colecchia and Schreyer, 2003). They had acted quickly during the IT period in the 1980s and so again acted quickly to secure their competitive edge in the new convergence era (Samuelson and Varian, 2001).
The United States and the EU were leaders in this effort (Roco, 2005; Sandler and Kay, 2006; Roco, 2004). First of all, the U.S. National Science Foundation (NSF) and Department of Commerce which were commissioned to identify the outline of synergic effects among converging fields of nanotechnology, biotechnology, information technology and cognitive science (CT), called NBIC technologies, reported on “Converging Technologies for Improving Human Performance" in July 2002. The report predicted that convergence of NBIC technologies could improve human physical and mental performance, allowing a significant rise in productivity and maintenance of the national competitiveness in the global economy (Roco, 2002). The European Union also adopted the NBIC technologies with a broad understanding of the converging technology concept and then published the agenda “Converging Technologies for the European Knowledge Society (CTEKS)” in 2004 (Nordmann, 2004) as a European approach to converging technologies. Although there was little difference between the US and the European approaches, both concentrated on the importance of NBIC technologies and supported technological convergence processes between them (Coenen, 2008). Since the U.S's initiative on converging technologies began, the governmentdriven overarching strategic plans have continuously pushed forward for 10 years while other countries such as those in the EU, Japan, and South Korea have aggressively concentrated on not falling behind in the competition (Kim et al, 2012).
Such an increasing interest in the convergence phenomenon has being moving toward NBIC fields from the Infocom sector. This shift can bring in new technological possibilities with potentially revolutionary impact, reconfiguring the fundamental of industry structures (Doorn, 2006). Globally the term convergence has regained the attention from policy makers, academics, and business leaders by triggering the American NBIC convergence initiatives. Although many scholars have persevered in understanding the phenomenon from different perspectives, few studies have been conducted to capture it by using appropriate measurements that reflect its inherent features. A series of recent studies (Rafols and Meyer, 2010; Rafols, Porter and Leydesdorff, 2010; Leydesdorff and Rafols 2011; Rafols et al., 2012) suggested that degree and relationships among various disciplines could be measured by the concepts of diversity and coherence. However, developing the measurement for coherence has been left unsettled. In this study, a new measurement for coherence will be suggested, and the core technology sectors - NT, BT, and IT - that led the new convergence era will be empirically tested to prove usability.
Ⅱ. Approaches to Measure Convergence Phenomenon
1. Conceptual Meanings of Convergence
The Oxford English Dictionary defines the word converge as “come together from different directions so as eventually to meet”. It originates from the late 17th century Latin word, convergere, con-, which means “together” and verger, which means “incline”. The lexical meaning and conceptual definition of convergence implies that a number of things gradually change to become similar or develop into something in common (Curran and Leker, 2011). The similarity about the definition of the concept of convergence is found in other fields. In oceanography, convergence deals with a horizontal inflow of water into an area. In medicine, convergence denotes the pointing inwards of the eyes, which occurs when viewing an object at close range. In biology, it is a phenomenon that separate sources of origin have developed towards a similar biological structure is explained by convergence (Appelgren, 2004). On the other hand, the definition of the term convergence in management practice would be given like “a confluence and merging of hitherto separated markets, removing entry barriers across the market and industry boundaries (Lind, 2004b, p2)”. Particularly it has become a necessary word when presenting new technology or services in the media industry (Appelgren, 2004).
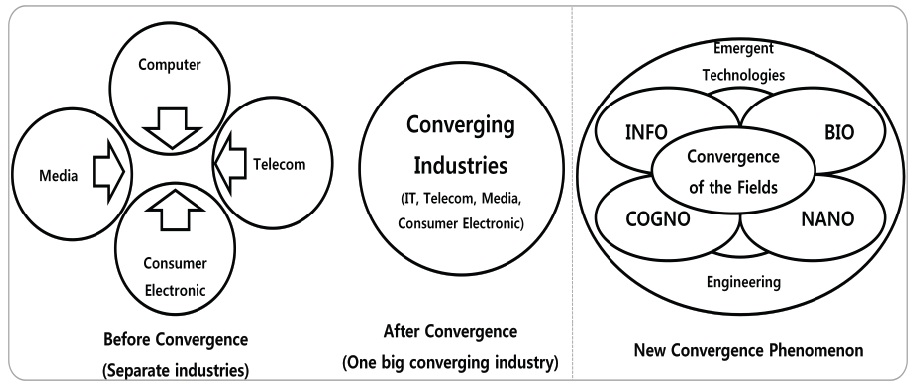
The roots of the term convergence can be found in the article originated from Farber and Baran in the mid 1970s. They approached the issue from a perspective of technology. Nicolas Negroponte at MIT Media Lab illustrated Convergence in 1978 with a figure of three overlapping circles moving together. The circles represented the three industries Computing, Publishing and Printing, and Broadcasting and Film (Lind, 2004b). Figure 1 conceptually described the dynamic flow of convergence as illustrating it as three or four circles gradually moving into each other. This popular image has widely used to show a convergent phenomenon among different industries. During the 1980s and 1990s, these circles generally were represented as IT, telecom, media and consumer electronics and the four industries moved toward merging into one big sphere in which the old industry barriers were broken down and then started to compete with each other, creating new opportunities (see left in Figure 1). Since the early 2000, the convergence phenomenon has regained considerable attention due to the advent of nanotechnology. In this case, these circles were symbolized as information technology, biotechnology, nanotechnology and cognitive science (see Figure 1 on the right).
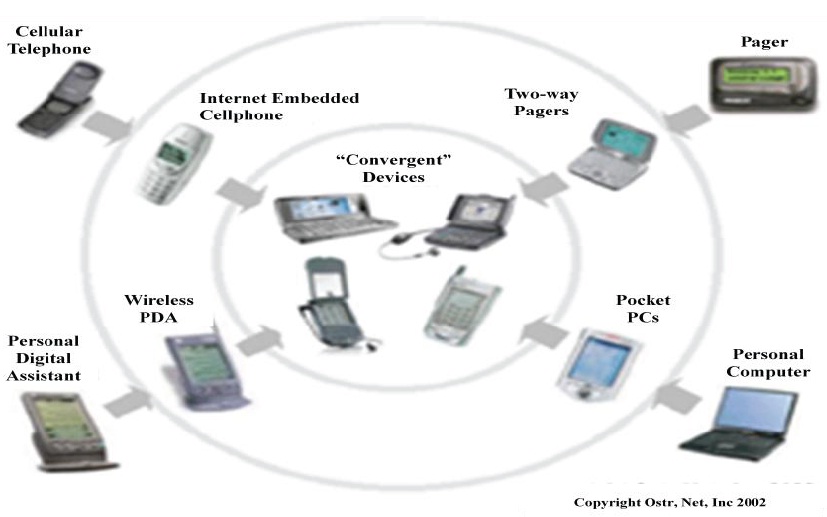
In the non-academic context, various conceptual models keep it convergence have appeared. The most common ways of visualizing convergence are presented as describing the converging devices in Figure 2.
These insights which represented by the use of the well-known figure illustrated favorably the conceptual phenomenon of convergence. However, the efforts for explaining the concept of convergence have caused the amphibological interpretations in various studies. As a result of this conceptual confusion, a multitude of definition of convergences is provided.
1 http://biotic.isciii.es/Biotic/NBIC_English.html
2. Approaches to Understand Convergence in Bibliometric
A vast of scholars has challenged to understand this long-term and complex convergence phenomenon from different perspectives (Rosenburg, 1963; Pennings and Puranam 2001; Stieglitz, 2003). In particular various attempts have been tried to objectively understand the convergence phenomenon with patent data in the bibliometric field. The research patterns in this field may be categorized into four parts.
First, the convergence phenomenon may be represented by changes in the volume of patent data which are classified by specific keywords. The simplest measurement by patents could be found in the work of Duyster and Hagedoorn (1997). The study analyzed the patterns of patents and strategic technologic alliances of major computer and telecommunications equipment companies between 1980 ~ 1993, which showed that firms were basically unaffected by technological convergence. This study assumed that strategic technology alliances occur in order to cope with the convergence process. This analytical method has been mostly used in policy reports in many countries. For example, the European Commission supported a study to understand how the convergence of information computer technology (ICT) with biotechnology, nanotechnology, material sciences and cognitive science (CogSci) could lead to novel applications. These should enable an accelerated implementation of the Information Society and to assess scientific activity within the European Union and compare it with that in Japan and the USA (Van Lieshout et al., 2008). In the study, field keywords are selected within four domains of convergence – CogSci-ICT, Biotech-ICT, Nanotech-ICT and Material Sciences- ICT.
Second, the convergence phenomenon may be depicted by examining the citation relations among documents. As Ziman (1968) points out, “a scientific paper does not stand alone; it is embedded in the “literature” of the subject.” A reference is the acknowledgement that one documents gives to another; a citation is the acknowledgement that one document receives from another (Narin, 1976). Thus, a citation implies a relationship between a part or the whole of the cited document and a part or the whole of the citing document (Malin, 1968). The major area of bibliometric research widely uses various methods of citation analysis to understand these relationships. Nanotechnology, considered as the fundamental technology in NIBC convergence, is expected to have far-reaching influences as the driver of a new wave of technologybased business growth (Uldrich 2003). Thus, a variety of studies have been conducted to identify the relationship among nonotechnology-related social science (Bassecoulard, Lelu, and Zitt, 2007; Huang et al, 2005). Shapira, Youtie, and Porter (2010) observe that there is a strong development and integration of social sciences around some emerging technology areas including nanotechnology, and visualizes the relationship of cited to citing articles aggregated to Thomson Reuters’ ISI journal subject category level.
Third, the convergence phenomenon may be represented by the overall degree of diversity. The convergence phenomenon has happened by solving problems associated with human need. If a problem cannot be solved with the existing technology, the technology people started to seek for different technologies. This process of converging technologies implies that different technologies are utilized to solve problems. Thus, the concept of diversification was suggested to measure the process of technology convergence. In particular, this approach was inspired by professor Stirling from the Science and Technology Policy Research (SPRU) at University of Sussex, UK and his colleagues. Stirling (2007) criticized the issue that the classic indices of diversity such as the Shannon and Simpson index contain and suggested that diversity should be inevitably considered in the combination of two basic properties –variety and balance. Some scholars have started to employ his model (Benhamou and Peltier 2010; Soós and Kampis, 2010; Lee et al., 2012). The recent study of Lee et al. (2012) found that energy-related fields show the high growth rate in both Korea and the world. However, microbiology, molecular biology, and medical-related fields possess the highest positions in the world, meanwhile; computational mathematics, geochemistry, and veterinary-related fields rank high in Korea.
Finally, the convergence phenomenon may be explained in the combination of diversity and coherence. After the diversity index of Stirling (1998; 2007) was introduced, series of a follow-up research has conducted by his colleagues to elaborate its applicability (Rafols and Meyer, 2010; Rafols, Porter and Leydesdorff, 2010; Leydesdorff and Rafols 2011; Rafols et al, 2012). In Rosenberg’s conception (1963), technology convergence is seen as a process involving invention and diffusion that caused to restructure the economy. This insight provides the logical relevance for the concept of convergence as a process. Consequently the concept of technology convergence should be analyzed by not only the degree of diversity and but also an outcome from converging technologies simultaneously. Rafols and Meyer (2010) recognized such dual dimensions and suggested an approach that combines the Stirling’s diversity with concept of coherence to measure the intensity of similarity relations in interdisciplinary research (See Figure 3). However, their proposed indicators fail to reflect the original meaning of coherence that they indicated. The indicator for coherence missed the concept of consistency. In the series collaborated studies, they have continuously emphasized this area on coherence to be further investigated. This will be discussed further in the next subsection.
3. Diversity Index and New Indicator for Coherence
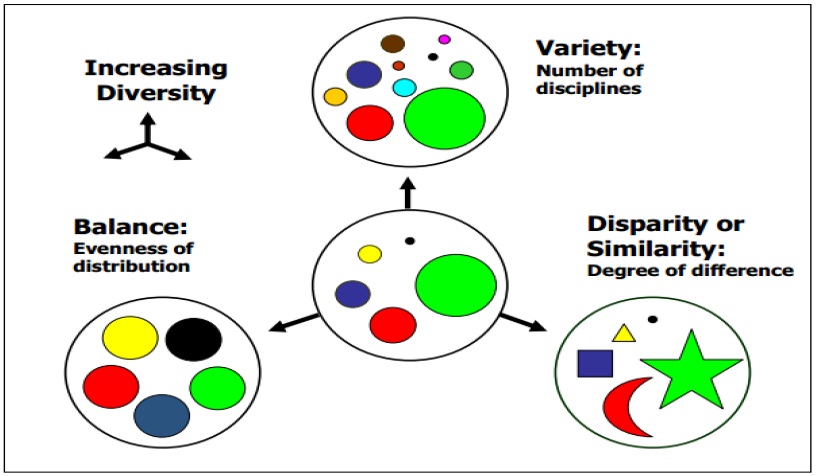
Rafols and Meyer (2010) suggested that the degree of the interdisciplinarity may be investigated in terms of high cognitive heterogeneity (diversity) and increases in rational structure (coherence) simultaneously. In their study, diversity and coherence were defined as “an attribute of any system whose elements may be apportioned into categories (Stirling, 2007, p 708)” and as “the extent to which a system’s elements are consistently articulated and form a meaningful constellation (Stirling indicated in Rafols, 2010, p. 265)”, respectively. The measurement tool for diversity was adapted from Stirling’s diversity index (2007). Stirling (1998, 2007) intensively reviewed on the characteristics of diversity and provided an overcharging index to measure the diversity by adopting the perspective of ecology. In his study, the three subordinate properties of diversity are termed as “variety”, “balance” and “disparity” is defined as the follows:
- Variety: the number of categories into which the quantity in question can be partitioned
- Balance: the pattern in the apportionment of that quantity across the relevant categories
- Disparity: the degree to which the categories themselves are different from each other
The relationships between the properties described above are shown schematically in Figure 4. If each of the subordinate properties of diversity is inclined toward a direction, it implies that the degree of diversity is low. On the other hand, high degree of diversity is expressed by all of the properties located far away from the center.
[Table 1] Necessity of development for coherence
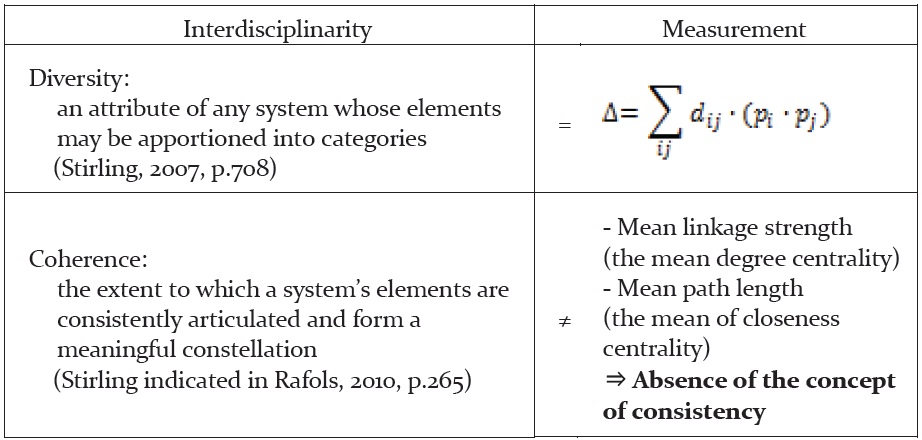
Necessity of development for coherence
On the other hand, mean linkage strength and mean path length extracted from the mean degree centrality and the mean of closeness centrality respectively were suggested to measure the level of coherence. The proposed measurement for coherence fails to reflect the definition of coherence that they defined. The main reason is that the measurement for coherence did not contain the concept of consistency of time (See Table 1).
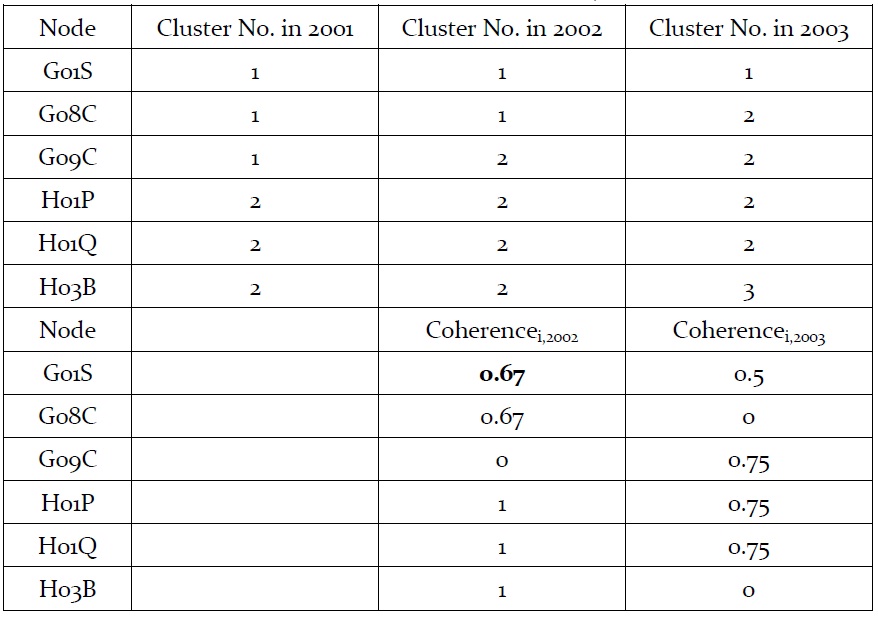
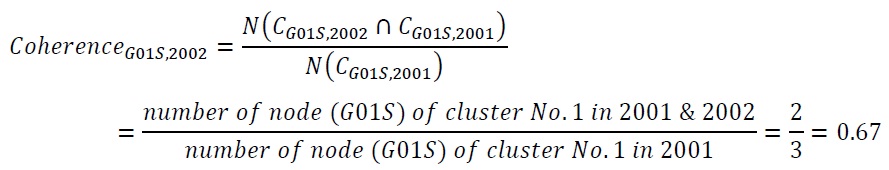
In order to capture the concept of coherence for this study, first we built an absorbed technology field group that stemmed from the activities to solve any kinds of problem through searching different technology field; second the degree of relatedness within the group is calculated to express the increasing interactions between heterogeneous technology fields. Newman and Girvan (2004) introduced the modularity cluster method to produce a hierarchy of subdivisions in large networks, from single agglomerate to isolated nodes (i.e., technology field). Thus, this method is used to make technology field groups (clusters) for each year to execute the first step, and then the degree of agglutination among technologies within one group is calculated to express the degree of coherence. It is formulated as follow and an example is described in Table 2:
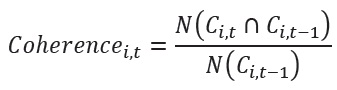
where
[Table 2] Example of coherence G01S, 2002

Example of coherence G01S, 2002
This paper uses patent data as a technological indicator (Fai and Tunzelmann, 2001). For firms that lead a technology convergence, innovative activities are considerably expressed as patents (Mansfield, 1986; Archibugi, 1992). Patents also have a number of advantages which cannot be found in other measures. For one, patents contain detailed information about the year, the country name, citing other patents, and technological categories which allow analyzing the interrelationship between patents. Secondly, patents are suitable for the analyses involving long time-frames (Fai and Tunzelmann, 2001). Acs and Audretsch (1989) tested the reliability of patents as a proxy for innovative activity and concluded that they are a fairly good proxy. Patents contain a rich bulk of information that has scientific applications in various fields, ranging from scientometrics and technology studies to business administration and regional economics. Besides a detailed description of the patented product and many of its technological details, patent records provide information about the actor possessing the patents, the people that have been involved into its realization, as well as several citations to previous patents or scientific work. Furthermore, patent records exhibit information on the technology class by means of an IPC (International Patent Classification) - code and the year the patent was applied for and has been granted. Generally, the application year is used in order to date the patent. It might take some years before the granting procedure has been completed. Moreover, the application date is closer to the date of innovation (Ter Wal and Boschma, 2009).
Patent documents are classified in accordance with the International Patent Classification system. The patent classification system represents a searchable collection of patents grouped together according to similarly claimed subject matter. Thus, a vast amount of researchers have employed the system to analyze the technology convergence phenomenon (Curran and Leker, 2011; Verbeek et al., 2002; Dosi, 1982; Karvonenen and Kässi, 2011). In particular, IPC-codes have been recognized as technological fields and have been utilized to measure the degree of technological positions (Debackere, Luwel, and Veugelers, 1999). This study also used IPC codes to track convergent patterns among technology sectors as follows:
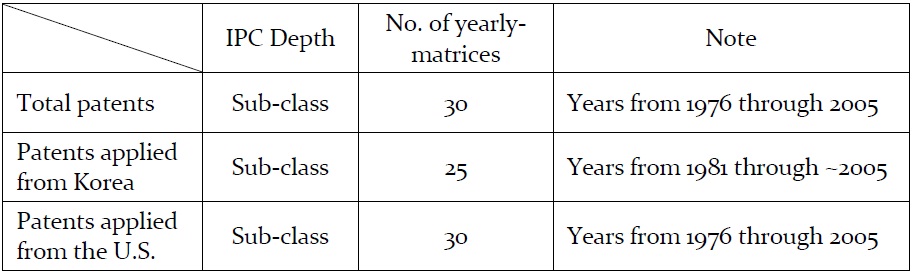
First, the citation matrix is established based on the patents which applied in United States Patent and Trademark Office (USPTO) from 1976 through 2005. The
[Table 3] Total numbers of yearly-matrices by US and Korea

Total numbers of yearly-matrices by US and Korea
From the citation dataset, the six yearly-ices are calculated in terms of subclass (4digits) of IPC. The six yearly-ices are made by a) CitedIPC * CitingIPC, b) CitedIPC * CitingIPC on the basis of the patents applied to Korea, and c) CitedIPC * CitingIPC from the patents applied to the United States. There are a total of 85 matrices, broken down in Table 3.
[Table 4] Technology sectors by IPC codes
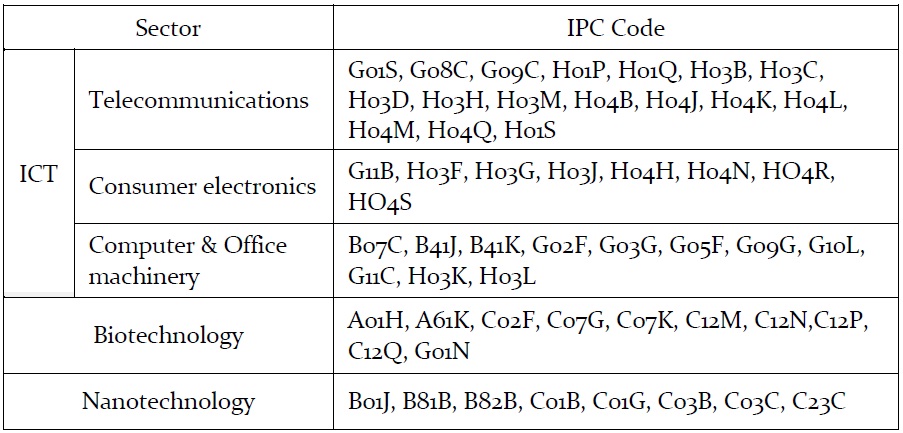
Technology sectors by IPC codes
In our study, major technology convergence phenomena such as ICT and NIBC were the focus. OECD (2000, 2007) provided specific IPC codes for the ICT, the biotechnology, and the nanotechnology sectors based on the selected main IPC codes. It insists that these technology areas based on the IPC codes may provide a relatively good picture of innovative activity in each technology field. The detail content is as follows:
1. Patterns of Convergence Phenomenon
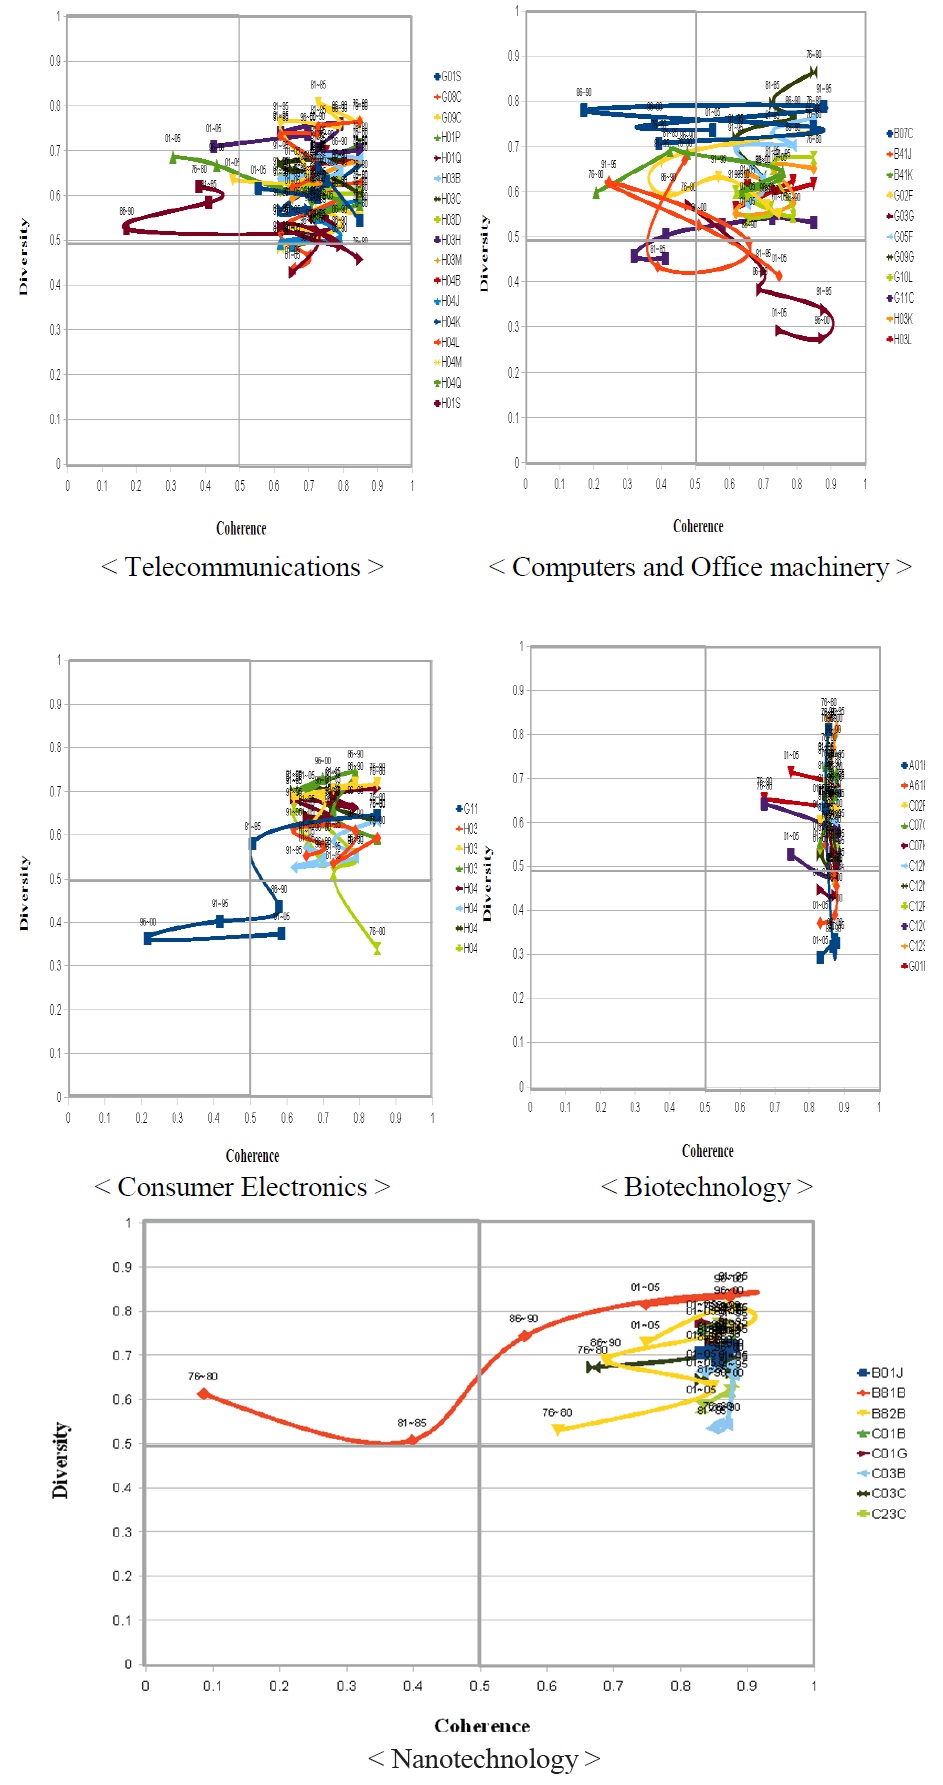
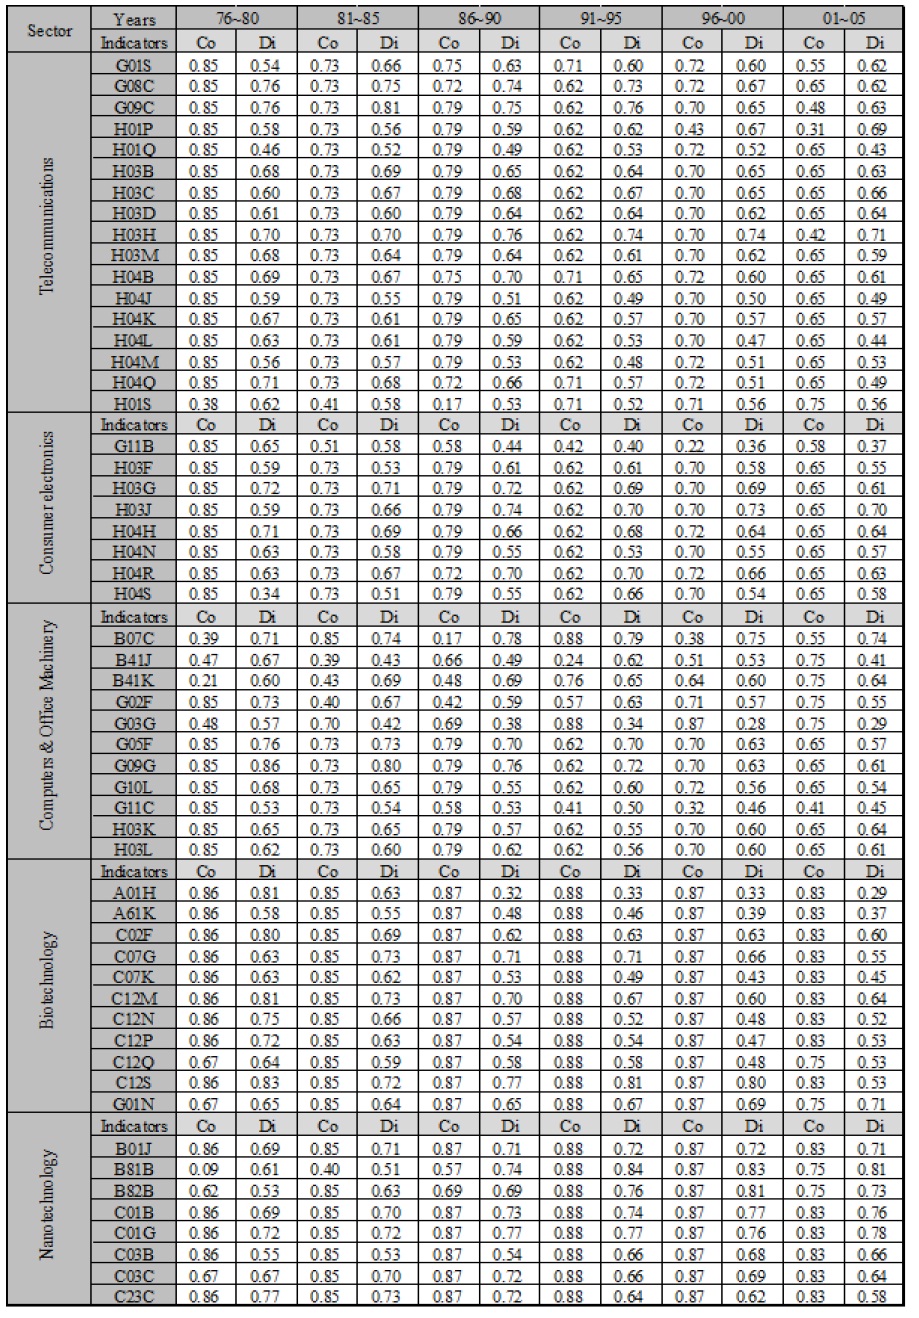
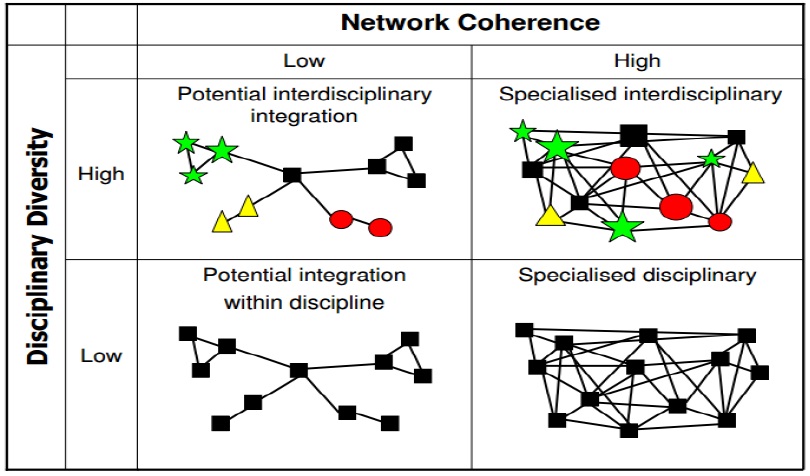
The progress patterns of these technology convergence phenomena will be explained based on the selected IPC codes for each sector. Table 5 shows the score of diversity and coherence for the years from 1975 through 2005 by sectors. The average score for every five year is recalculated to simplify the interpretation and to visualize the patterns of each sectors in Table 3. In Figure 5, the convergence patterns of sub-technology fields that consist of each sector for 30 years are depicted in the 2*2 matrix. Each sector that has led the major convergence phenomenon has continuously progressed by intensively combining other technologies and elaborating the combined technologies. In particular, the biotechnology sector shows that most sub-technology fields have a tendency to improve their technological abilities rather than adapting other technologies. Meanwhile, the convergence patterns of the sub-technology field, B81B (micro-structural devices or systems), in nanotechnology sector shows that it focused on absorbing other technology during the 1976~1985 and then moved toward improving its technological performance during 1986 ~ 2005. In the ICT sector, telecommunication and consumer electronics led the convergence phenomenon since the mid 1970s. However, the convergence pattern of G11B (information storage based on relative movement between record carrier and transducer) in consumer electronics has declined. On the other hand, H01S (devices using stimulated emission) has concentrated on improving its technological performance, rather than adapting other technologies. A similar pattern of H01S appeared in G03G (electrography; electrophotography; magnetography) of computers and office machinery.
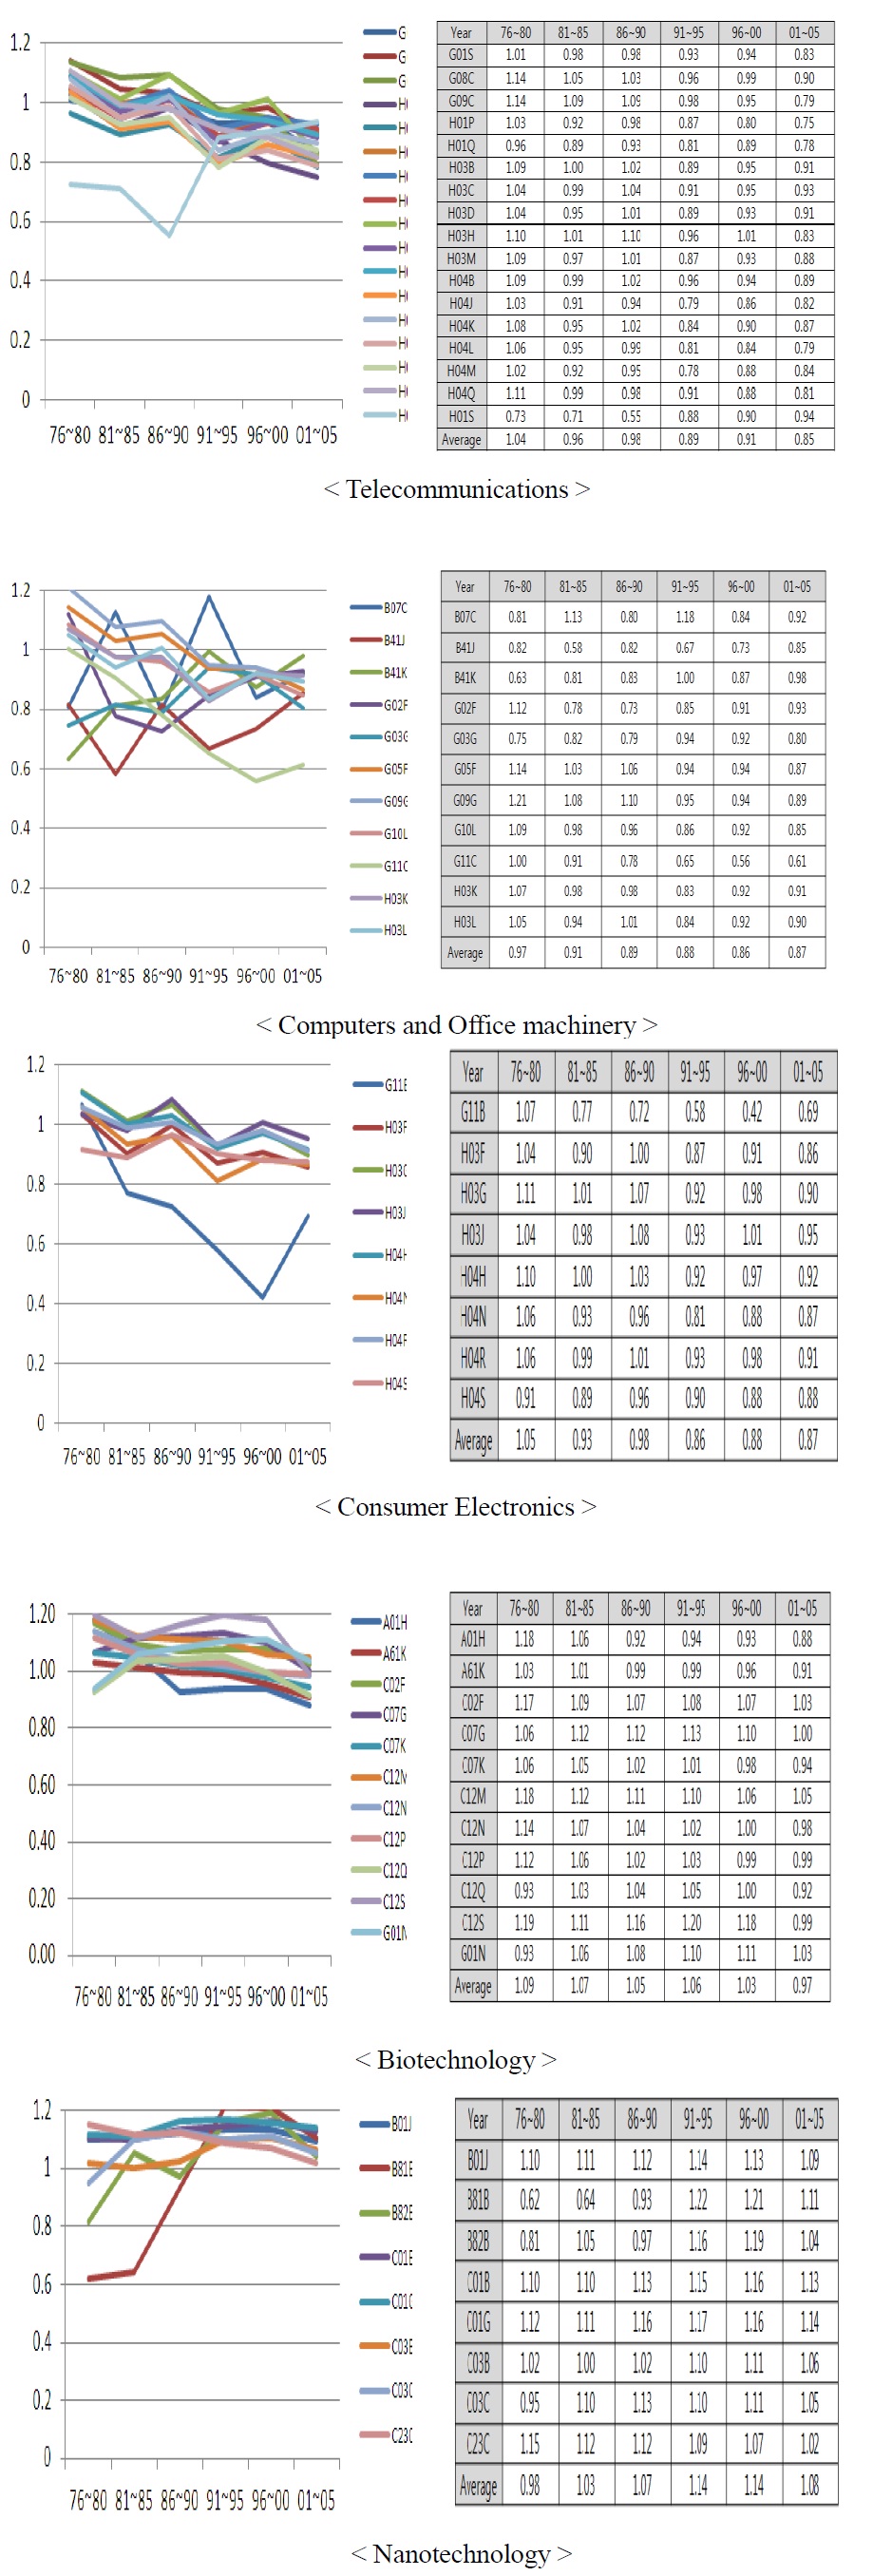
For better understanding about the implication of these results, the values of diversity and coherence have been converted into a single value by using the law of cosines, named as Technology Convergence Index. For each sectors, the result is displayed in Figure 6. Since the degree of the convergence in the ICT sector reached its peak during the late 1970s, the sector has gradually been in a downward trend. In the biotechnology sector, the degree of the technology convergence has continuously proceeded at a high level. Meanwhile, the degree of the technology convergence in the nanotechnology sector has gradually been on an increasing trend. The core technology groups that led to the major technology convergence phenomena have been progressed. Specifically, the ICT sector had intensively interacted during the late 1970s, while biotechnology and nanotechnology has been more concentrated on between the early 1980s and early 1990s, respectively.
[Table 5] Diversity and coherence score for the years (1975~2005) by sectors

Diversity and coherence score for the years (1975~2005) by sectors
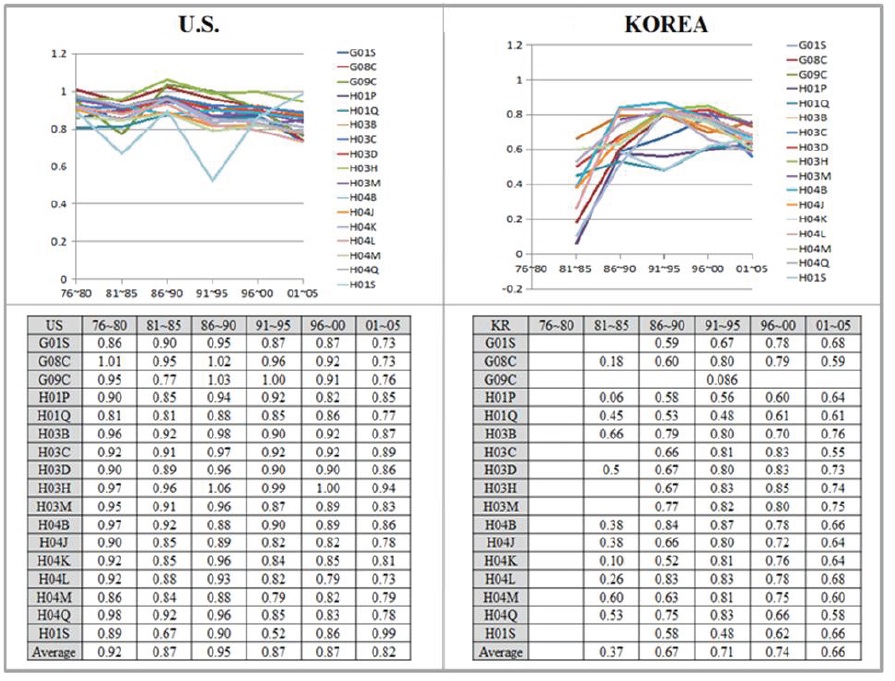
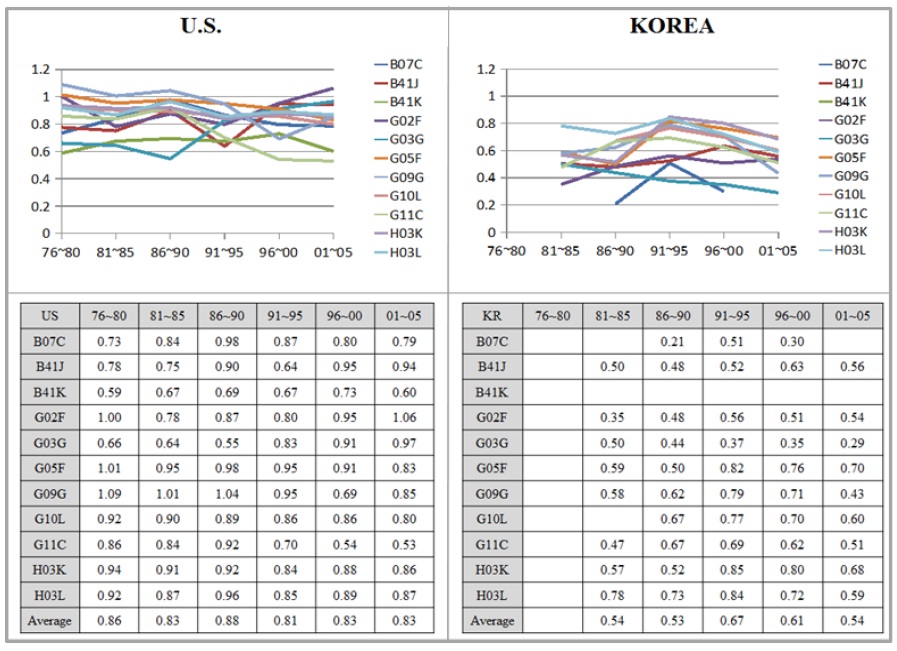
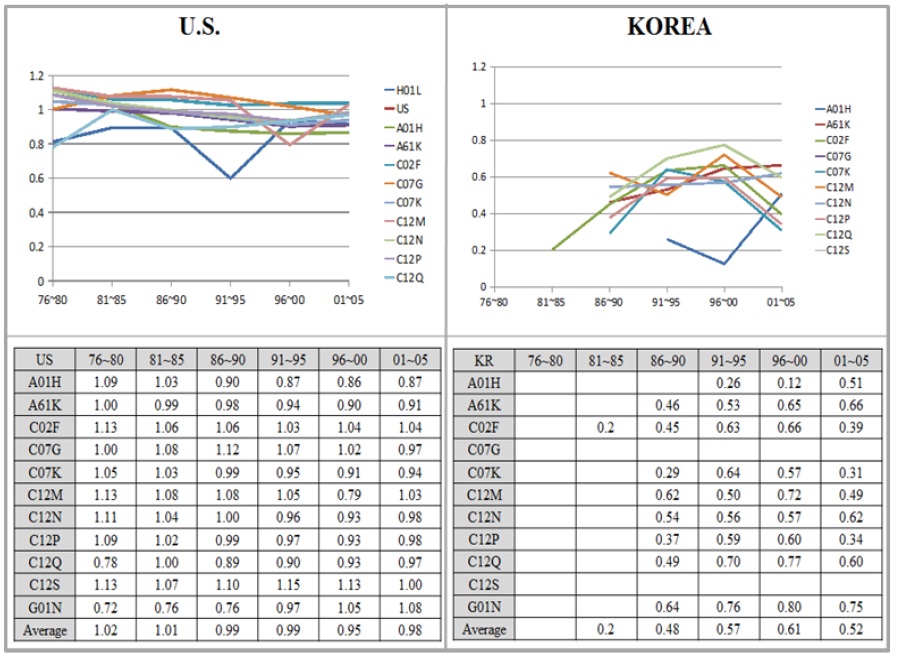
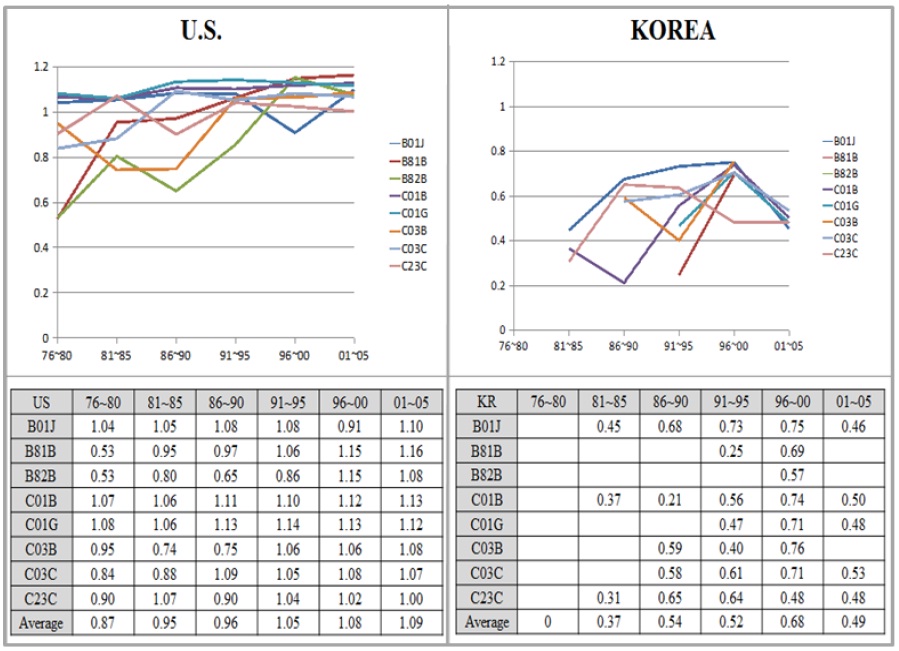
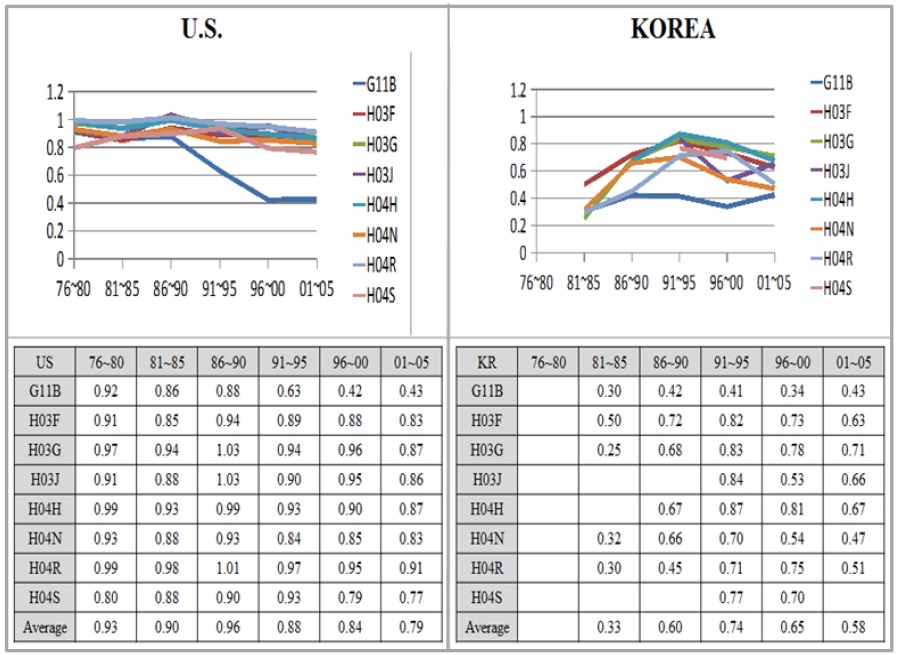
2. Comparison between US and South Korea
The comparison analysis between the U.S and South Korea was conducted to comprehend the difference between the levels of convergence. Generally the U.S. has competitive advantages in terms of the level of the convergence in all core technology sectors during the same time period compared with Korea. However, the technology convergence index of Korea in the ICT sector has improved. In particular, the telecommunications field has relatively gained the competence. For example, HO4L (transmission of digital information, e.g., telegraphic communication) is regarded as a core technology of network field. The convergence activities of Korea have been carried out as much as the United States. Meanwhile, Korea needs to exert their efforts in H04B (transmission), which is the key technology in optical communication and the new generation mobile telecommunication (Nam et al., 2004). Meanwhile, the technology convergence indices of Korea in the biotechnology and nanotechnology field indicate that although the level of the technology convergence of Korea has ameliorated, it lags far behind the U.S. However, Korea has been trying to improve its convergence competence in C12N (micro-organisms or enzymes; compositions thereof) and A61K (preparations for medical, dental, or toilet purposes), which play core roles in the sector. Korea faces the same situation in the biotechnology sector. But the degrees of convergence competence have a greater difference than in biotechnology. In particular, Korea has not gained the convergence competence in core technology field of nanotechnology. For example, B82B (nano-structures formed by manipulation of individual atoms, molecules, or limited collections of atoms or molecules as discrete units; manufacturer or treatment thereof) that contains nano powder materials and nano optical materials is regarded as a vital technology field (Nam et al., 2004). Therefore, it can create a significant economic ripple effect. In this field, the technology convergence index of Korea is less than that of the United States.
The convergence phenomena in such sectors as ICT and NBIC have a significant impact on our daily lives and affect the national competitive advantages. Thus, a vast number of scholars have endeavored to understand the phenomenon. However, previous studies didn’t pay much attention to the inherent characteristics of the convergence phenomenon as a process. A recent series of studies from researchers at the Science and Technology Policy Research: University of Sussex precisely recognized the underlying features of the convergence phenomenon and suggested two indices - diversity and coherence - to capture that phenomenon. However, the index for coherence did not reflect the vital features of the conceptual definition. In this study, we propose a new index for coherence that contains the important two features, an absorbed technology group and its consistent articulation.
The patterns of the convergence phenomenon in the ICT, biotechnology and nanotechnology sector are calculated in terms of diversity and coherence for the years from 1975 through 2005. Although these leading technology sectors have highly and continuously been absorbed into other technologies and consistently improved the absorbed technologies. the degree of the convergence in the ICT sector reached a peak during the late 1970s, and then that of biotechnology and nanotechnology went after in early 1980s and early 1990s respectively. This result is consistent with the historical trends of the technology convergence phenomenon, thereby considerably securing the validity of a measurement as a heuristic index.
Finally, Technology Convergence Index that is made of combining the diversity and coherence in each technology sector indicates the degree of the technological convergence for each country. For policy makers, the index can provide the objective degree of the technology convergence to set up appropriate policies to improve the technological competitive advantage of a nation. In the case of Korean government, less advanced methods relying on some experts’ judgments and patent trend analysis have still employed to evaluate the extent of the technological abilities in the technology convergence fields. Along with these methods, this index can provide more precise indicators not only to track each technology field that consists of a major technology sector, but also to compare them with other leading countries.
Future studies could be conducted for improving its applications. This study focuses on two countries. The limited scope of the objects of the study leads to mull over the analysis results, allowing the comparison analysis in terms of technology fields. However, comparing the values of technology convergence index of major developed countries can provide an opportunity to testify the validity of the new index.