The microstructure, electrical properties, and DC-accelerated aging behavior of the Zn-Pr-Co-Cr-Y-Er (ZPCC-YE) varistors were investigated for different amounts of erbium oxide (Er2O3). The microstructure consisted of zinc oxide grain and an intergranular layer (Pr6O11, Y2O3, and Er2O3-rich phase) as a secondary phase. The increase of Er2O3 amount decreased the average grain size and increased the sintered density. As the Er2O3 amount increased, the breakdown field increased from 5094 V/cm to 6966 V/cm and the nonlinear coefficient increased from 27.8 to 45.1. The ZPCC-YE varistors added with 0.5 to 1.0 mol% Er2O3 are appropriate for high voltage, with high nonlinearity and stability against DC-accelerated aging stress.
Complex electronic systems are vulnerable to damage from transient overvoltage due to weak insulation strength. Progress in the development of faster ICs with higher levels of integration can be accompanied by increased vulnerability [1]. Zinc oxide (ZnO) added with various different metal oxides can be applied to smart semiconducting electronic ceramic devices. Among various ZnO devices, ZnO-based varistor ceramics possess nonlinear properties, which exhibit abruptly increasing current at a critical value in accordance with increasing voltage. They are manufactured by sintering ZnO added with various subordinate oxides, such as Bi2O3, Pr6O11, CoO, Cr2O3, etc. They are monolithic devices consisting of many grains of ZnO, mixed with other materials and compressed into a single form. The nonlinearity of voltage-current properties is attributed to the presence of a double Schottky barrier formed at active grain boundaries that contain many trap states. Highly nonlinear properties enable ZnO ceramics to be used widely in overvoltage protection systems from electronic circuits to electric power systems [2,3].
Recently, Zn-Pr-based varistor ceramics have been studied to further enhance varistor properties and stability against various stresses, such as DC-accelerated aging stress and impulse stress [4-16]. Nahm et al. [7-16]. reported that Zn-Pr-Co-Cr-R oxide (R = Er, Y, Dy, La, Tb)-based varistor ceramics have highly nonlinear properties and high stability against various stresses. These varistor ceramics are limited to 5 components. To develop varistor ceramics for high performance and wide band applications, it is important to understand the effects of the additives on nonlinear properties. No study of the effects of rare earth oxide (erbium oxide, Er2O3) on the electrical properties and stability of Zn-Pr-based varistor ceramics consisting of 6 components has been reported. In the present study, the effect of Er2O3 on the microstructure, electric field-current density (E-J) and stability of the Zn-Pr-Co-Cr-Y-Er (ZPCCE-YE) varistor ceramics was examined.
Reagent-grade raw materials were used in proportions of (97.5-x) mol% ZnO+0.5 mol% Pr6O11+1.0 mol% CoO+0.5 mol% Cr2O3+0.5 mol% Y2O3+x mol% Er2O3 (x = 0.25, 0.5, 1.0). Raw materials were mixed by ball milling with zirconia balls and acetone in a polypropylene bottle for 24 hours. The mixture was dried at 120℃ for 12 hours and calc ined in air at 750℃ for 2 hours. The calcined mixture was pulverized using an agate mortar and pestle, and (after the addition of 2 wt% polyvinyl alcohol binder) was granulated by sieving through a 100-mesh screen to produce the starting powder. The powder was uniaxially pressed into discs of 10 mm in diameter and 2 mm in thickness at a pressure of 80 MPa. The discs were sintered for 1 hour at 1335℃ and furnace-cooled to room temperature. The heating and cooling rates were 4℃/min. The sintered samples were lapped and polished to 1.0 mm thickness. The final samples were about 8 mm in diameter and 1.0 mm in thickness. Silver paste was coated on both faces of the samples, and the silver electrodes were formed by heating it at 600℃ for 10 min. The electrodes were 5 mm in diameter.
2.2 Microstructure examination
For microstructure characterization, both surfaces of the samples were lapped and ground with SiC paper and polished with 0.3 ㎛-Al powder to a mirror-like surface. The polished samples were thermally etched at 1100℃ for 30 min. The surface microstructure was examined by a scanning electron microscope (SEM, Hitachi S2400, Chiyoda-Ku, Tokyo, Japan). The average grain size (d) was determined by the lineal intercept method, given by d = 1.56L/MN, where L is the random line length on the micrograph, M is the magnification of the micrograph, and N is the number of grain boundaries intercepted by the lines [17]. The compositional analysis of the selected areas was determined by an energy dispersion X-ray spectroscope (EDS) attached to the SEM unit. The crystalline phases were identified by an X-ray diffractometer (XRD, Rigaku D/max 2100, Shibuya-Ku, Tokyo, Japan) using a CuKa radiation. The sintered density (ρ) was measured using a density determination kit (238490) attached to a balance (Mettler Toledo AG 245, Mettler Toledo International Inc., Greifensee, Switzerland).
The electric field-current density (E-J) characteristics were measured using a high voltage source-measure unit (Keithley 237, Keithley Instruments Inc., Cleveland, OH, USA). The breakdown field (E1mA/cm2) was measured at 1.0 mA/cm2, and the leakage current density (JL) was measured at 0.8 E1 mA/cm2. In addition, the nonlinear coefficient(α) is defined by the empirical law, J = CㆍEα , where J is the current density, E is the applied electric field, and C is a constant. α was determined in the current density range of 1.0 mA/cm2 to 10 mA/cm2, where α = 1/(logE2-logE1), and E1 and E2 are the electric fields corresponding to 1.0mA/cm2 and 10 mA/cm2, respectively.
2.4 DC-accelerated aging stress test
The DC-accelerated aging stress test was performed under four continuous conditions: 0.85 E1mA /115℃/24 h in the first stress, 0.90 E1mA /120℃/24 h in the second stress, and 0.95 E1mA /125℃/24 h in the third stress. The leakage current was monitored at intervals of 1 min during stressing using a high voltage sourcemeasure unit (Keithley 237). The degradation rate coefficient (KT) was calculated from the expression IL = ILo + KT t1/2 [18], where IL is the leakage current at stress time (t), and ILo is IL at t = 0. After the respective stresses, the E–J chara–cteristics were measured at room temperature.
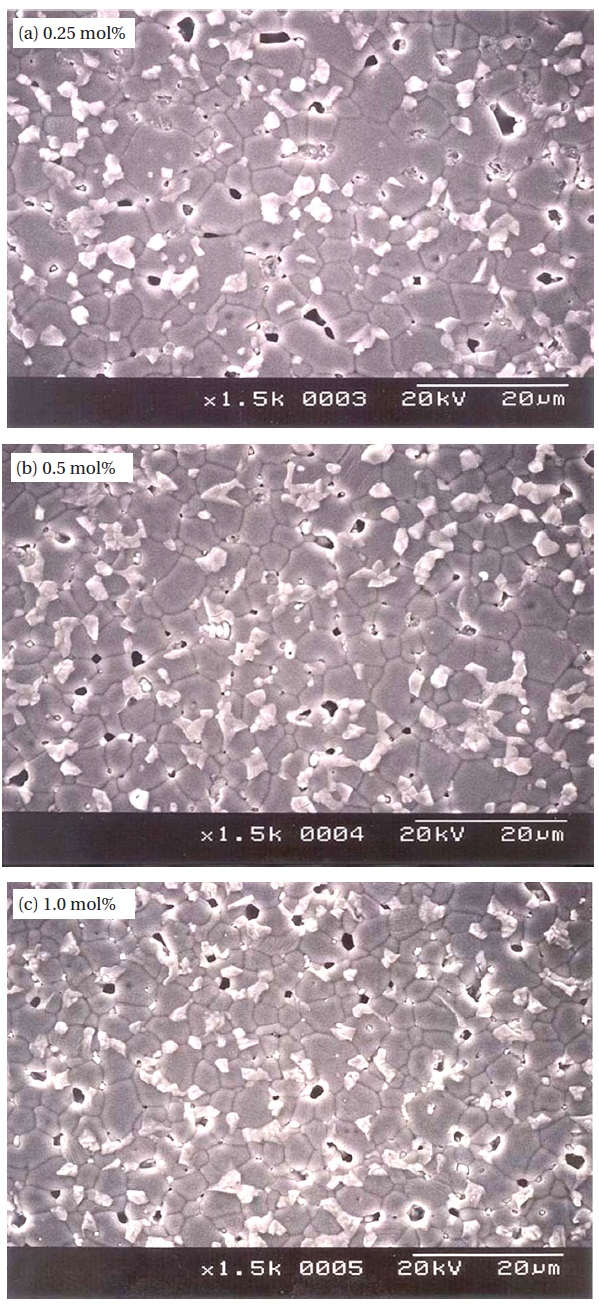
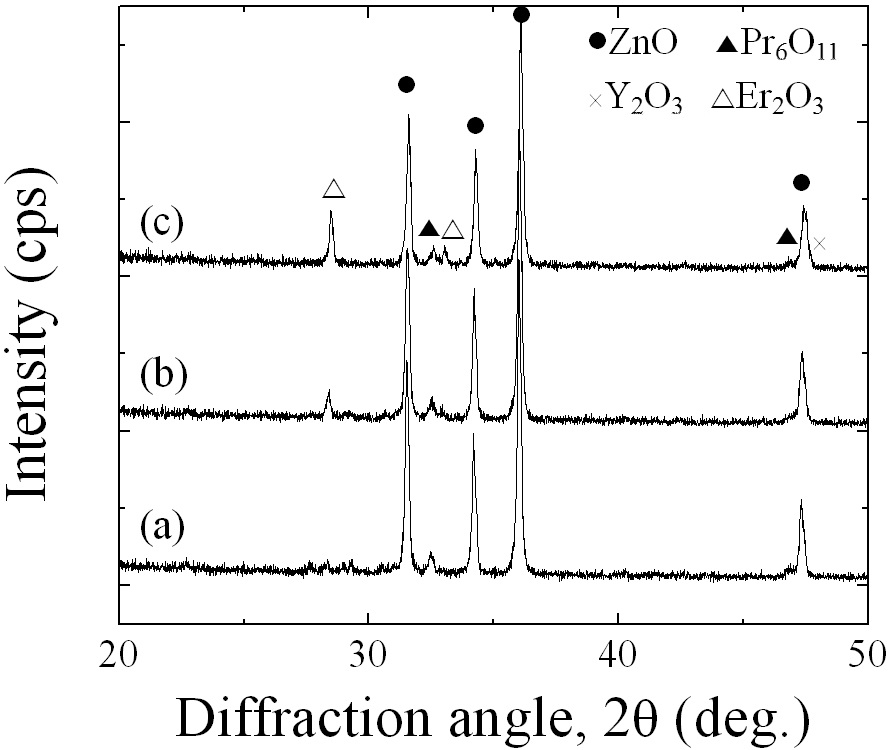
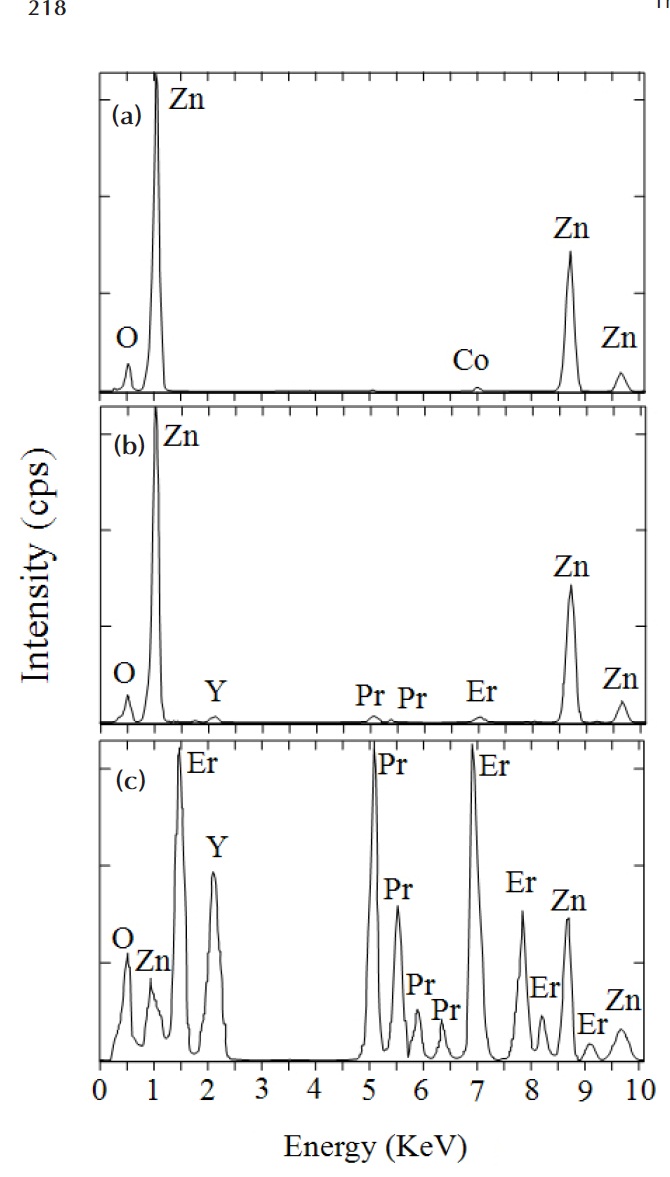
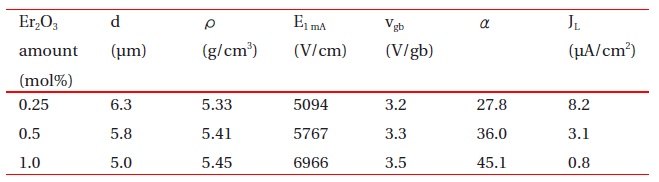
Figure 1 shows SEM micrographs of the samples added with different amounts of Er2O3. The microstructure consisted of ZnO grain (black) as a primary phase and an intergranular layer (white) as a secondary phase. The XRD patterns indicated in Fig. 2 confirmed that the secondary phases were Pr6O11, Y2O3, and Er2O3-rich phases. The EDS spectra in Fig. 3 shows that the Pr6O11, Y2O3, and Er2O3 are segregated at grain boundaries and nodal points due to an ionic radius difference for Zn, and coexist in the grain boundaries and the nodal points as if they were a single phase. The sintered density (��) increased from 5.33 g/cm3 to 5.45 g/cm3 (5.78g/cm3 in pure ZnO) with the increase of Er2O3 amount. The average grain size (d) decreased from 6.3 ㎛ to 5.0 ㎛. Therefore, the densification of the samples is enhanced by the addition of Er2O3. The detailed microstructural parameters are summarized in Table 1.
Microstructure and E-J characteristic parameters for the samples added with different amounts of Er2O3.
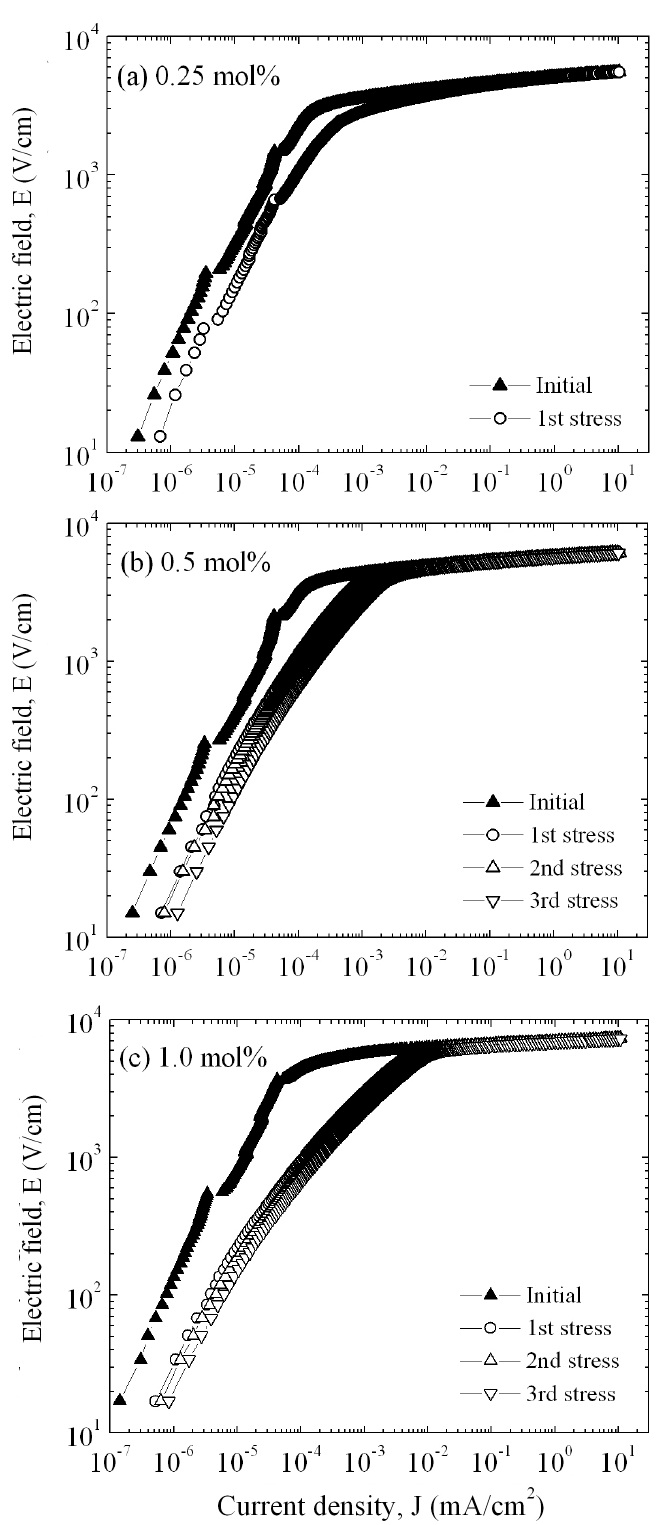
Figure 4 shows the E-J characteristics of the samples added with different amounts of Er2O3 . The curves markedly show that the conduction characteristics divide into a linear region with very high impedance and a nonlinear region with very low impedance. A sharper knee on the curves between the two regions indicates better nonlinear properties. However, the knee states of these curves are not distinguished by the amount of Er2O3 .
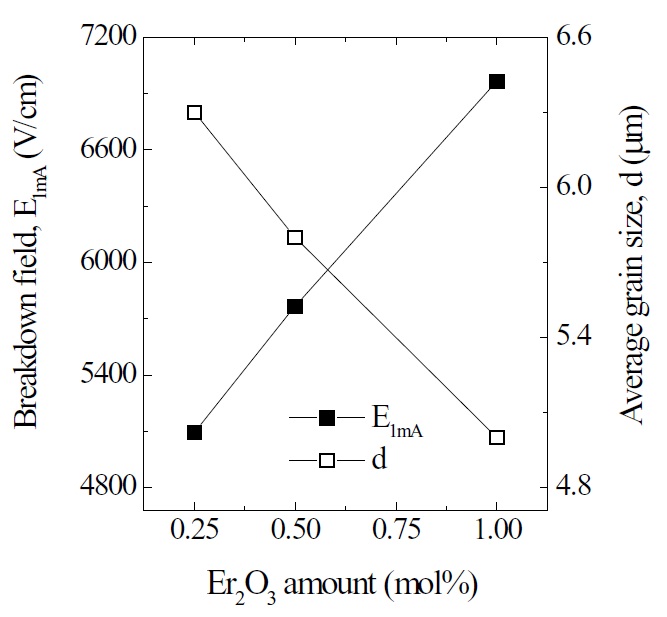
The breakdown field (E1mA ) greatly increased from 5094 V/cm to 6966 V/cm with the increase of Er2O3. The samples provide a high breakdown field per unit thickness. This is very effective for high voltage varistors with a compact size. The increase of E1mA with the increase of Er2O3 amount can be explained by the increase in the number of grain boundaries due to the decrease of average ZnO grain size as follows: E1mA = vgb/d, where vgb is the breakdown voltage per grain boundary, and d is the average grain size. The vgb values of the samples added with Er2O3 were within the normal range of values of 2-4 V/gb. As a result, the E1mA is significantly affected by the average grain size with the increased amount of Er2O3, as indicated in Fig. 5.

E-J characteristic parameters after DC-accelerated aging stress for the samples added with different amounts of Er2O3.
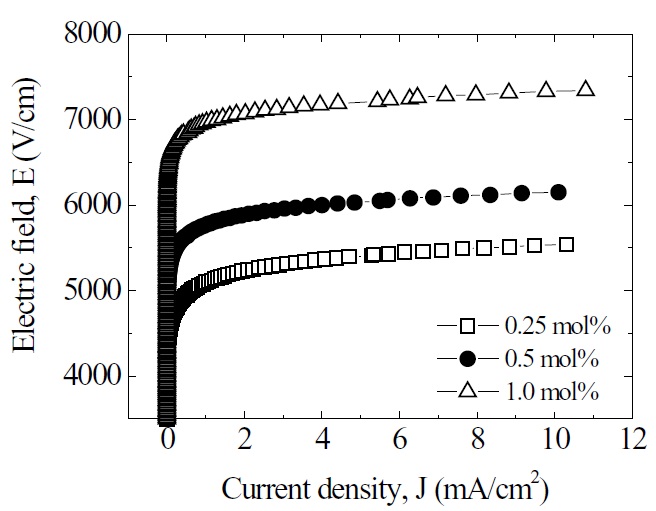
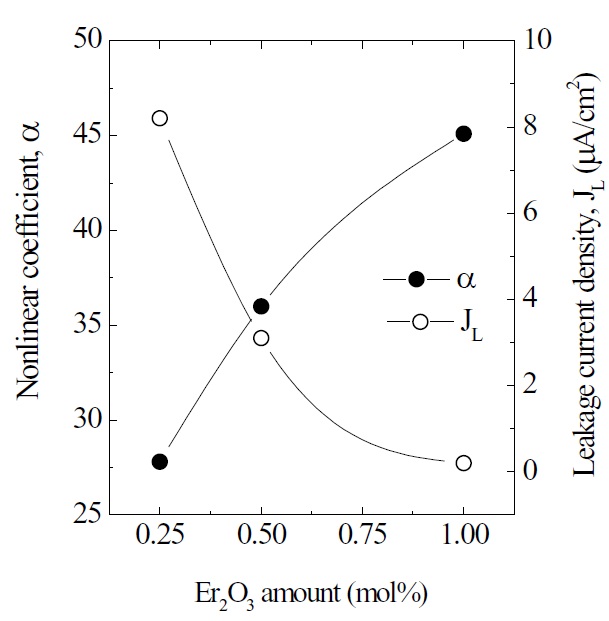
Figure 6 shows the nonlinear coefficient (α) and leakage current density (JL) with the increase of Er2O3 amount. The α of the samples increased remarkably from 27.8 to 45.1 with the increase of Er2O3. The JL decreased remarkably from 8.2 μA/cm2 to 0.8 μA/cm2 with the increase of Er2O3 amount. The variation of JL shows an inverse relationship to the variation of α in accordance with the amount of Er2O3. As a result, it was found that the addition of Er2O3 remarkably improves the E-J characteristics; namely, it increases the nonlinear coefficient and decreases the leakage cur-rent. It is clear that the values of α and JL were strongly affected by the amount of Er2O3.
The electronic and communication equipment and the electrical power systems demand high stability from the varistors in order to enhance their reliability. In practice, the ZnO varistors are always subjected to external stress. The degradation progresses gradually. Therefore, in addition to nonlinearity, the electrical stability is an important characteristic of ZnO varistors [7].
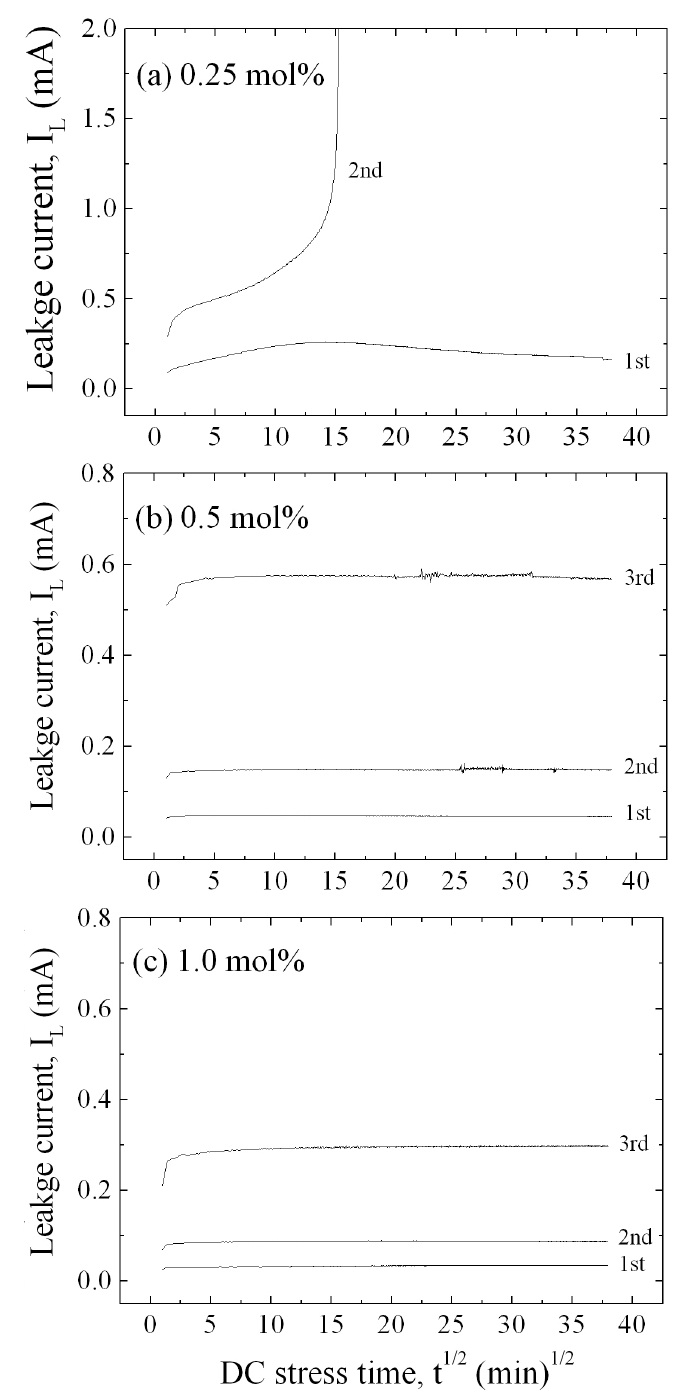
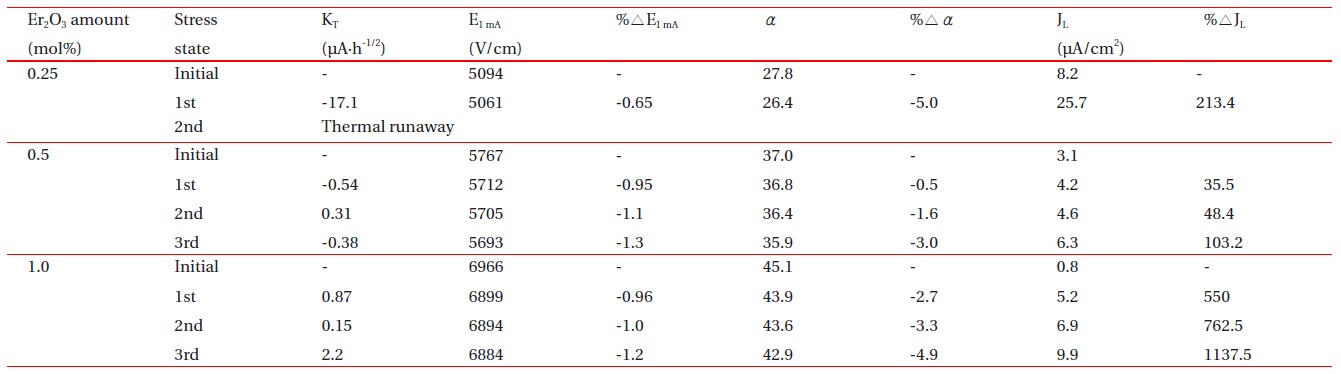
Figure 7 shows the leakage current behavior of the samples during various DC-accelerated aging stresses in accordance with the amount of Er2O3. The samples added with 0.25 mol% Er2O3 exhibited a relatively high stability at the first stress (0.85 E1mA/115℃/24 h). However, they exhibited instability at the second stress (0.90 E1mA/120℃/24 h), which gives rise to a ther-mal runaway. It is assumed that the thermal runaway of the samples added with 0.25 mol% Er2O3 is attributed to a low sin-tered density and high leakage current density. A low sintered density decreases the number of conduction paths, and even-tually leads to the concentration of current. Furthermore, a high leakage current leads to high joule heat loss. On the other hand, the samples added with 0.5 mol% and 1.0 mol% Er2O3 exhibited a much greater stability than the samples added with 0.25 mol% Er2O3. This is attributed to a comparatively high sin-tered density and low leakage current. The stability of the varis-tors can be estimated by the degradation rate coefficient (KT ), which indicates the degree of aging. This exhibits the slope of the leakage current for the stress time. Lower KT values indicate greater stability. The KT of the respective samples at the third stress (0.95 E1mA/125℃/24 h) is -0.38 μAㆍh-1/2 and 2.2 μAㆍh-1/2, respectively. Based on KT , it is presumed that the samples add-ed with 0.5 mol% exhibited a slightly greater stability than the samples added with 1.0 mol%. The experimental facts indicate that the resistance against the DC-accelerated aging stress is greatly affected by the amount of Er2O3.
Figure 8 compares the variation of E-J characteristics after applying the DC-accelerated aging stress with the initial E-J characteristics in accordance with the amount of Er2O3. Among the E-J curves after the stress is applied, those of the linear region moved toward a higher current density. The degree of variation of E-J curves in the linear region is smaller for the samples added with 0.5 mol% Er2O3 than for the samples added with 1.0 mol% Er2O3. Therefore, the variation of E-J characteristics after applying the DC-accelerated aging stress coincided with the variation of the KT value. Table 2 summarizes the E-J characteristic parameters, and the variation rates of the breakdown field (%ΔE1mA), nonlinear coefficient (%Δα), and leakage current (%ΔJL) after applying the DC-accelerated aging stress. The samples added with 0.5 mol% and 1.0 mol% Er2O3 exhibited low characteristic variation of -1.3% and -1.2% in %ΔE1mA, respectively, and -3.0% and -4.9% in %Δα, respectively after the third stress (0.95 E1mA/125℃/24 h). On the con-trary, the %ΔJL exhibited relatively high variation of +103.2% in 0.5 mol% Er2O3 and +1137.5% in 1.0 mol% Er2O3. However, the leakage current density of the sample added with 0.5 mol% Er2O3 was only 6.3 μA/cm 2 after the third stress. On the whole, it is carefully confirmed that the optimal amount of Er2O3 in the ZPCC-YE varistor ceramics may be 0.5 mol%.
The microstructure, electrical properties, and DC-accelerated aging behavior of the Zn-Pr-Co-Cr-Y-Er (ZPCC-YE) varistors were investigated for different amounts of Er2O3. The microstructure consisted of zinc oxide grain and an intergranular phase (Pr6O11, Y2O3, and Er2O3-rich phase) as a secondary phase. As the amount of Er2O3 increased, the breakdown field increased from 5094 V/cm to 6966 V/cm, and the nonlinear coefficient increased from 27.8 to 45.1. The varistors added with Er2O3 greater than 0.5 mol% exhibited high stability by marking less than 10% in the variation rate of the breakdown field and nonlinear coefficient for DC-accelerated aging stress of 0.95 E1mA/125℃/24 h. These varistors could be applied for compact applications of high voltage, because they provide not only a nonlinear coefficient greater than 35, but also a high breakdown field greater than 5000 V/cm.