SiOC films were prepared by capacitively coupled plasma chemical vapor deposition, and the correlation between the binding energy by X-ray photoelectron spectroscopy and Arrhenius equation for ionization energy was studied. The ionization energy decreased with increase of the potential barrier, and then the dielectric constant also decreased. The binding energy decreased with increase of the potential barrier. The dielectric constant and electrical characteristic of SiOC film was obtained by Arrhenius equation. The dielectric constant of SiOC film was decreased by lowering the polarization, which was made from the recombination between opposite polar sites, and the dissociation energy during the deposition. The SiOC film with the lowest dielectric constant had a flat surface, which depended on how carbocations recombined with other broken bonds of precursor molecules, and it became a fine cross-linked structure with low ionization energy, which contributed to decreasing the binding energy by Si 2p, C 1s electron orbital spectra and O 1s electron orbital spectra. The dielectric constant after annealing decreased, owing to the extraction of the H2O group, and lowering of the polarity.
Oxide semiconductors as an high dielectric active layer are attractive for various applications, such as flex display, transparent conducting display and optoelectronic devices [1-5]. Low-k materials are also focused on, because of the limitations of SiO2 insulator in small devices. There are many researches into SiOC films, because it is necessary to develop low dielectric (low-k) constant materials, as alternative to silicon dioxide film. Lowk SiOC film as interlayer dielectric material (ILD) has been used for the gate dielectric materials in FET (field effect transistor) devices, or as an insulator for passivation in solar cells [6-9]. The SiOC film was made by chemical vapor deposition (CVD) and spin on coating deposition (SOD), but there are some differences between the origins of the decreasing dielectric constant. The reduction in dielectric constant in SiOC film by the SOD originates from the pores in the films, or the decrease of polarization. The SiOC film by CVD as low-k material possesses a lower dielectric constant, due to the decreasing polarization. The SiOC film has lighter C and H atoms as opposed to Si and O atoms, and the carbon atom decreases the polarization, due to the interaction between the hydrophilic properties of OH bond in the Si-O network. Moreover, the C-H bond elongation effect also reduces the ionic polarization in SiOC film. The SiOC film produced in the CVD system consists of limited substitution of O atoms by the less polarizable C atoms. During deposition, the SiOC film by plasma system presents many ionic, cation, electronic and neutron sites. These sites are regenerated with the ionic attractive force, and decrease the dielectric constant, according to how the bonding structure is formed. There are hybrid properties, with non-polarity between hydrophilic and hydrophobic properties, in carbon-based system, such as SiOC film [10-12].
The paper studied the correlation between the dielectric properties and binding energy obtained from X-ray Photoelectron Spectroscopy. The chemical shift was researched by XPS analysis, to find the variation of binding energy, in order to understand the bonding structure.
Low-k SiOC films were obtained using the mixed gases of oxygen and bistrimethylsilylmethane (BTMSM) by capactively coupled plasma chemical vapor deposition (CCP-CVD). The films were processed at an annealing temperature of 200~500℃ for 30 minutes, at various BTMSM flow rate ratios. The BTMSM was vaporized, and carried by argon gas at 35℃, with a thermostatic bubbler. The base pressure of the mixture was kept at 3 Torr, and the rf power was 800 W in each experiment. The flow rate of the oxygen was maintained as 50 sccm, and the sample number was the same at the flow rate of bistrimethylsilylmethane (BTMSM) precursor. To prevent the recondensation of BTMSM precursor, the bubble bath and gas delivery lines were heated, and kept at a constant temperature of 35℃. The chemical properties of SiOC film were analyzed by X-ray photoelectron spectroscopy (XPS:ESCALAB 210). The refractive index was measured by Ellipsometer (uvsel/fpd-12, Horiba Jobin Yvon) with a source of 632.8 nm, and the dielectric constant was conventionally estimated from the square of the refractive index.
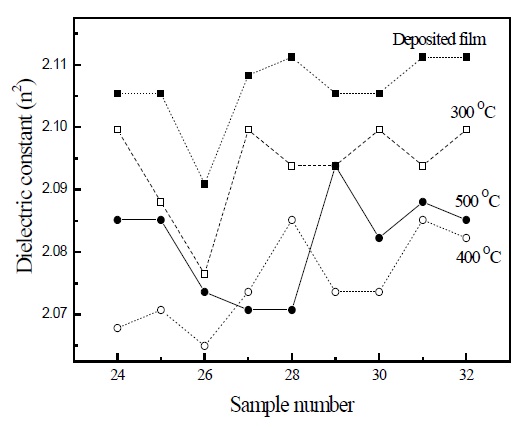
Figure 1 indicates the dielectric constants (n2) of SiOC film with different flow rate ratios. The dielectric constant was conventionally obtained by the square of the refractive index (n). The dielectric constant was the lowest for sample 26 deposited by mixed gases, depending on BTMSM gas of 26 sccm, and oxygen gas of 50 sccm. During deposition, the oxygen mixed BTMSM precursor is dissociated into ions, cations, and sites namely Si- CHn(n= 1,2,3), Si-H, C-H, O-H, Si-C, Si-O and C-O bonds, at rf power 800 W.
These sites recombine with each other, according to the ionic force and electron density between atoms [13,14]. The Si-O-C bond originates from not only the recombination of these dissociated sites, but also from the Si-O-C- segments of the precursor molecule. The polarity of the Si-O-C final materials was the lowest for sample 26, and showed the lowest dielectric constant. The bonding structure was confirmed by the deposition, and the annealing process for the evaporation of OH groups decreased the dielectric constant. These results could be confirmed from the data that the dielectric constant was the lowest for sample 26, after the annealing process from 300~400℃, respectively. However, the dielectric constant of annealed samples at 500℃ showed a different tendency to the others, because of variance of the bonding structure, and because the deficiency of oxygen related bonds after annealing at 500℃ contributed to making the polarization, which was dependent on the electron rich atoms, namely carbon and Si. After annealing at 500℃, the increment of polarization due to the deficiency of electron rich atoms, namely carbon and Si, increased the dielectric constant. However, the dielectric constant decreased with increase of the annealing temperature to 400℃, by lowering the polarity. The electron emission from the localized deep level states in semiconductor band gap by the defects is related to the ionization energy Ei in dielectric materials. The localized trap barrier or deep level is influenced by the ionization energy due to the charge carriers, because the charge carriers in a semiconductor come from the impurities or defects. To understand the defect state in a semiconductor, the Mitrofanov group suggested the Arrhenius plot with the defects in semiconductor GaAs as a high dielectric constant [15]. In the SiOC as low dielectric constant, to understand the correlation between the ionization energy and deep level state of SiOC, the emission (e) and ionization energy (Ei) in the Arrhenius plot by
the Mitrofanov group was changed by the ionization energy (Ei) and potential barrier (ΔΦ). The ionization energy comes from the potential difference, due to the Poole-Frenkel effect as potential barrier. The potential barrier, ΔΦ from the deep levels in the SiOC dielectric band gap is related to the ionization energy Ei, as in equation (1), which maintains a constant density of localized electrons, due to the SiOC dielectric. The ionization energy is proportional to the electron emission.
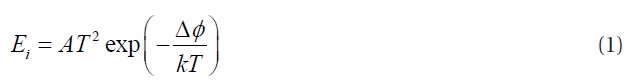
Here, Ei, A, T, k and ΔΦ are the ionization energy, exponential factor, absolute temperature, boltzeman constant and potential barrier, respectively. The potential barrier ΔΦ is inversely proportional to the ionization energy. The potential barrier ΔΦ increased with increasing the annealing temperature, as shown in Fig. 1; and then the ionization energy decreased, by increase of the annealing temperature, because the recombination of electron-holes pairs decreased the ionization energy by thermal ionization energy during the annealing process. High ionization energy is proportional to the emission. Therefore, it is confirmed that the SiOC film can be reformed, as follows in the Arrhenius plot. To research the correlation between the binding energy and dielectric constant, the samples measured the binding energy by XPS analysis.
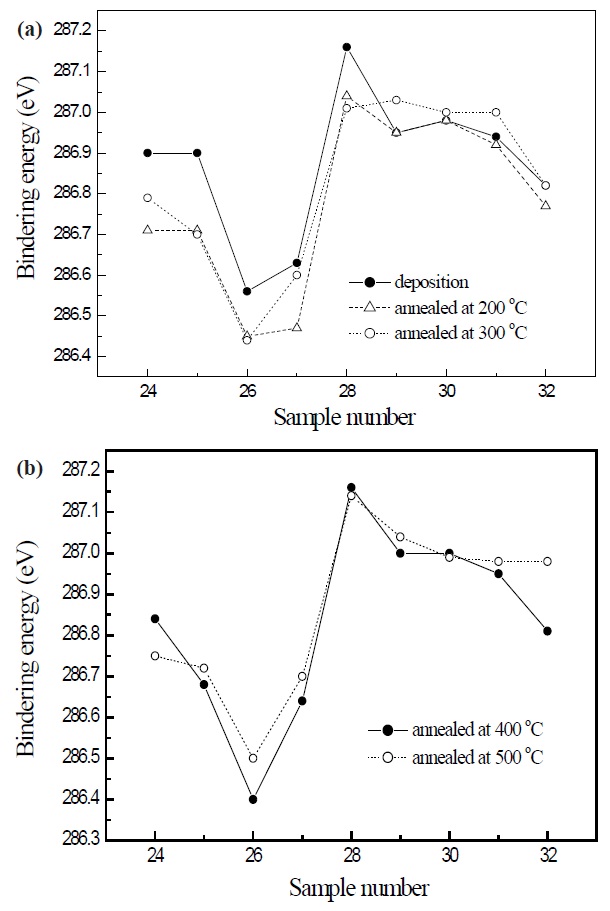
Figure 2 indicates the C 1s electron orbital spectra of SiOC film with various flow rate ratios obtained by the X-ray photoelectron spectroscopy. In the deposited films, sample 26 has the lowest binding energy, and the binding energy decreases, depending on the increase of annealing temperatures from 200 to 400℃. However, the annealed SiOC film at 500℃ increases the binding energy of the C 1s electron orbital spectra, as shown in Fig. 2(b). In the deposited films, sample 26 with the lowest dielectric constant decreased the C 1s electron orbital spectra. After the annealing process, the decreasing trend of the dielectric constant with increasing annealing temperature was the same as the trend in the changes of the C 1s electron orbital spectra. The dielectric constant of SiOC was proportional to the amount of carbon observed by the C 1s electron orbital spectra. The effect of increasing the dielectric constant of sample 26 annealed at 500℃ was also the same as the result, namely increasing the C 1s electron orbital spectra, after annealing at 500℃. The dielectric constant of SiOC film was decreased by lowering the polarization, and the binding energy was also decreased by the reduction of the dielectric constant
in SiOC. The annealing effect of deposited sample 26 is described in Fig. 3.
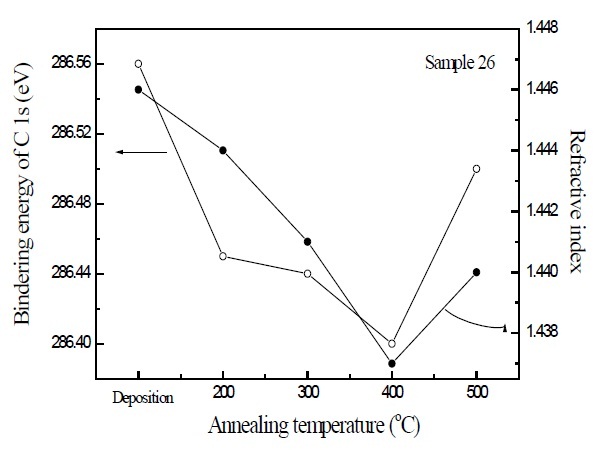
Figure 3 is the correlation between the binding energy of C 1s electron orbital spectra and refractive index of SiOC film 26, depending on the increase of annealing temperatures. The binding energy of C 1s electron orbital spectra decreased with increase of the annealing temperatures at 200~400℃, but increased for the SiOC with the annealing at 500℃. The refractive index was also decreased with increase of the annealing temperatures at 200~400℃, but increased for the SiOC annealed at 500℃. These results indicate that the binding energy of C 1s electron orbital spectra due to the surface energy is related to the refractive index of SiOC film, and the decrease of the surface energy was also influenced by the dielectric properties of SiOC film.
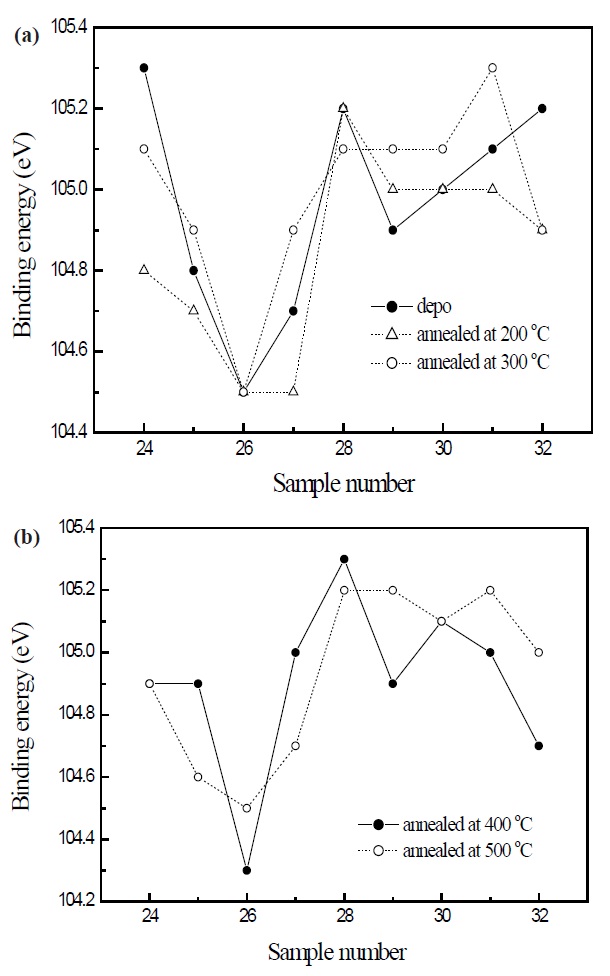
Figure 4 displays the Si 2p electron orbital spectra of the previous SiOC films. The trend of Si 2p electron orbital spectra is similar to the result of the C 1s electron orbital spectra. The lowest binding energy in the C 1s electron orbital spectra was obtained for the annealed SiOC film at 400℃, and the binding energy increased, after annealing at 500℃. When the precursor dissociates and recombines with oxygen, the terminal Si-CH3 bond in precursor is dissociated by the plasma energy and becomes ionic bonds, such as Si-O or C-O bonds. Consequently, too much oxygen extraction by the annealing process at high temperature caused an increase in the polarity of the film. So the Si related bonding strength increased.
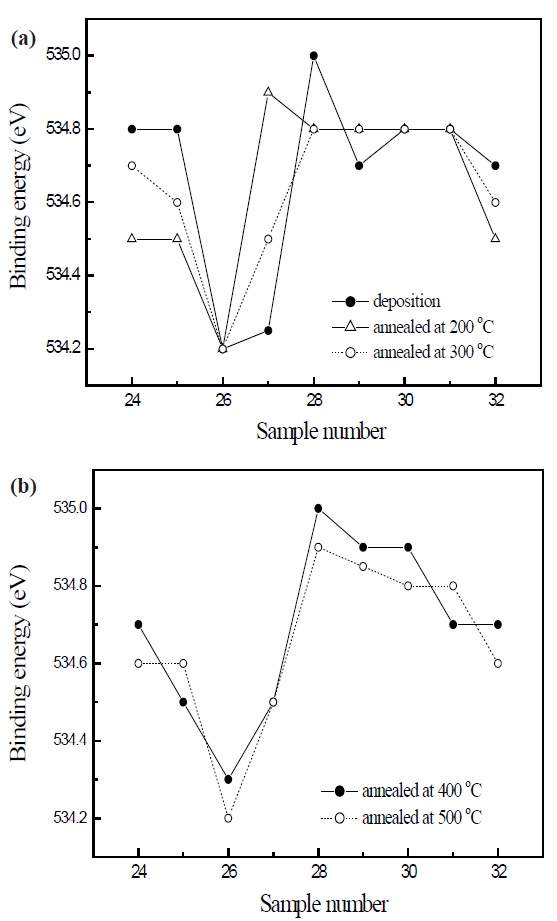
Figure 5 is the O 1s electron orbital spectra of SiOC film with various flow rates. For the deposited SiOC films, the binding energy
of the O 1s electron orbital spectra decreased for sample 26, which was the lowest polarization during deposition. The trend of the O 1s electron orbital spectra was different from the C 1s and Si 2p electron orbital spectra. In view of the O 1s electron orbital spectra in respect to the annealing effect of sample 26, the lowest binding energy was 534.2 eV for the deposited film and annealed films at 200, 300 and 500℃. But the binding energy of
O 1 s spectra at sample 26 annealed at 400℃ increased to 534.3 eV. The sample 26 annealed at 400℃ with the lowest dielectric constant showed lower C 1 s and Si 2p electron orbital spectra, in spite of higher O 1 s electron orbital spectra, as previous mentioned. These results means that the sample 26 annealed at 400℃ has stronger bonding structure than others, because of the elongation effects between atoms and low polarity, in which the high electro negative atom oxygen decreases the electron density around Si and C atoms, and then decreases the surface energy. Moreover, the flatness of the surface due to the low surface energy becomes an enhancement depending on the weak boundary condition, which in turn depends on the elongation effect between the oxygen and the terminal C-H bond. Consequently, it was observed that there was a correlation between the electron binding energy, surface energy, ionization energy, potential barrier, polarity and dielectric constant of SiOC. The increment of potential barriers prevented emission by the electron deficient effect, and the reduction of ionization energy in SiOC. The reduction of dielectric constant in SiOC was due to the weak bonding strength between atoms and low polarity.
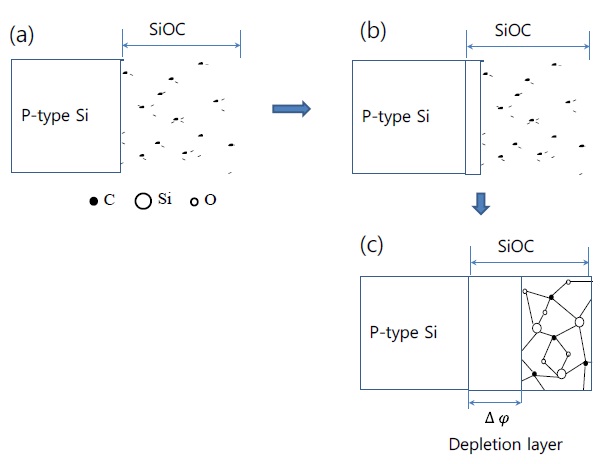
Figure 6 exhibits the variation of bonding structures at an interface between the as deposited SiOC film and Si substrate with increase of the annealing temperatures. The depletion layer as potential barriers is increased at the interface by the increment of the electron-hole recombination with increase of the annealing temperatures, and then from equation (1), the emission and ionization energy is decreased, as previous mentioned. Finally, the SiOC structure becomes more similarly amorphous with
increase of the annealing temperature; moreover, the dielectric constant also decreases.
The SiOC films were prepared at various flow rate ratios of oxygen- mixed BTMSM precursor, and were annealed at 200~500℃ in a vacuum. The dielectric constant was obtained from the square of the refractive index. In the study, the dielectric constant was strongly influenced by the binding energy of the C 1 s, Si 2p and O 1s electron orbital spectra. Sample 26 with the lowest dielectric constant was formed by lowering the polarization, due to the chemical reaction between hydroxyl and alkyl groups, which was induced by the ionic attractive forces and the broken terminal Si-CH3 bond. The lowest dielectric constant was obtained for sample 26. The electron orbital binding energies of C 1s, Si 2p electron orbital spectra and the O 1s electron orbital spectra were reduced, because the weak boundary condition. The lowering of binding energy between individual atoms contributes to improving the bonding strength of the total surface. So the ionization energy and surface energy of SiOC film were decreased. The ionization energy of SiOC decreased, depending on the high potential barriers.