Considering the properties of the carbon nano tubes (CNT), their inclusion into the polymer matrix vastly increases the properties of the resultant composite. However, this is not the case due to the poor interfacial adhesion of the CNT and the polymer matrix. The present approach focuses on increasing the interaction between the polymer matrix and the CNT through the chemical modification of the CNT resulting in allyl ester functionalized carbon nanotubes (ACNT) and silane functionalized carbon nano tubes (SCNT) which are capable of reacting with the polymer matrix during the curing reaction. The addition of ACNT/SCNT into unsaturated polyester resin (UPR) resulted in the improvement of the electrical properties of resulted nanocomposites in comparison to the CNT. The surface resistivity, volume resistivity, dielectric strength, dry arc resistivity, and the comparative tracking index of the nanocomposites were significantly improved in comparison to CNT. The chemical modification of CNT was confirmed via spectroscopy.
Carbon nanotubes with a quasi-one-dimensional structure have unique properties that make them attractive for different engineering application [1-3]. Carbon nano tubes (CNT) have been recognized as an ideal reinforcing agent for high strength polymer nanocomposites, due to their exceptional physical, mechanical & electrical properties, nanometer scale diameter and high aspect ratio [4,5]. The problem is that CNT usually form stabilized bundles due to Van der Waals forces, so it is extremely difficult to align and disperse CNT into the polymer matrix. Good interfacial bonding between the CNT and polymer matrix interface is one of the necessary conditions for improving the mechanical properties of the polymer matrix.
A significant challenge is to introduce individual CNTs to the polymer matrix in order to achieve better dispersion and alignment, which improves the load transfer across the CNT-polymer matrix interface.
For high-performance CNT/polymer nanocomposites, it is clear that the CNT should be homogeneously dispersed in the polymer matrix with strong interfacial interactions to give efficient load transfer from the polymer matrix to the CNT. A higher efficiency of load transfer may be realized by chemical bonding of the polymeric matrix with the functionalized CNT. The solubilization of carbon nanotubes via chemical functionalization is also considered as an effective way to achieve a homogeneous dispersion of carbon nanotubes in polymer matrices [6-12]. In the present paper we report the successful preparation of allyl functionalized multiwall carbon nanotubes (ACNT) and silane functionalized multiwall carbon nanotubes (SCNT), which is confirmed from the infrared spectroscopy data. The effect of chemical modification of CNT on the electrical properties of the resulted nanocomposites was also investigated. The addition of nonmaterial improves the partial discharge, dielectric strength
and the surface degradation properties. These nanocomposites are used in the manufacturing of the insulation for transformers and high tension motors with different voltage ranges. Comparative studies of electrical properties with ACNT/ unsaturated polyester (UPR) and SCNT/ UPR composites were evaluated and were reported in this paper.
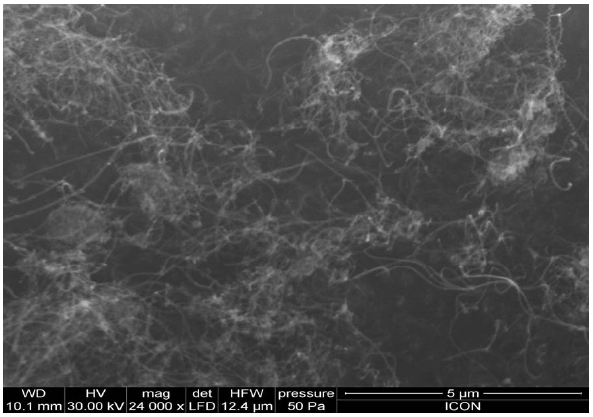
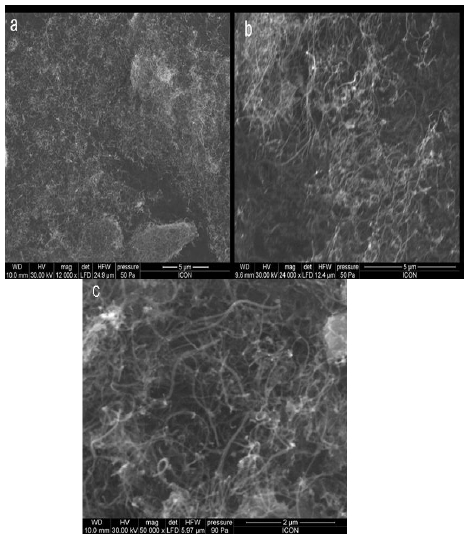
The UPR used in the preparation of UPR-CNT composites was obtained from M/s Naphtha Resins, Bangalore, India. The resin was pre-accelerated with 0.2% of cobalt naphthanate (6% Co content) and it had a solid content of 55%. Styrene was used as the reactive diluent. The acid value of the composition was 14 mg KOH/g resin and it had a viscosity of 330 mPas (@ 25℃ and 50 rpm). The initiator used for the cure of the unsaturated polyester resin was methyl ethyl ketone peroxide (MEKP). This was obtained from M/s Naphtha Resins and was used as such. The CNT used was obtained from Cheaptubes.com and had a purity of 95%, an outer diameter of 10-30nm, a length of 10-30 microns and was used without any further purification. Scanning electron microscope (SEM) image (Fig.1) shows that the CNT entangle with each other.
Thionyl chloride, ethylene chloride, sodium hydroxide, hydrochloric acid, nitric acid, Methacryloxy propyl trimethoxy silane and allyl alcohol were purchased from M/s s.d. Fine chemicals Ltd, India and were of laboratory chemical grade and were used without any further purification.
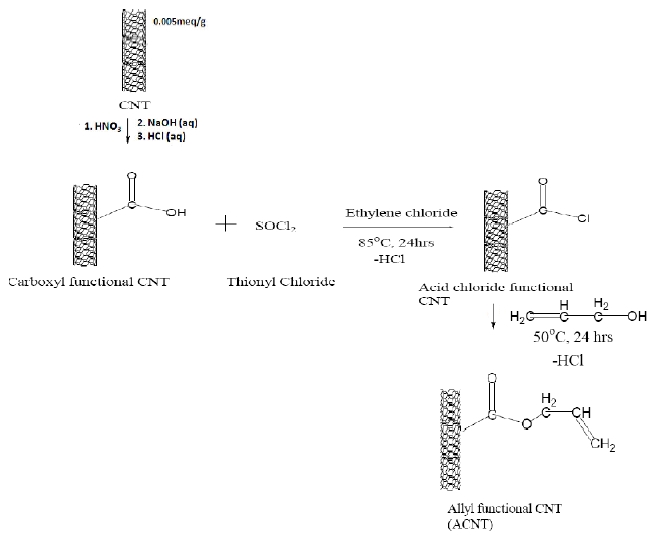
5 gm of CNT after carboxylation were placed in a 250 ml flat bottom flask with 50 ml of ethylene chloride and sonicated for 2 hours to disperse the CNTs in the solvent. 10 ml of thionyl chloride was added to the flat bottom flask and the reaction mixture was stirred with a magnetic stirrer and refluxed for 24 hours. After the chlorination of the CNT was completed the unreacted thionyl chloride and solvent were distilled off and 50 ml allyl alcohol was added to the acid chloride CNT and stirred at 50℃ for 24 hours. Following the esterification of the CNT with allyl chloride, excess allyl chloride was distilled off. The synthesized ACNT were washed with acetone, centrifuged and the residue washed with acetone again. The ACNT was washed three times to remove unreacted chemicals. The ACNT was dried in a vacuum oven at 40℃ for 8 hours. Figure 2 represents the schematic procedure for
the synthesis of ACNT.
2.3 Preparation of ACNT/ UPR composite
The nano-composites were prepared by adding the required amount of nano-particle to the UPR under mechanical agitation. The dispersion was then subjected to ultrasonication coupled with mechanical agitation, using an rpm of 1,500 ± 50, in a temperature controlled bath maintained at 25℃ for a period of 6 hours. Following the dispersion of the nano-materials in the polymer matrix the dispersion was degassed, and the required amount of initiator was added and stirred. The composition was then poured into Teflon and metal moulds and allowed to cure at room temperature i.e. 25 ± 1℃ for 12 hours followed by postcuring at 80 ± 1℃ for four hours. The composites were then allowed to stabilize for 7 days at 25 ± 1℃ and 50% relative humidity before any testing was carried out.
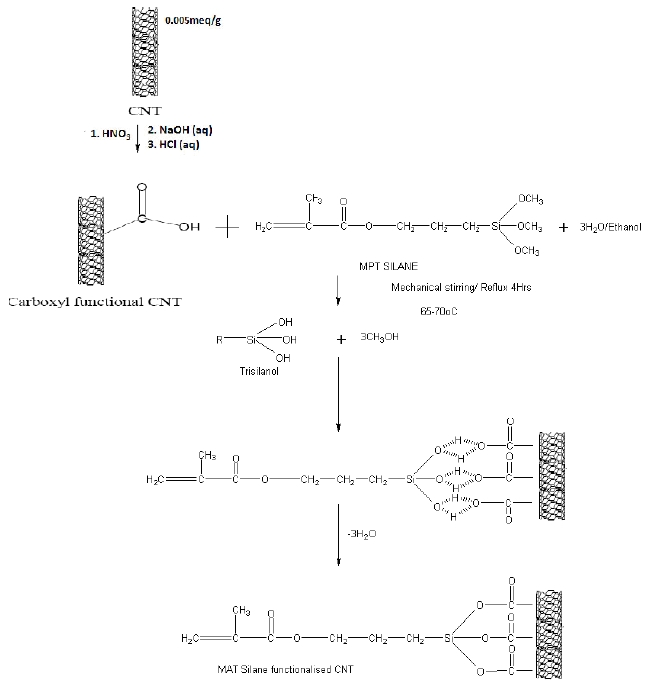
The CNT, after carboxylation, reacted with Methacryloxy propyl trimethoxy silane. First, silane was diluted in ethanol prior to the reaction in order to make alcoholic solution. 50 ml of silane solution was placed in a 250 ml flat bottom flask and in this solution, CNT were added slowly to ensure an even distribution. The amount of used Methacryloxy propyl trimethoxy silane was 1:1 in weight with respect to CNT. The mixture was reflux to 4hr, maintaining the temperature around 65-70℃ under constant stirring and ultrasonication .The SCNT were dried for around 12 hr to allow complete evaporation of ethanol followed by washing with hot water and acetone to eliminate any non-reacted organosilane. Figure 3 represents the schematic procedure for the SCNT synthesis.
2.5 Preparation of SCNT/ UPR composite
The nano-composites were prepared by adding the required amount of nano-particle to the UPR under mechanical agitation. The dispersion was then subjected to ultrasonication coupled with mechanical agitation, using an rpm of 1,500 ± 50, in a temperature controlled bath maintained at 25℃ for a period of 6 hours. Following the dispersion of the nano-materials in the polymer matrix the dispersion was degassed, and the required amount of initiator was added and stirred. The composition was
then poured into Teflon and metal moulds and allowed to cure at room temperature i.e. 25 ± 1℃ for 12 hours followed by postcuring at 80 ± 1℃ for four hours. The composites were then allowed to stabilize for 7 days at 25 ± 1℃ and 50% relative humidity before any testing was carried out.
2.6.1 Spectroscopy & Microscopy
The FTIR spectra were evaluated on a Perkin Elmer 781 spectrophotometer on powder samples from between 400 to 4,000 cm-1. The scanning electron microscopies (SEM) of samples were carried out on a FEI Quanta 200 machine with a tungsten source, working distance of 10 mm and beam intensity of 30 kV.
2.6.2 Surface & volume resistivity
The surface and volume resistivity of the nanocomposites were measured by using an electrometer model 6517 Keithley instrument. This was done according to ASTM D 257-2007. The samples used for evaluation of surface and volume resistivity had dimensions of 100 × 100 × 3 mm. The resistivity was measured at the applied voltage 500 V DC and electrification time was 60 seconds.
2.6.3 Dry arc resistance
Dry arc resistance measurement of the nanocomposites was conducted using the arc resistance IEC model 2 according to ASTM
D 495-1999. The samples used for the evaluation of arc resistance had dimensions of 100 × 100 × 3 mm. The sample was exposed in an arc which was under a high current and low voltage condition. The sample was placed under the electrodes which were spaced at 6.35 mm. An arc is generated between these electrodes. The test consisted of seven cycles.
2.6.4 Dielectric strength
The dielectric strength of the nanocomposites was carried out according to ASTM D 149-2009. The samples used for the determination of dielectric strength had dimensions of 150 × 150 × 3 mm. The electrodes were made up of brass alloys which were in the form of cylindrical shapes. The measurements of the nanocomposites were done with an electrode surrounded by air at 25℃ and 30% RH. During the measurement high voltage was applied to the electrodes. It slowly increased until the dielectric broke down and a sudden increase of current occurred. The effect of breakdown on the dielectric was visually observed after the sample was removed from an opening that was created by a sudden rush of current. The dielectric strength is calculated as the quotient of the measured breakdown voltage and the thickness of the sample dielectric: Ebr = Ubr/d. The measurement was usually repeated 5 times. The final result was calculated as the arithmetic mean value of the 5 measurement results.
2.6.5 Comparative tracking index
The Comparative tracking index (CTI) test specimen is prepared according to the procedure described in IEC 60 112 - 2003. The CTI is used to test the resistance of the tracking solid insulator or part of the insulator in the alkaline environment used in electrical appliances and accessories. Surface failure may arise from flashover or from progressive degradation of the insulating surface by small localized sparks. The rapid break in the leakage current produced an over voltage at the site of discontinuity causing electrical sparks. This spark may be causing carbonization on insulation and finally lead to a carbon track between points at different potentials.
The CTI will indicate the relative behavior of solid electrical insulating material with regards to their susceptibility to surface tracking when exposed, under electric stress, to water and other contaminants from the surrounding area. The test set is especially suitable for synthetic resin molding.
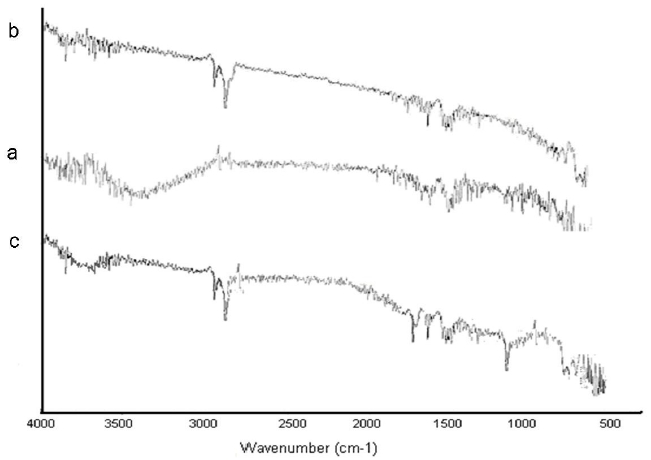
The modification of the CNT to ACNT was confirmed via FTIR spectroscopy. (Fig. 4(a)) shows a broad peak in the region 3,000 to 3,400 cm-1 which indicates the presence of the hydroxyl group
regarding the carboxyl group in the CNT. However, in the case of ACNT (Fig. 4(b)) this peak was not present indicating the complete esterification of the carboxyl group by the allyl alcohol. In both cases, i.e. CNT and ACNT, a peak between 1,740 and 1,760 cm-1 was observed which corresponded to the C=O stretching vibrations of the carboxyl and ester groups in CNT and ACNT, respectively. The FTIR spectra show that the esterification of the CNT was complete. The introduction of an allyl group in the ACNT results in two peaks at 2,800-2,900 cm-1 which is due to the C-H stretching vibrations.
In (Fig. 4(c)) we find results of a successful silanization process; the bands at 794 cm-1 and 919 cm-1 are typical for (Si-OH) and δ (OH) out of plane. These bands appear when trimethoxy groups are broken in order to form silanol groups. The silanol groups provide bands at 2,800-2,900 cm-1
The scanning electron micrographs (SEM) of CNT, ACNT and SCNT can be seen in Fig. 5. From the micrographs it could be seen that the modification of the CNT did not result in the destruction of the nano-particles. As seen in Fig. 5(a), in case of CNT it is highly entangled, lumped, and agglomerated but after modification it is clearly seen that the extent of agglomeration of the nanotube was reduced, less entangled and purified.
3.2 Surface & volume resistivity
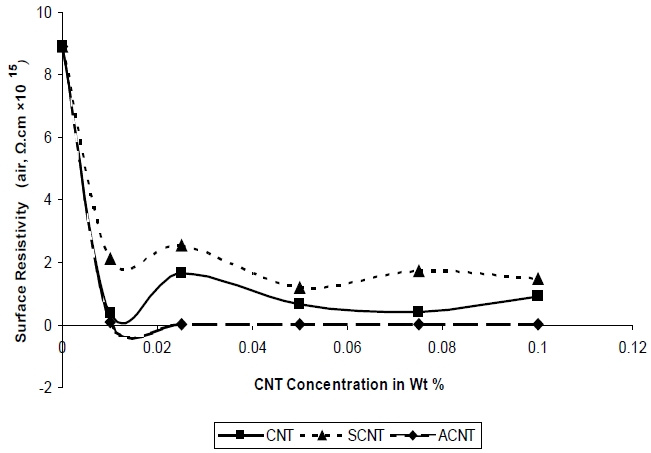
In case of surface resistivity the encapsulated CNT particles have a very little available zone of protection or zone of interaction making them weaker in terms of the breakdown voltages required. Also, in such a situation the breakdown voltage is a strong function of the bilayer thickness and the interaction potential between the CNT and the surfactant. The stress concentration on the bilayer is huge given the fact that the bilayer thickness is much less in the order of micrometers. Once the bilayer breaks free, electrons are generated, which can easily propagate through the surface since with CNT additions an easy path is available increasing the mobility of free electrons on the CNT surface once the encapsulation is broken; hence, the surface re-
sistivity goes down as compared to pure samples. Figure 6 shows the effect of CNT fillers on the surface resistivity of UPR nano composites. Surface resistivity of a material is the electrical resistance to leakage current along the surface of the insulator. Figure 6 demonstrates that the surface resistivity of the nanocomposites decrease as the concentration of SCNT & ACNT increased. It was also observed that the decrease in surface resistivity value in case ACNT based composites was greater as compared to SCNT based nanocomposites, at the same concentration level. The higher surface resistivity value of SCNT composites in comparison to ACNT composites is due to the warping of the non conducting silane on to the surface of CNT making it less conducting; whereas in case of ACNT the conducting double bond helps to decrease the surface resistivity in comparison to the CNT.
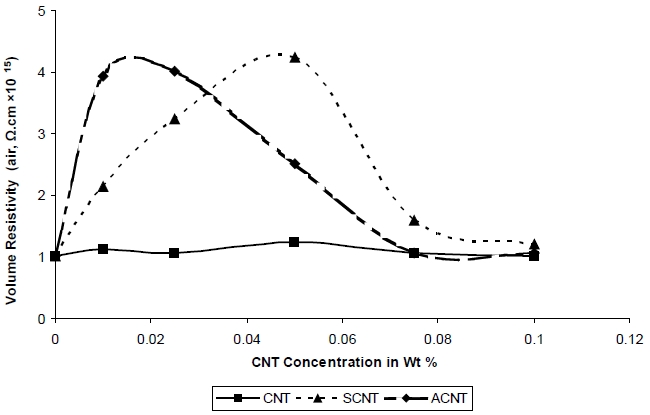
Figure 7 depicts that the volume resistivity of the UPR/CNT nano-composite increases as the concentration of the ACNT& SCNT increases but with further increase in the concentration of the ACNT and SCNT the volume resistivity decreases. The highest volume resistivity 4.25 × 10¹⁵ Ω-cm and 4.02 × 10¹⁵ Ω-cm was achieved when the SCNT and ACNT were incorporated, respectively, into UPR. The reason may be explained as (i) encapsulated CNT added within the polymer matrix reduces the chain mobility at the same time random orientation of CNT within the polymer matrix also restricts availability of free path for free electrons to propagate even if they are generated with the system at very high voltages [13,14].
(ii) The volume resistivity of nanocomposites containing SCNT increased due to the wrapping of non-conductive silane onto the
CNT surface and well-dispersed CNTs. Firstly, the silane molecules with methacrylate end-groups are covalently bonded to the CNT surface, which react with the double bond in UPR, leading to the wrapping of CNT by the UPR. The improved dispersion of CNT in the polymer matrix is known to be detrimental to the formation of electrical networks. The addition of CNT to the UPR did not change the volume resistivity to a large extent, as seen in the above graph whereas the addition of ACNT and SCNT increased the volume resistivity due to the above reason.
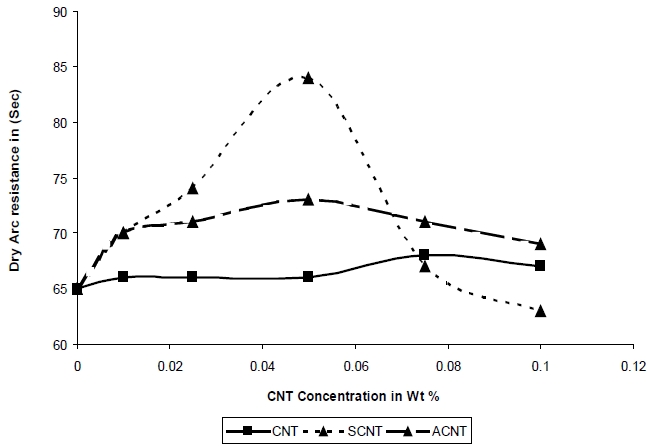
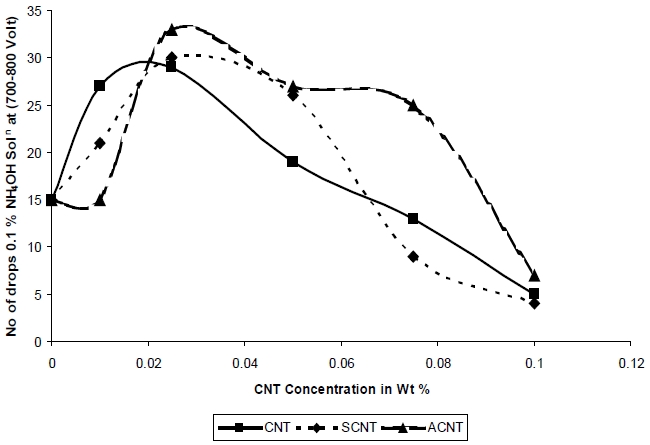
The resistance to high voltage arcing is tested according to ASTM D-495, 1999. In this test, high voltage arc is ignited on the sample surface. Failure is characterized by carbonization of the surface (conductive), tracking, or burning. The result for arcing time is shown in Fig.8. It was observed that for SCNT the highest value is 84 seconds at 0.05 Wt % and for ACNT it is 73 seconds at the same concentration. The arcing time is enhanced with increasing filler content for both unmodified & modified CNTs. For the composites with ACNT & SCNT the arcing time is increased continuously until 0.05% concentration. After that, it decreases such that maximum arcing time is not observed for CNT [14].
The stresses of resistance to high voltage arcing is due to the impact of arc on the sample surface. The material is damaged when sufficient energy is introduced and bonds are broken since the different distances and orientation between polymer chains can change the bond energy contained in the interphase. It is possible that the interphase is more resistant to high voltage arcing than uninfluenced matrix material. The chemical modification of CNT helps in forming a chemical covalent bond between the polymer matrix and the filler which resulted in a large increase in arc resistance and the interphase is more resistant to high voltage of the resultant composites. In case of SCNT composite, the arcing time is high as compared to ACNT. This is because the Si-O bond is more thermally stable than the C-O bond and the energy required to break the Si-O bond is 452 Kj/ mol as compared to the C-O bond, which is 350 Kj/ mol.
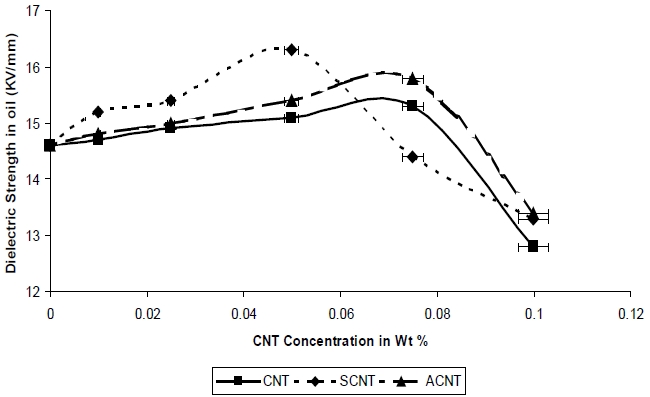
Figure 9 shows the variations in dielectric strength with different concentrations of both modified and unmodified CNT. It is observed that the dielectric strength increases with the addition of SCNT and ACNT. Again, for SCNT the highest value of dielectric strength is 16.3 Kv/mm at 0.05 Wt % and for ACNT it is 15.4
Kv/mm at the same concentration. SCNT shows a larger increase as compared to ACNT. The increase in dielectric strength was observed till 0.05%, after which the strength decreases. The dielectric strength of nanocomposites containing SCNT is greater due to the wrapping of non-conductive silane onto the CNT surface and better-dispersion due to lesser entanglement.
3.5 Comparative tracking index
The CTI test specimen is prepared according to the procedure described in IEC 60 112 (2003). CTI is used to test the resistance of the tracking solid insulator or part of the insulator in the presence of an alkaline environment used in electrical appliances and accessories. Surface failure may arise from flashover or from progressive degradation of the insulating surface by small localized sparks in an alkaline environment. This spark may be causing carbonization on insulation and finally lead to a carbon track between points at different potentials. The carbonization even improves in the alkaline environment. The CTI will indicate the relative behavior of solid electrical insulating material with regards to their susceptibility to surface tracking when exposed, under electric stress, to water and other contaminant from the surrounding area.
Figure 10 shows that the CTI of nanocomposites increases with the addition of nanoparticles, up to a concentration of 0.075%, after which it is decreased. As observed from Fig. 10, the CTI value for the nanocomposites based on SCNT and ACNT are higher in comparison to that of the nanocomposites based on unmodified CNT which is due to the chemical modification of CNT that helps in forming a chemical covalent bond between the polymer matrix and the filler which resulted in a large increase in wet arc resistance and the interphase is more resistant to high voltage of the resultant composites. Both ACNT and SCNT based composites can withstand the spark at higher alkalinity and in the presence of moisture. The SCNT and ACNT based composites again show improved performance as compared to the CNT based composite, due to the enhancement in the interaction between the polymer matrix and the nanoparticle due to the chemical modification.
The addition of CNT, ACNT and SCNT to UPR resulted in composites with increased electrical performance with respect to volume and surface resistivity, comparative tracking index, dielectric strength, and dry arc resistance. In the arc resistance of the composites, the arcing time is enhanced with increasing filler content for both unmodified & modified CNTs. . For the composites with ACNT & SCNT the arcing time is increased continuously until 0.05% concentration. It is seen that the dielectric strength increased through the addition of SCNT & ACNT, with SCNT showing a larger increase as compared to ACNT due to the warping of the non conducting silane on to the CNT surface during modification. The volume resistivity was observed to increase slightly with the addition of SCNT, at lower concentration, which then decreased as concentration of SCNT increased. The addition of both unmodified and modified CNT to UPR did not change the volume resistivity to a large extent. The surface resistivity was seen to be decreased on addition of CNT, SCNT and ACNT. It was also observed that the decrease in surface resistivity value in case ACNT based composites was greater as compared to SCNT and CNT based nanocomposites, at the same concentration level.