Former studies about
on toxicology or pharmacology of cicutoxin (Sarreveld and Hope 1975, Strauß et al. 1996).
Understanding of the genetic structure of vulnerable species is important to formulate sustainable conservation strategy (Ellstrand and Elam 1993, Lee et al. 2004, Kim et al. 2008). Several molecular analysis tools, such as DNA sequencing, random amplification of polymorphic DNA (RAPD), inter simple sequence repeat (ISSR), and amplified fragment length polymorphism (AFLP) has been utilized in ecological studies (Beebee and Graham 2008). To study the genetic difference among three populations, we used the RAPD method that has been used for investigating the genetic diversity and structure of populations and that is independent to the former knowledge of their DNA sequence (Williams et al. 1990, Newbury and Ford-Lloyd 1993, Beebee and Graham 2008). This method has been used for understanding the formation and maintenance of natural plant populations (Bonnin et al. 1996, Min et al. 2012), intraspecific phylogenic studies (Kim et al. 2008, Ok and Yoo 2012), and genetic difference among the varieties or ecotypes (Virk et al. 1995, Ray and Roy 2009, Arghavani et al. 2010).
The aim of this study is to assess the genetic diversity within three
>
Sampling sites and populations description
Only four natural habitats of
>
Seed sampling and germination
At the year of 2012, after the flowering time of each three populations, seeds of the senescent
[Table 1.] Random primer sequences and number of amplified RAPD fragments
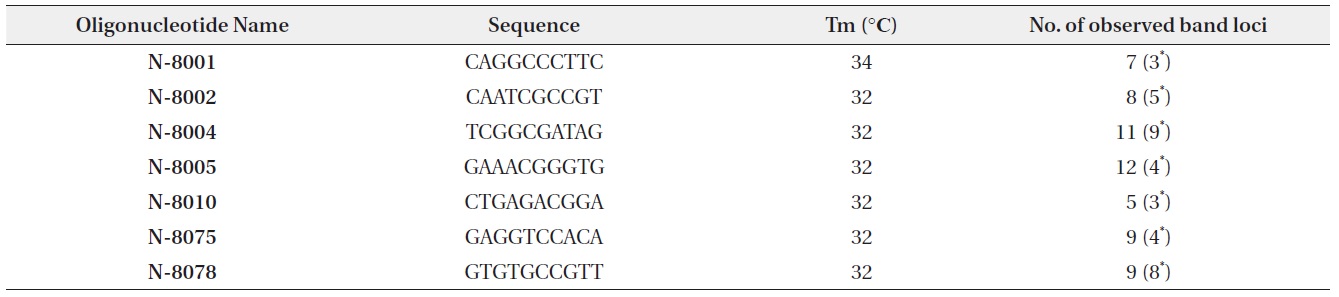
Random primer sequences and number of amplified RAPD fragments
temperature condition was kept in 12 hours interval, light (at 30℃) and dark (at 15℃) for a week.
After about a week from the germination, five seedlings were randomly collected in each of three populations. Each sample size of them was determined in previous studies about the distinction among ecotypes using RAPD markers (Milella et al. 2006, Ray and Roy 2009, Arghavani et al. 2010). Whole genomic DNA extraction was followed with DNeasy Plant Mini Kit (Qiagen, Hilden, Germany) according to manufacturer’s protocol.
PCR for RAPD analysis was conducted with AccuPower PCR premix (Bioneer, Daejeon, South Korea). Total reaction volume of PCR was 20 μL, composed of 1 μL of DNA extracted from each seedling, 1 μL of primer (10 pmol), and 18 μL of deionized water. Seven of 33 random primers (Bioneer) which showed the polymorphism in electrophoresis were selected for RAPD analysis (Table 1). Reaction cycle of PCR began with the 2 min of denaturation at 94℃. 40 cycles were followed with 45 s of denaturation at 94℃, 45 s of annealing at the Tm of each primer, and 1 min 30 s of elongation at 72℃. Lastly, 2 min of the final extension step at 72℃ was followed.
Electrophoresis of amplified fragments was conducted in 1% agarose gel stained with GelRed™ (Biotium, Heyward, CA, USA). Under the UV light, bands were observed and recorded by binary character matrix with 1 (presence) and 0 (absence).
Genetic diversity within the population (number of polymorphic loci, Nei’s gene diversity: h, Shannon index: i), genetic distance (Nei’s genetic distance) among populations and unweighted pair-group method with arithmetic averages (UPGMA) dendrogram were calculated by Popgen32 with the binary matrix data (Yeh and Boyle 1997). Principal component analysis (PCA) with presence and absence of each band was conducted by R ver. 2.15.0 (R Development Core Team 2013).
>
Genetic diversity among individuals of three populations
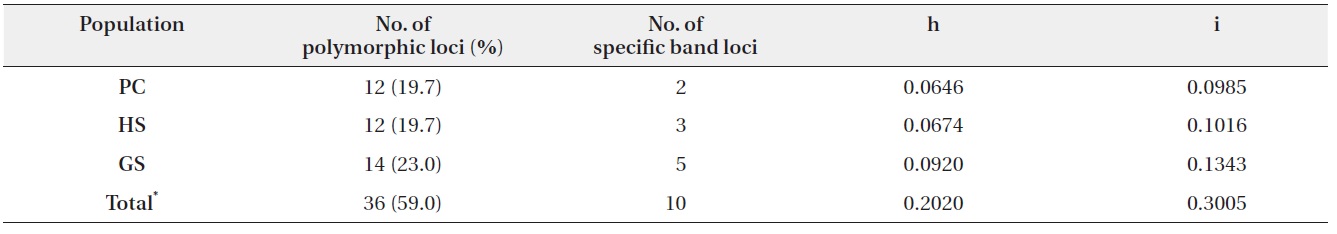
61 band loci were detected from seven random primers and 36 loci (59%) of them were shown to be polymorphic. 10 (28%) of 36 polymorphic loci appeared only one or two populations. DNA sequence of these specific loci could be able to design the population-specific markers (Ray and Roy 2009).
In three populations, average of Nei’s gene diversity (h) was 0.0747, and it of Shannon index (i) was 0.1115. GS was shown to be the highest gene diversity (Table 2).
In GS, the population size of
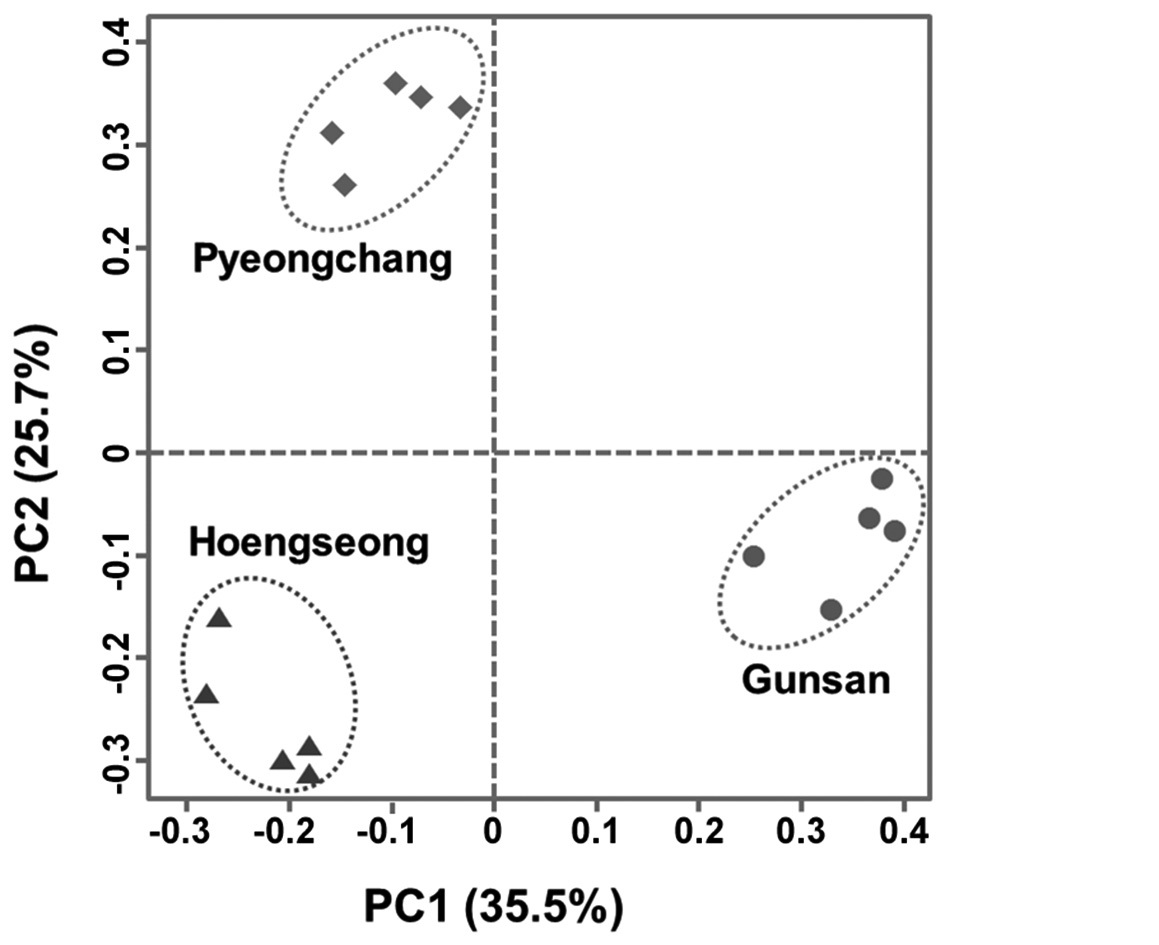
From the result of PCA with band presence and absence of 61 loci, 5 principal components had 83% of total variance and proportion of variance of major 9 principal components was 95%. On the 2D plot of major two principal components (PC1, PC2), three populations were clearly separated and grouped within each population (Fig. 2). This result implies that three populations could be grouped based on the RAPD-PCR results.

Number of polymorphic loci and percentage, Nei’s gene diversity (h), and Shannon index (i) in three populations
>
Genetic distance among three populations
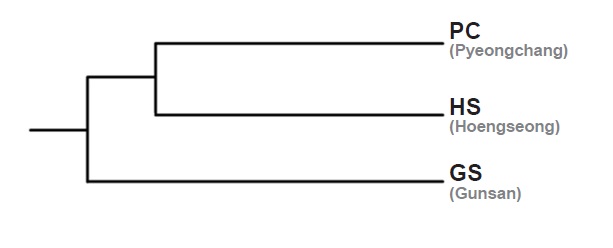
Genetic distance among three populations based on Nei’s genetic distance was the highest between HS and GS (0.2618). The shortest distance was between PC and HS (0.1999), and the distance between PC and GS was 0.2331. GS seems to be genetically apart from PC and HS in the UPGMA dendrogram from the RAPD markers (Fig. 3).
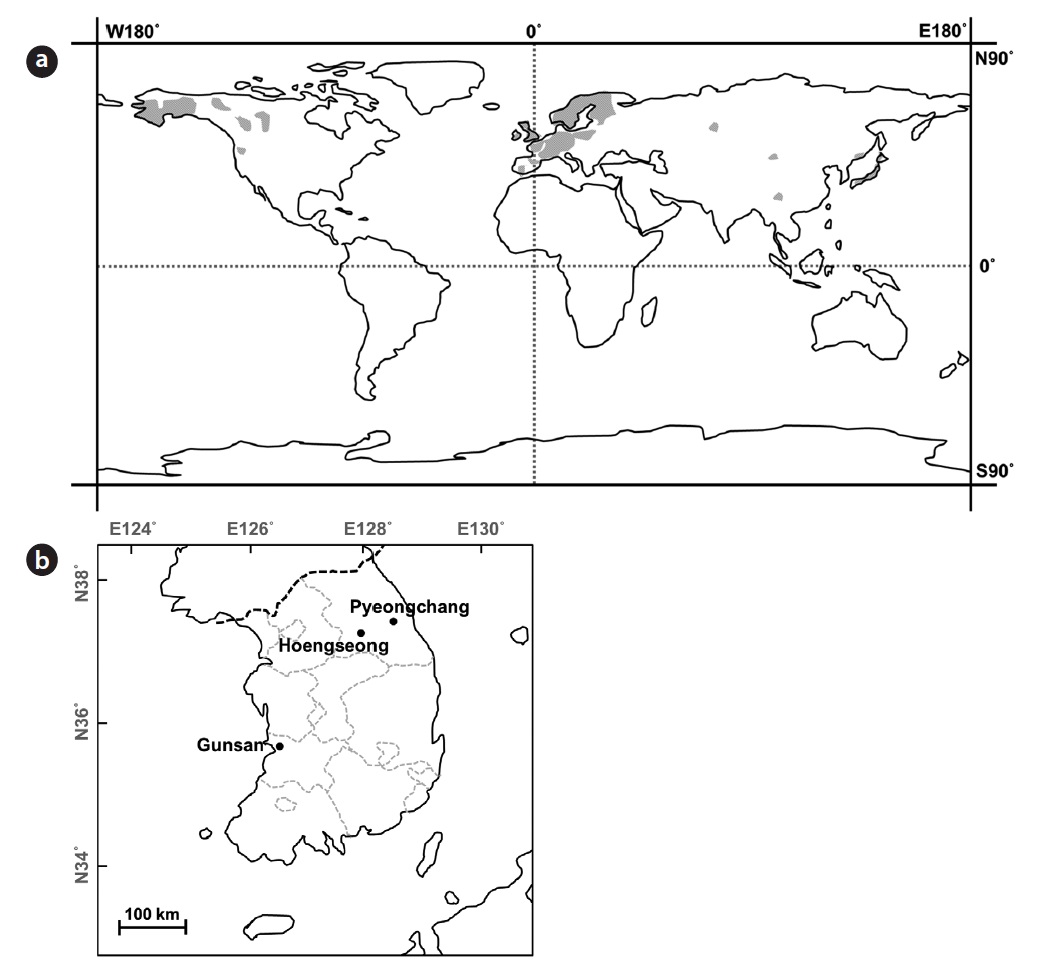
PC and HS are located in Gangwon province, the eastern part of Korean peninsula, whereas GS is located in Jeollabuk province, adjacent to the western sea of Korea and the reservoir is located on relatively lower latitude than PC and HS. Straight-line distances between PC and HS, PC and GS, HS and GS are about 50 km, 261 km and 218 km, respectively. Genetic distance among populations could be increased similar to the increasing of the geographic distance when genetic flow among populations and genetic drift in each population make equilibrium (Hutchinson and Templeton 1999). Based on the genetic and geographic distance among three populations, GS seems they had been separated earlier from the common ancestor than the other two populations.
Ecotypic characteristics such as seed length and weight, flowering time, and sensitivity about the moisture stress were significantly different among three populations (Shin and Kim 2013). However, such as root:shoot (R:S) ratio or relative growth rate (RGR) in length in GS was significantly different from HS and PC, whereas the two populations (HS and PC) were not significantly different from each other. In addition, as a result of a 2D plot of the discriminant analysis, GS was relatively away from HS and PC (Shin and Kim 2013). This result seems to be affected from the genetic distance among three populations.
Based on the RAPD analysis, genetic diversity in each population seems to be affected from their population size and some polymorphic loci appeared only one or two populations. In a result of PCA with the band presence, three populations were separated from each other and grouped within each population on 2D plot. In addition, genetic distance among three populations was associated to their geographic distance and it also corresponds to the Shin and Kim’s study (2013) about the morphological and phenological characteristics. In conclusion, we suggest it is possible to distinguish the