The rosette is a vegetative form of plants that is common in various taxa, generally found in exposed open habitats with sparse vegetation (Teramura and Strain 1979, van Tienderen and van der Thoorn 1991a, 1991b). In a rosette stage, leaves radiating outwards from a short axis are arranged in a circle and are horizontal at ground level. The advantages of being a rosette include the avoidance of grazing, mowing or other physical disturbances (McIntyre and Lavorel 2001, Pakeman 2004), and, in overwintering rosettes, better exposure to sunlight and close contact with the warm ground surface (Regehr and Bazzaz 1976, 1979).
To avoid frequent physical disturbances, rosette plants often remain short during vegetative growth stages. Then, at a reproductive stage, they immediately elongate their stems, or flowering-stalks, to produce flowers and disperse seeds; this switch in developmental stage is known as bolting (Kachi and Hirose 1983, Nordborg and Bergelson 1999). The significant contribution of rosette plants’ flowering-stalks to reproduction makes them functionally unique compared to ordinary stems that function as supporting structures of foliage (Givnish 1988). For example, flowering-stalks of rosette plants are known to function in pollinator attraction (Agren et al. 2006, Vanhoenacker et al. 2006) and seed dispersal (Brock et al. 2005, Hayashi et al. 2010, Vaughn et al. 2011). Compared with the height of the rosette, flowering-stalks often elongate considerably and are likely to require large investments of resources depending on individual inflorescence size. In addition, some of rosette plants can produce multiple floweringstalks that originated from lateral meristems (Hayashi et al. 2010, Vaughn et al. 2011). It is thus important for rosette plants to decide relative investments between height and number of flowering-stalks that maximize fitness.
Cardamine hirsuta L. (Brassicaceae) has three properties suitable to compare phenotypic selection on the height and number of flowering-stalks of rosette plants. First, it shows a life cycle as a winter-green annual; it overwinters forming a rosette and then develops a single to several flowering-stalks in early spring (Yatsu et al. 2003), and its semelparity allows us to evaluate the lifetime reproductive allocation at the end of its life cycle. Second, each flowering-stalk of C. hirsuta has two to three cauline leaves that are considerably smaller than its rosette leaves. This allows us to treat the flowering-stalks of this species as supporting structures of reproductive organs. Third, C. hirsuta has an autonomous self-pollinating system (Hay and Tsiantis 2006, Matsuhashi et al. 2012) and thus we can exclude the effect of pollen limitation (Knight et al. 2005) from the evaluation of reproductive allocation at the fruiting stage.
In this study, we estimated phenotypic selection on the height and number of flowering-stalks of C. hirsuta at the end of life cycle in three natural populations. For this purpose, we used a path analysis to elucidate intrinsic associations that show apparent positive correlations because the existence of third covariates. The path analysis has often been used to analyze hierarchical interactions in ecology (Albert et al. 2001, Milla et al. 2009) and can be applied to hierarchical structure and repeated modules of plants (Chen et al. 2009). We took this approach to distinguish the direct selection on rosette size and indirect selections on the rosette size via the height or number of flowering-stalks. In our path analysis, we selected the length of radical leaf as a single independent variable, because a rosette size has been known to represent relative amount of resources that primarily determine fecundity in rosette plants (Kachi and Hirose 1983). The relative importance of the height and number of flowering-stalks for the plant fitness was evaluated by comparing the magnitude of path coefficients between the two components of flowering-stalks.
C. hirsuta is a common roadside rosette plant that was naturalized into Japan. The first specimen in Japan was collected in 1974, and the species has been spreading all over Japan (Kudoh et al. 1992, 2006). The species shows the life cycle of a typical winter-green annual, and its flowering time extends from March to April in central Japan (Yatsu et al. 2003). Flowers are self-compatible (Matsuhashi et al. 2012). After fruit maturation, the seeds are dispersed spontaneously by explosive coiling of the carpel wall (Vaughn et al. 2011).
We selected study sites in three natural populations of C. hirsuta. The first site was along a walkway between paddy fields at Mori, Otsu, Shiga (34°56′54″N, 135°56′25″E; referred to hereafter as "Mori"). The second site was in a park along Kamo River at Sanjo, Kyoto (35°00′45″N, 135°46′19″E; "Sanjo"). The third site was on an open riverside at Kiryu, Otsu, Shiga (34°58′37″N, 135°59′05″E; "Kiryu"). We observed a few hoverflies and tachinid flies visiting the flowers of C. hirsuta in these populations (Sato, personal observations) but it was likely that many flowers were fertilized through auto-pollination. In the Kiryu site, we conducted a bagging experiment to examine fruit-set in the absence of no cross-pollination. Bagged individual showed 85.7% fruit-set in median (78.6% to 88.7% in 95% Confidence Interval (CI), N = 25) and the values were similar with those for non-bagged controls that showed 80.0% (75.0% to 88.1% in 95% CI, N = 11) fruit-set. In these study sites, vegetation was sparse and some small-sized weedy plants including the study species were growing.
In the fruiting season of C. hirsuta, we collected 50, 55 and 55 plants for measurements on April 1, 7, and 16, 2011, at the Mori, Sanjo, and Kiryu sites, respectively. We selected plants in which most fruits were fully matured; a single stalk had 0.74 ± 1.22 immature fruits (mean ± SD, N = 234 stalks at the Mori site). In case the damage on a main stalk can induce overcompensation or stem branching (Aarssen 1995), we did not select the plants that received visible injuries on flowering-stalks. At each site, plants were collected from an open rectangular area (approx. 50 × 15 m). We randomized plant size by collecting nearest plants from blindly thrown markers, but we also maintained a distance of at least 1 m between sampled plants. Each collected plant was carefully kept in a separate bag so as not to lose dehisced fruits and brought back to the laboratory.
All measurements were made within two days from the collection. For each plant, we measured the maximum leaf length, the number and length of flowering-stalks, and the number of matured fruits. Maximum leaf length was defined as length (mm) between the center of the rosette and the tip of the longest radical leaf. The main axis and the lateral branching initiated from the basal part of the main axis (lower than 3 cm from the base of rosette) were treated as individual flowering-stalks. The stalk length was defined as length (mm) between the apical meristem of the stalk and either the top of the rosette for the main stalk or the base of branching for the lateral stalks. More than one third of the length of a single stalk consisted of inflorescence part (mean ± SD = 37 ± 17 %, N = 234 stalks at the Mori site), and thus the length of inflorescence part was not negligible for the length of flowering-stalks in this species. The number of matured fruits was used as a proxy of seed production, because we could not estimate the accurate number of seeds due to the spontaneous seed dispersal in C. hirsuta (Vaughn et al. 2011).
Using the subset of samples, we estimated the following additional measures and correlations with dry matters. A single fruit weighed 3.55 ± 1.17 mg in dry weight and contained 19 ± 5.2 seeds (mean ± SD, N = 30; one fruit per plant from 30 individuals from the Mori site). Some flowering-stalks had a few upper branches, and 13%, 5%, and 1% of the total 234 stalks of 50 plants from the Mori site had one, two, and three branches, respectively. A small branch contained four fruits at most in the Mori site. The maximum leaf length was highly correlated with the ln-transformed dry weight of vegetative organs (including radical leaves and roots, but excluding floweringstalks; Pearson’s product-moment correlation coefficient, r = 0.74, t-test for no correlation, t = 5.89, P < 0.001, N = 30 plants from the Sanjo site). The length of the stem part of flowering-stalks (excluding the inflorescence part) showed a significant correlation with its ln-transformed dry weight (r = 0.75, t = 5.90, P < 0.001, N = 30 stalks from 30 plants from the Sanjo site).
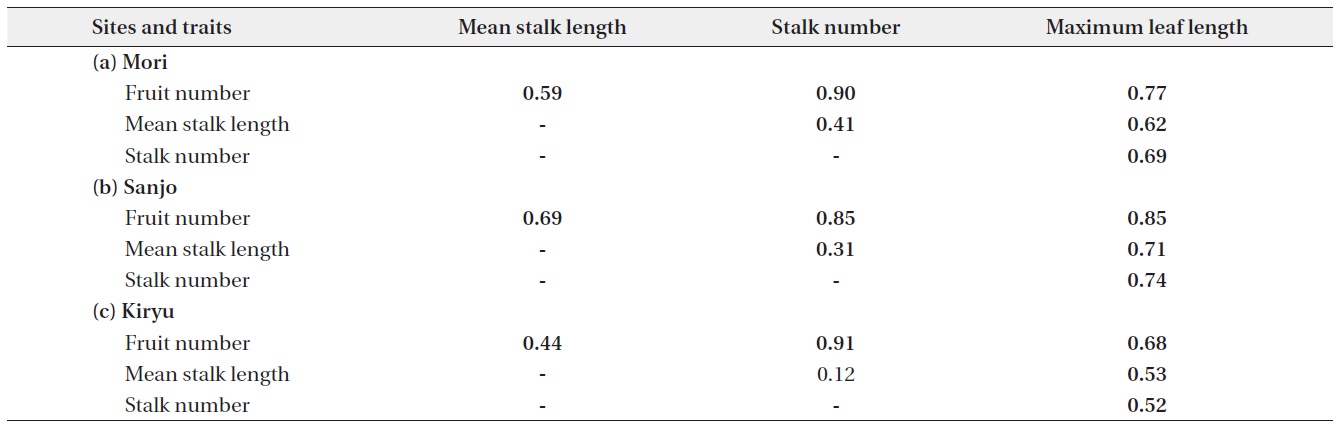
All statistical analyses were performed using R ver. 2.12.2 (R Development Core Team 2011). First, by showing Pearson’s product-moment correlation coefficients (r), we presented correlative relationships between each pair of individual-level traits: fruit number per individual, maximum leaf length, stem number, mean stem length. The length of flowering-stalks was averaged for each individual in order not to treat multiple stalks in an individual plant as pseudo-replications. R-squared values were calculated between the fruit number and the other traits and
linear regression was performed for the fruit number on the other traits. All variables were ln-transformed prior to the analyses.
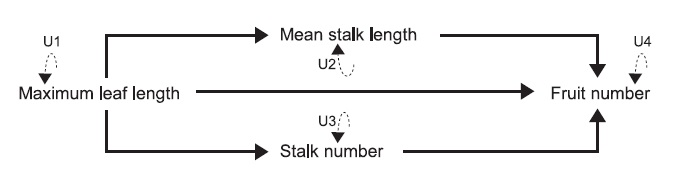
To further analyze hierarchically causal relationships among the four traits, we applied the path analysis combined with structural equation modeling (SEM) (Shipley 2004, Fox 2006) to the data collected from each site. Using the SEM, we intended to distinguish the direct effect from the indirect effect of plant size on fruit production via the length or number of flowering-stalks. Additional advantage of path analysis is that path coefficients are equivalent to selection coefficients (Lande and Arnold 1983, Kingsolver and Schemske 1991). As C. hirsuta produces self-compatible flowers (Matsuhashi et al. 2012) and showed high fruit-set under the bagged condition in one of our study sites (see “Study species and sites”), the fruit number was considered to fully represent individual fitness. Therefore, we used the SEM to estimate phenotypic selection on the length and number of flowering-stalks by analyzing the fruit number as a fitness component. Because of the enough correlation with rosette weight (see “Morphological measurements”), the maximum leaf length was assumed to represent the total amount of resources acquired in the growth period, which can be a primary determinant for the reproductive traits. Given the direct translocation from resources of radical leaves to seeds, the hypothesized structure included the direct causal path from maximum leaf length to fruit production. To examine the indirect allocation via floweringstalks to fruit production, the hypothesized structure also included the causal paths from maximum leaf length to fruit production through either the mean stalk length or stalk number. Because of the irreversible reproductive cycle in our study annual (Yatsu et al. 2003), we assumed causal relationships from other traits to fruit production. The structure of hypothesized causal relationships among the four traits in the SEM analyses is presented in Fig. 1.
Prior to the SEM analysis, all variables were ln-transformed and standardized to have a mean of zero and variance of one. The SEMs were performed according to the path diagram (Fig. 1), in which arrows indicated causal relationships among maximum leaf length, stalk number, mean stalk length, and fruit number, and unexplained variations of the four traits were represented as U1?U4. We used the SEM function implemented in R (Fox 2006) for the SEM analyses, where estimated path coefficients and standard errors are tested by Z-test. We also calculated
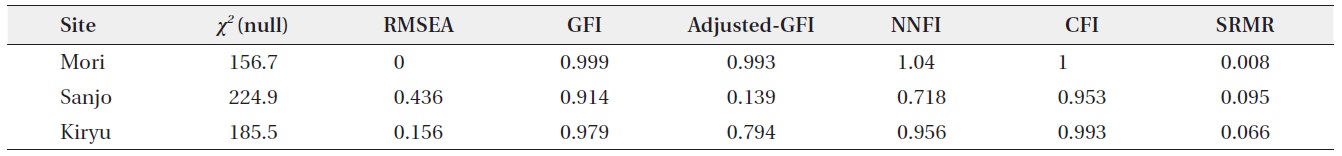
the following two fit statistics for each analysis: P-value of χ2 on one degree-of-freedom, and Bentler-Bonnett’s normed fit index (NFI). Although a high P-value of the χ2 generally represents a good fit, the NFI is proposed as a more robust fit index, with values > 0.90 being considered a good fit (Albert et al. 2001, Milla et al. 2009, see
also Bentler 1989). The other fit statistics calculated by the SEM function are listed in Appendix 1. Although we tried to analyze the same model substituting the mean stalk length into the total stalk length in an individual plant, these models using the other indicator of individual-level stalk length showed poor fits (NFI < 0.75 for the all sites).
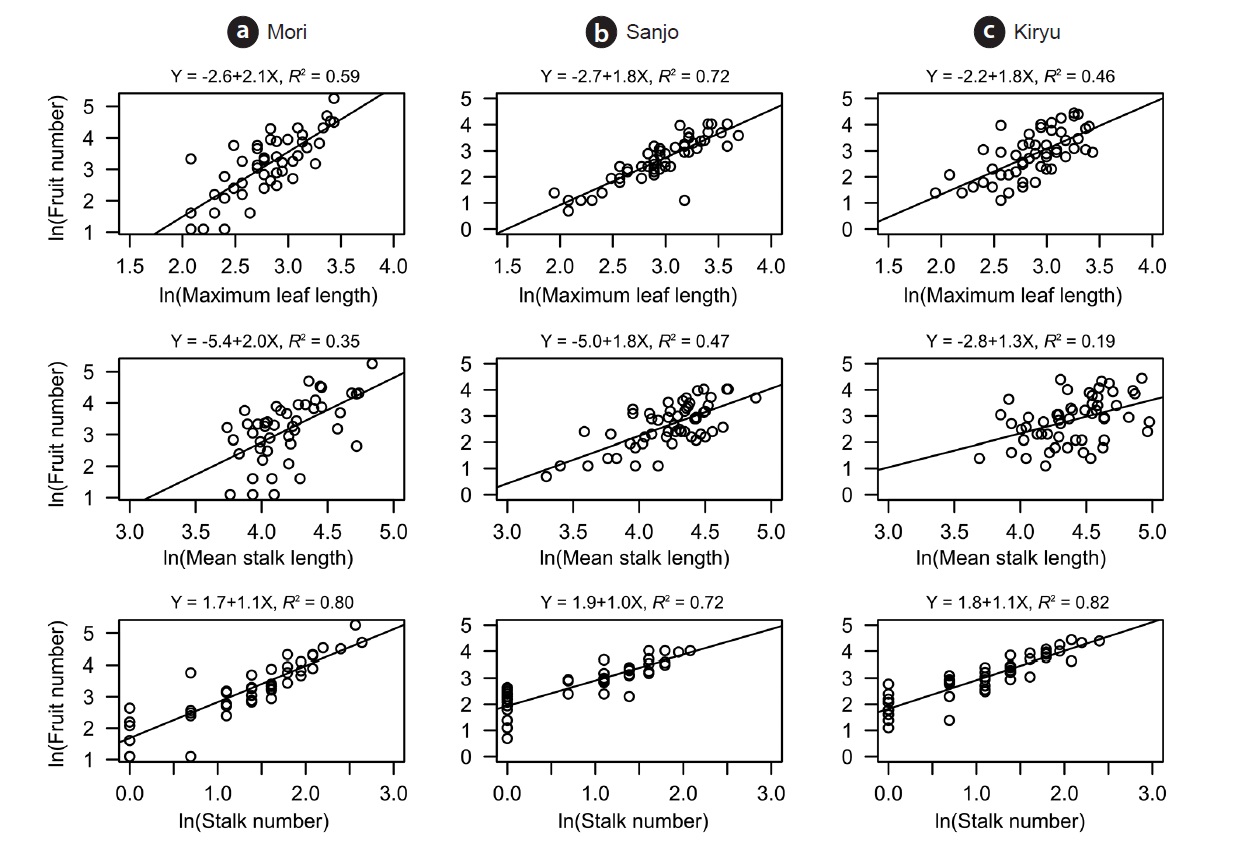
Positive correlations were found on each pair of analyzed traits. All of them showed significant correlation except for the relationship between mean stalk length and stalk number in the Kiryu site (Table 1). Large sized plants (maximum leaf length) produced more fruits for the all sites (R2 = 0.46 to 0.72: top column in Fig. 2). Although both of the stalk number and the mean stalk length showed positive correlations with the fruit number, R-squared values of the former (R2 = 0.72 to 0.82: bottom column in Fig. 2) were larger than those of the latter (R2 = 0.19 to 0.47: middle column in Fig. 2) for the all sites (Fig. 2).
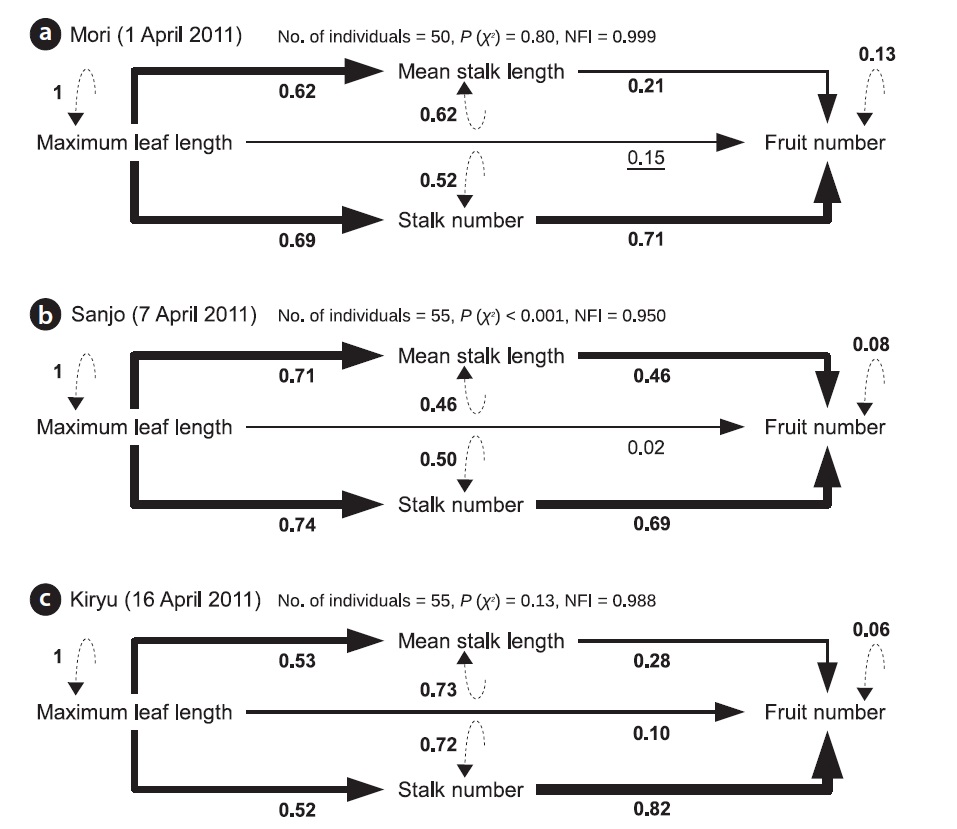
The SEM analyses also detected positive direct and indirect paths from maximum leaf length to the fruit number per individual plant (Fig. 3). All path coefficients were significant (P < 0.05) or marginally significant (P = 0.05) except for the direct path from maximum leaf length to fruit number at the Sanjo site (Fig. 3). In the all sites, the magnitude of path coefficient from stalk number to fruit number was 1.5 to 3.4 times larger than that from mean stalk length to fruit number, while the magnitude of path coefficient from maximum leaf length was similar to mean stalk length and to stalk number (Fig. 3). All unexplained variations were highly significant (P < 0.001) (Fig. 3). Although Chi-squared tests indicated a significant deviation from the SEM for Sanjo (P < 0.001), NFIs > 0.95 indicated a good fit for all of the presented models including the model for the Sanjo site (Fig. 3; see Appendix 1 for the other fit indices).
Our path analysis detected some consistent trends in the positive relationships among four traits of C. hirsuta. First, the magnitude of the effect of mean stalk length on fruit production was consistently smaller than that of the effect of stalk number over the three populations. Second, the effect of rosette size (i.e., maximum leaf length) was similar on the both mean stalk length and stalk number. In total, the indirect effect from the rosette size on fruit production via the stalk number was larger than that via the mean stalk length. Furthermore, in terms of R-squared value, the stalk number explained the larger amount of variations in fruit production than the mean stalk length did. These results suggest that the number rather than height of flowering-stalks more likely influences the plant fitness in C. hirsuta.
Even if the stalk number is more important for the plant fitness, there remains a question why did the rosette plants develop taller stalks. Two fitness-related functions of flowering-stalks in rosette plants have been proposed: pollinator attraction (Agren et al. 2006, Vanhoenacker et al. 2006) and seed dispersal (Brock et al. 2005, Hayashi et al. 2010, Vaughn et al. 2011). It is possible that taller plants can attract more pollinators (Donnelly et al. 1998) and hence enhance offspring fitness by avoiding inbreeding depression. However, pollinator visitation on C. hirusta seemed infrequent so that we could observe 0.05-0.25 pollinator visits per plant per hour at the Mori and Kiryu sites (Sato, personal observations) and selfing species usually has the smaller magnitude of inbreeding depression (Husband and Schemske 1996). Therefore we presume that the pollinator attraction less likely confers the fitness advantage of flowering-stalks in C. hirsuta. Another possibility for the function of flowering-stalks is efficient seed dispersal that relaxes competition among offspring. Because mature seeds are dispersed mechanically when fruits of C. hirsuta dehisce (Hayashi et al. 2010, Vaughn et al. 2011), elevated positions of fruits are expected to result in longer distances of seed dispersions. Additionally because large C. hirsuta plants produced hundreds of seeds per individual in our study site, competition could be intense in the natural habitat. Further examinations are required for fully understanding the adaptive role of flowering-stalks of C. hirsuta.
Our study detected the stronger phenotypic selection on the stalk number rather than on the stalk height. Then, important points in this context are whether these traits possess heritability or are under architectural constraint. Our field study cannot answer to these questions to be tested under controlled conditions, but several studies have revealed putative factors affecting the stem branching or elongation. External factors such as light condition or plant density can influence the stem elongation or branching (Niklas and Owens 1989, Cookson and Grainier 2006, Wang et al. 2006). The internal as well as external factors can affect the stem morphology. In a related species C. flexuosa, Kudoh et al. (1996) have revealed that the size at maturity depends considerably on plant age. More specifically, though the central and other floweringstalks were analyzed equally in our study, apical dominance is a known internal mechanism to regulate stem branching in plants (Aarssen 1995). While architectural constraints should be tested by allometric analysis and the experimental control on the factors above, studies on the local adaptation of Plantago suggest that the height of flowering-stalk could be a plant trait under natural selection (van Tienderen and van der Toorn 1991a, 1991b). Thus, it is probably true that many factors are involved in the determination of growth form, but our consistent results across the three populations indicate that the lateral branching rather than the increment of individual inflorescence size is the major response to control fruit production for C. hirsuta growing in a natural habitat.


![Resultant path diagrams showing causal relationships among four traits of Cardamine hirsuta for the Mori (a), Sanjo (b) and Kiryu (c) sites. All traits
were ln-transformed and standardized prior to the analyses. Solid and dashed arrows indicate causal relationship and unexplained variation, respectively.
The standardized coefficient is shown below each path, in which the bold and underlined values represent significant (P < 0.05) and marginally significant
(P = 0.05) path coefficient, respectively. The thickness of arrows represents the magnitude of path coefficients. Two fit statistics [P (χ2) and NFI] are also displayed
above each path diagram (see also Appendix for other fit indices).](http://oak.go.kr/repository/journal/12739/STHHCL_2013_v36n3_151_f003.jpg)