검색 전체 메뉴
PDF
맨 위로
OA 학술지
High Energy Observational Investigations of Supernova Remnants and their Interactions with Surroundings
  • 비영리 CC BY-NC
  • 비영리 CC BY-NC
ABSTRACT
High Energy Observational Investigations of Supernova Remnants and their Interactions with Surroundings
KEYWORD
supernova remnants , neutron stars , X-rays , gamma-rays , Kes 17 , G304.6+0.1 , G308.3-1.4
  • 1. INTRODUCTION

    There are many reasons for supernovae (SNe) and their remnants remain to be major interest for many high energy observers. SN is one of the most energetic events in our Galaxy, which sents out a shock front that provides a promising site for particle acceleration. Therefore, supernova remnants (SNRs) have long been suggested to be the promising sites for accelerating Galactic cosmicrays (GCRs) (Baade & Zwicky 1934). While many SNRs have their shock-heated plasma been detected by various X-ray telescopes, a small group of them has their X-ray emission found to be non-thermal dominant at their peripherals (cf. Weisskopf & Hughes 2006), which is resulted from the synchrotron radiation by the accelerated leptons at the shock fronts. These leptons are typically accelerated to the energies ?100 TeV (e.g. Reynolds & Keohane 1999, Hendrick & Reynolds 2001, Eriksen et al. 2011). However, they are not sufficient to account for the energetics as well as the composition of observed GCRs which contain a considerable fraction of hadrons (i.e. proton and heavy ions) up to the knee of its spectrum (i.e. ~1015 eV) (cf. Sinnis et al. 2009).

    Since relativistic protons are not efficient synchrotron emitters, X-ray observation can only infer their presence indirectly (e.g. Eriksen et al. 2011). On the other hand, γ-rays are generally accepted as the smoking gun of CR acceleration due to the decay of neutral pions π0 produced in the collision of the accelerated hadrons. Therefore, the detection of these gamma-rays can provide evidence for proton acceleration in a SNR.

    Thanks to the dedicated investigations carried out by the ground-based imaging atmospheric Cherenkov telescopes (e.g. H.E.S.S.), a group of SNRs have been detected in TeV regime (see Caprioli 2011 for a recent review). While these observations provided solid evidence for the presence of energetic particles, it is still difficult to disentangle various possible components (π0-decay, bremsstrahlung and/or inverse Compton due to electrons) in TeV band.

    On the other hand, the spectrum in the energy range between ~100 MeV to few tens of GeV has been expected to be rather different between hadronic/leptonic models (cf. Slane 2007). In view of this, the Large Area Telescope (LAT) onboard the Fermi Gamma-ray Space Telescope, which has optimal sensitivity in this energy range, provides a promising key to settle the debate. This motivates us to initiate a census of Galactic SNRs with Fermi LAT. In order to enhance the detectability, we particularly focus on those SNRs have interaction with molecular clouds (MCs) for the initial stage of this campaign (cf. Jiang et al. 2010).

    Considering SNRs as the accelerators of GCRs, it is necessary to ask whether they can account for the entire energy density of CRs in the Milky Way. This is related to the mechanical power provided by the SNe, which in turn related to their event rate. Since SNe inject an enormous amount of energy and metals in the interstellar medium (ISM), their intrinsic event rate also plays an important role in determining the dynamical and chemical evolution of the entire Galaxy.

    Assuming a typical evolution timescale of SNRs before they merge with the ISM (~105 yrs) and a event rate of 2 SNe/century in the Milky Way (Dragicevich et al. 1999), ~2000 SNRs are expected in our Galaxy. However, the expected population is far larger than the currently known population which has ~300 SNRs uncovered so far (cf. Green 2009, Ferrand & Safi-Harb 2012). If the adopted event rate and our understanding of SNR evolution are correct, such great deficit is most likely due to the selection effects in the past radio surveys.

    For complementing the radio observations, we would like to point out that the ROSAT all-sky survey (RASS) can provide us with an alternative window for searching SNRs in our Galaxy. In examining the RASS database, we have found ~100 unidentified extended X-ray sources as the possible SNR candidates. However, the short exposure of few hundred seconds and the poor spatial resolution in survey mode (~96”) prevent any firm identification of their nature.

    Since enlarging the sample size of Galactic SNRs is important to reveal the true Galactic SN rate, starformation history, interstellar chemical evolution and thus overall Galactic evolution, we have recently initiated an identification campaign of SNR candidates by utilizing the state-of-art X-ray telescopes. Apart from discovering previously unknown SNRs, our on-going campaign also enables a search for the possible stellar remnant formed in the SN explosion. After more than four decades of neutron star (NS) research, many other manifestations of NSs besides rotation-powered pulsars have now been known. One particular class of NSs, which is known as central compact objects (CCOs), are characterized by their proximities to the SNR centers and their thermal-dominant X-ray spectra (Hui et al. 2006a,b, 2009, 2012, Mereghetti 2011). Since SNRs can only be detectable for ~105 yrs before they fade into the ISM, CCOs are thus considered to be a class of young NSs. There are only 11 CCOs have been uncovered so far (cf. Tab. 1 in Mereghetti 2011). Our X-ray campaign is promising in enlarging their sample size and lead to a better understanding of their emission properties.

    2. DISCOVERY OF γ-RAY EMISSION FROM THE GALACTIC SNR KES 17

    Kes 17 is one of the poorly-studied remnants. It was firstly detected in radio band (Shaver & Goss 1970). A subsequent hydrogen line interferometric study (Caswell et al. 1975) has placed a lower bound of < 9.7 kpc on its distance. Its irregular radio shell morphology suggests evidence for the collisions between the SNR shock front and its dense environment (Milne et al. 1985, Whiteoak & Green 1996). This scenario was supported by the detection of 1,720 MHz OH maser in its direction (Frail et al. 1996). In an infrared survey of SNRs in the inner region of Milky Way, Kes 17 was detected with the images obtained by Spitzer Space Telescope (Reach et al. 2006). Along a subsequent infrared spectroscopic observation by Spitzer and AKARI, evidence for the shocked MC was suggested (Hewitt et al. 2009, Lee et al. 2011). In order to trace the possible CR acceleration at the location of Kes 17, we search for the GeV emission with ~ 30 months of data obtained from Fermi LAT.

    With the aforementioned data span, we have detected
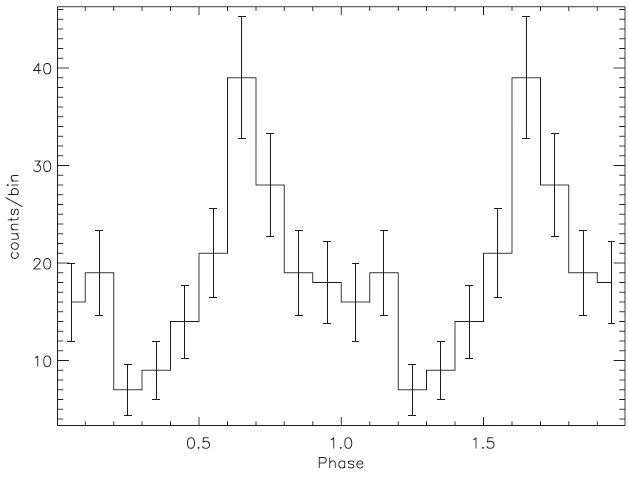
 γ-ray emission from Kes 17 at a significance of ~12σ in the 1-20 GeV range (Wu et al. 2011). The 2o × 2o test statistic (TS) map in 1-20 GeV centered at the nominal position of Kes 17 is shown in Fig. 1. The best-fit position in 1-20 GeV is found at RA = 13h05m55.01s Dec = -62o 39'49.7" (J2000) with 1σ error radius (statistical) of 0.042o which is illustrated with black circle in Fig. 1. Apart from the bright central source, two additional features are noted in the TS map. One feature is apparently extended to the southwest from Kes 17 (referred as Source SW hereafter). And the other feature which located on the eastern side appears to be a distinct source (referred as Source E hearafter). The emission of sources SW and E is separated from the nominal remnant center of Kes 17 at 0.58o and 0.54o respectively.

    For examining its γ-ray spectral properties, we firstly assumed a power-law (PL) spectrum of Kes 17 for an unbinned likelihood analysis. The best-fit model yields a photon index of Γ=2.42±0.16, a prefactor of (1.80±1.05)×10-9 cm-2s-1MeV-1 and a TS value of 146 which corresponds to a significance of 12σ. Its photon flux in this band is (4.7 ± 0.7) ×10-9 cm-2s-1 The corresponding integrated energy flux is

    image

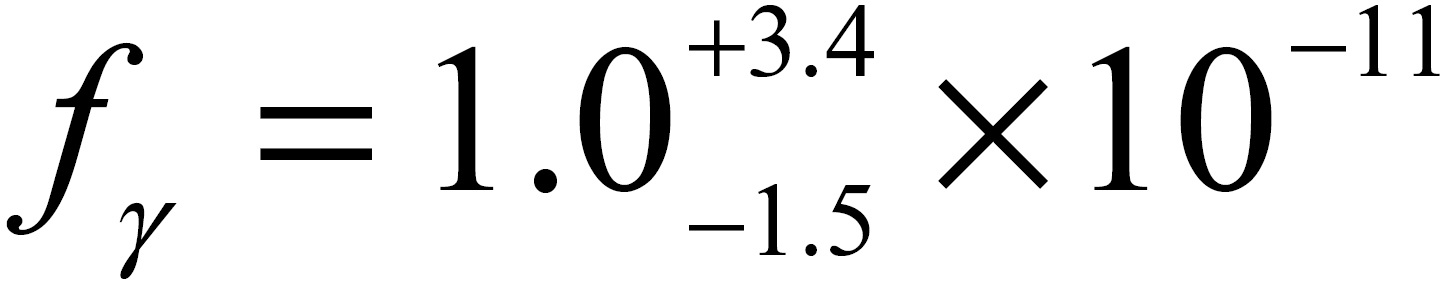
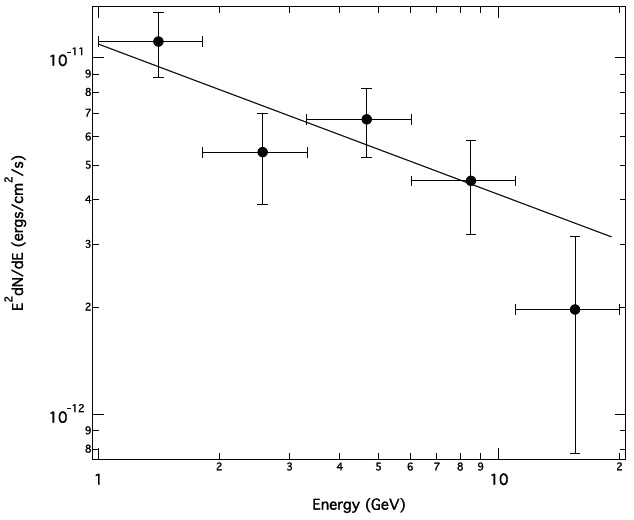
    erg cm -2s-1 With the full energy range

    of 1-20 GeV divided into 5 logarithmically equally-spaced energy bins, the binned spectrum is constructed from the indpendent fits of each bin which is displayed in Fig. 2. Besides a simple PL model, we have also examined if an exponential cutoff power-law (PLE) or a broken power-law (BKPL) can improve the fit. The fittings with PLE and BKPL yield the TS value of 146 and 145 respectively. Based on the likelihood ratio test, the additional spectral parameters in EPL/BKPL are not statistically required for describing the observed γ-ray spectrum.

    In a scenario of runaway CR model (Ohira et al. 2011, Abdo et al. 2010), the MCs are illuminated by the CRs that escaped from the SNR in earlier epochs. If this is indeed the case, systems like Kes 17 can enable us to study how the CRs are released in SNRs as well as their propagation in the ISM. It is instructive to compare the spatial separation between the SW feature and Kes 17 with the CR diffusion. Assuming a diffusion coefficient of the CRs in the ISM to be
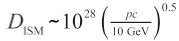
    image

    cm2s-1, where p is the CR momentum (cf. Ohira et al. 2011, Berezinskii et al. 1990). Adopting the remnant age of tSNR~5×10⁴ yrs (Combi et al. 2010), the diffusion scale can be crudely estimated as

    image

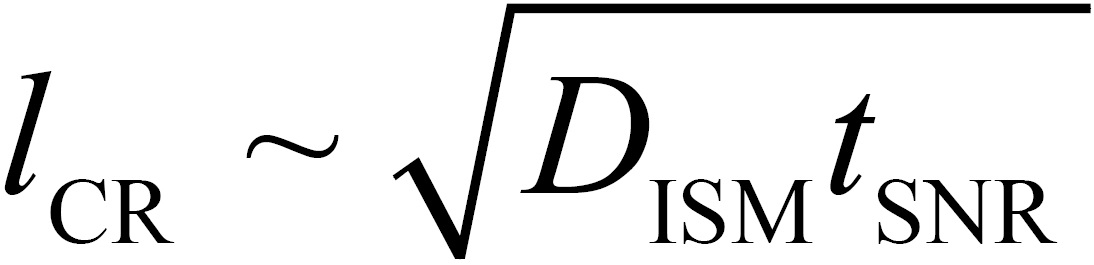
    ~40 pc for the CRs with energies of ~10 GeV. At the distance of 9.7 kpc, this translates into an angular separation of ~0.3o which is at the same order to that between the SW feature and nominal center of Kes 17.

    3. X-RAY IDENTIFICATION OF NEW SNR G308.3-1.4 AND ITS CENTRAL COMPACT OBJECT

    Recently, we initiated an extensive identification campaign of unidentified extended RASS objects with G308.3-1.4 as our pilot target (Hui et al. 2012). G308.3-1.4 has already been known as a SNR candidate in the MOST SNR catalogue (Whiteoak 1992). But the limited photon statistics and the poor resolution of the RASS data do not allow any further probe of its X-ray emission properties. This has motivated us to observe G308.3-1.4 with Chandra X-ray Observatory. The detailed analysis of this observation has recently been published (Hui et al. 2012). Here, we give a highlight of the major results.

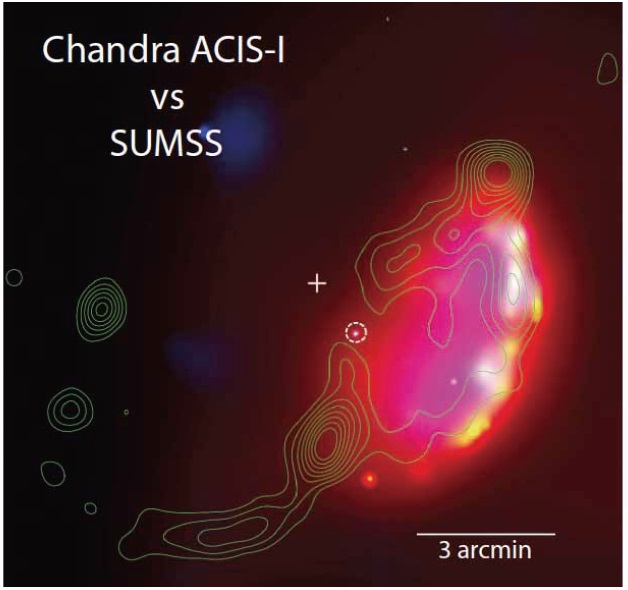
    The X-ray color image of the field around G308.3-1.4 obtained by Chandra is displayed in Fig. 3. An incomplete shell-like X-ray structure is found to be well-correlated with the radio shell structure. The radio contours are obtained from the 843 MHz Sydney University Molonglo Sky Survey (SUMSS) data (Bock et al. 1999). Together with the X-ray spectral analysis of the extended emission which suggests it as a shock-heated plasma with a temperature in a range of kT ~ 0.6-1 keV (cf. Tab. 2 & Fig. 8 in Hui et al. 2012), our observation confirms G308.3-1.4 as a new SNR unambiguously. The normalization inferred from the spectral fit of the X-ray shell impiles the shocked hydrogen and electron densities in the ranges of

    image

    respectively, where Dkpc is the remnant distance in unit of kpc. Assuming G308.3-1.4 is in a Sedov phase and it is a strong shock, the temperature implies

    the age of this SNR to be

    image

    yrs. A recent radio investigation has also resulted in the same conclusion and suggest G308.3-1.4 is a young to middle-aged SNR in the early adiabatic phase of evolution (De Horta et al. 2013).

    Apart from confirming the SNR nature of G308.3-1.4, our Chandra observation also enables us to search for the possible stellar remnant formed in the supernova explosion. Among 17 newly detected X-ray point sources (cf. Tab. 1 in Hui et al. 2012), the brightest one is also the one locates closest to the geometrical center of G308.3-1.4 (see Fig. 3). Its X-ray point source spectrum can be described by a double blackbody with the temperature of kT1?0.1keV, kT2?0.4keV and the emitting areas of R1?27Dkpc km and R2?35Dkpc m respectively. These are similar to those of CCOs which is one of the most enigmatic manifestations of neutron stars (cf. Hui et al. 2006a,b, 2009, 2012). The column density inferred from the CCO spectrum is consistent with that for the remnant, which suggest the possible association between the CCO and G308.3-1.4. We proceeded to search for the possible X-ray periodic signals from CCO and have found an interesting periodicity candidate of P ~ 1.4 hrs (Fig. 4). Together with the spectral energy distribution of its identified optical/IR counterpart, which conforms with the spectrum of a M dwarf at the red end and with an apparent excess at the blue end (Fig. 5), our results suggest a possible direct evidence for compact binary that survived

    in a supernova explosion (Hui et al. 2012). Multiwavelength follow-up observations of this system are highly encouraged.

참고문헌
  • 1. Abdo AA, Ackermann M, Ajello M, Allafort A, Baldini L (2010) Fermi Large Area Telescope Observations of the Supernova Remnant W28 (G6.4-0.1) [ApJ] Vol.718 P.348-356 google cross ref
  • 2. Baade W, Zwicky F (1934) Cosmic Rays from Super-novae [PNAS] Vol.20 P.259-263 google cross ref
  • 3. Berezinskii VS, Bulanov SV, Dogiel VA, Ginzburg VL, Ptuskin VS 1990 Astrophysics of Cosmic Rays google
  • 4. Bock DCJ, Large MI, Sadler EM (1999) SUMSS: A Wide-Field Radio Imaging Survey of the Southern Sky. I. Science Goals, Survey Design, and Instrumentation [AJ] Vol.117 P.1578-1593 google cross ref
  • 5. Caprioli D (2011) Understanding hadronic gamma-ray emission from supernova remnants [JCAP] Vol.5 P.26 google cross ref
  • 6. Caswell JL, Clark DH, Crawford DF, Green AJ (1975) Molonglo and Parkes Supernova Remnant Observations [AJPAS] Vol.37 P.1 google
  • 7. Combi JA, Albacete CJF, Sanchez-Ayaso E, Romero GE, Marti J (2010) XMM-Newton detection of the supernova remnant G304.6+0.1 (Kes 17) [A&A] Vol.523 P.76-81 google cross ref
  • 8. De Horta AY, Collier JD, Filipovi? MD, Crawford EJ, Uro?evi? D (2013) Radio confirmation of Galactic supernova remnant G308.3-1.4 [MNRAS] Vol.428 P.1980-1985 google cross ref
  • 9. Dragicevich PM, Blair DG, Burman RR (1999) Why are supernovae in our Galaxy so frequent? [MNRAS] Vol.302 P.693-699 google cross ref
  • 10. Eriksen KA, Hughes JP, Badenes C, Fesen R, Ghavamian P (2011) Evidence for Particle Acceleration to the Knee of the Cosmic Ray Spectrum in Tycho’s Supernova Remnant [ApJ] Vol.728 P.L28-L32 google cross ref
  • 11. Ferrand G, Safi-Harb S (2012) A census of high-energy observations of Galactic supernova remnants [Advances in Space Research] Vol.49 P.1313-1319 google cross ref
  • 12. Frail DA, Goss WM, Reynoso EM, Giacani EB, Green AJ (1996) A Survey for OH (1720 MHz) Maser Emission Toward Supernova Remnants [AJ] Vol.111 P.1651-1659 google cross ref
  • 13. Green DA (2009) A revised Galactic supernova remnant catalogue [BASI] Vol.37 P.45-61 google
  • 14. Hendrick SP, Reynolds SP (2001) Maximum Energies of Shockaccelerated Electrons in Large Magellanic Cloud Supernova Remnants [ApJ] Vol.559 P.903-908 google cross ref
  • 15. Hewitt JW, Rho J, Andersen M, Reach WT (2009) Spitzer Observations of Molecular Hydrogen in Interacting Supernova Remnants [ApJ] Vol.694 P.1266-1280 google cross ref
  • 16. Hui CY, Becker W (2006a) X-ray observations of RX J0822-4300 and Puppis-A [A&A] Vol.454 P.543-552 google cross ref
  • 17. Hui CY, Becker W (2006b) Probing the proper motion of the central compact object in Puppis-A with the Chandra high resolution camera [A&A] Vol.457 P.L33-L36 google cross ref
  • 18. Hui CY, Becker W (2009) Exploring the X-ray emission properties of the supernova remnant G67.7+1.8 and its central X-ray sources [A&A] Vol.494 P.1005-1012 google cross ref
  • 19. Hui CY, Seo KA, Huang RHH, Trepl L, Woo YJ (2012) Identification Campaign of Supernova Remnant Candidates in the Milky Way. I. Chandra Observation of G308.3-1.4 [ApJ] Vol.750 P.7-15 google cross ref
  • 20. Jiang Bing, Chen Y, Wang J, Su Y, Zhou X (2010) Cavity of Molecular Gas Associated with Supernova Remnant 3C 397 [ApJ] Vol.712 P.1147-1156 google cross ref
  • 21. Lee HG, M DS, Koo BC, Onaka T, Jeong WS (2011) Far-Infrared Luminous Supernova Remnant Kes 17 [ApJ] Vol.740 P.31-38 google cross ref
  • 22. Mereghetti S 2011 High-Energy Emission from Pulsars and their Systems, Astrophysics and Space Science Proceedings P.345 google cross ref
  • 23. Milne DK, Caswell JL, Haynes RF, Kesteven MJ, Wellington KJ (1985) Synthesis observations of southern supernova remnants [Proceedings of the ASA] Vol.6 P.78-89 google
  • 24. Ohira Y, Murase K, Yamazaki R (2011) Gamma-rays from molecular clouds illuminated by cosmic rays escaping from interacting supernova remnants [MNRAS] Vol.410 P.1577-1582 google cross ref
  • 25. Pickles AJ (1998) A Stellar Spectral Flux Library: 1150-25000 A [The Publications of the Astronomical Society of the Pacific] Vol.110 P.863-878 google cross ref
  • 26. Reach WT, Rho J, Tappe A, Pannuti TG, Brogan CL (2006) A Spitzer Space Telescope Infrared Survey of Supernova Remnants in the Inner Galaxy [AJ] Vol.131 P.1479-1500 google cross ref
  • 27. Reynolds SP, Keohane JW (1999) Maximum Energies of Shockaccelerated Electrons in Young Shell Supernova Remnants [ApJ] Vol.525 P.368-374 google cross ref
  • 28. Shaver PA, Goss WM (1970) Galactic radio sources. III. Spectra and physical characteristics [Aust. J. Phys. A (Suppl.)] Vol.17 P.133-196 google
  • 29. Sinnis G, Digel S, Moskalenko IV, Dingus BL, Huentemeyer P 2009 The Origin of the Galactic Cosmic Radiation google
  • 30. Slane P (2007) Supernova Remnants and GLAST, The First GLAST Symposium. [AIP Conference Proceedings] Vol.921 P.57-61 google cross ref
  • 31. Weisskopf MC, Hughes JP 2006 Six Years of Chandra Observations of Supernova Remnants, Astrophysics P.55-113 google cross ref
  • 32. Whiteoak JBZ (1992) The distribution and nature of smalldiameter radio sources along the southern galactic plane [A&A] Vol.262 P.251-257 google
  • 33. Whiteoak JBZ, Green AJ (1996) The MOST supernova remnant catalogue (MSC) [A&AS] Vol.118 P.329-380 google
  • 34. Wu JHK, Wu EMH, Hui CY, Tam PHT, Huang RHH (2011) Discovery of Gamma-Ray Emission from the Supernova Remnant Kes 17 with Fermi Large Area Telescope [ApJ] Vol.740 P.L12-L16 google cross ref
OAK XML 통계
이미지 / 테이블
  • [ Fig. 1. ]  Test-statistic (TS) map in 1-20 GeV of a region of 2o × 2o centered at the nominal position of Kes 17 (magenta cross). The peak emission of the southwestern and the eastern features are marked with green cross. Positions of various sources are also illustrated. The color scale bar is used to indicated the TS values. The circle in black represents the 1σ positional error circle.
    Test-statistic (TS) map in 1-20 GeV of a region of 2o × 2o centered at
the nominal position of Kes 17 (magenta cross). The peak emission of the
southwestern and the eastern features are marked with green cross. Positions
of various sources are also illustrated. The color scale bar is used to indicated
the TS values. The circle in black represents the 1σ positional error circle.
  • [ Fig. 2. ]  Fermi LAT spectrum of Kes 17. The full energy range 1-20 GeV is divided into 5 energy bins. The data points and the vertical error bars correspond to independent fits in the respective bins. The solid line represents the best-fit power-law model inferred in the full energy band (i.e. Γ=2.42).
    Fermi LAT spectrum of Kes 17. The full energy range 1-20 GeV is divided
into 5 energy bins. The data points and the vertical error bars correspond to
independent fits in the respective bins. The solid line represents the best-fit
power-law model inferred in the full energy band (i.e. Γ=2.42).
  • [ Fig. 3. ]  10'×10' Chandra ACIS-I X-ray colour image of G308.3-1.4 (red: 0.5-1 keV, green: 1-2 keV, blue: 2-8 keV). The binning factor of this image is 2". Adaptive smoothing has been applied to achieve a minimum signal-tonoise ratio of 3. The geometrical center inferred from the X-ray morphology is illustrated by the cross. The associated CCO (i.e. the brightest source which locates closest to the geometrical center.) is highlighted by the dash circle. Top is north and left is east.
    10'×10' Chandra ACIS-I X-ray colour image of G308.3-1.4 (red: 0.5-1
keV, green: 1-2 keV, blue: 2-8 keV). The binning factor of this image is 2".
Adaptive smoothing has been applied to achieve a minimum signal-tonoise
ratio of 3. The geometrical center inferred from the X-ray morphology
is illustrated by the cross. The associated CCO (i.e. the brightest source which
locates closest to the geometrical center.) is highlighted by the dash circle.
Top is north and left is east.
  • [ Fig. 4. ]  X-ray counts of the CCO in G308.3-1.4 versus phase for a periodicity candidate of 1.4 hrs. Two periodic cycles are shown for clarity. The error bars represent 1σ uncertainties.
    X-ray counts of the CCO in G308.3-1.4 versus phase for a periodicity
candidate of 1.4 hrs. Two periodic cycles are shown for clarity. The error bars
represent 1σ uncertainties.
  • [ Fig. 5. ]  Optical/infrared spectral energy distribution of the CCO in G308.3-1.4. Both observed (open symbols) and de-reddened (solid symbols) data points are shown in this plot. The open and solid triangles represent the observed and de-reddened 3σ upper limit inferred from SWIFT UVOT observation. The spectral model of a M3V star obtained from the stellar spectral flux library (Pickles 1998) is overplotted. The error bars represent the photometric uncertainties corresponding to each data point.
    Optical/infrared spectral energy distribution of the CCO in G308.3-1.4.
Both observed (open symbols) and de-reddened (solid symbols) data points
are shown in this plot. The open and solid triangles represent the observed
and de-reddened 3σ upper limit inferred from SWIFT UVOT observation.
The spectral model of a M3V star obtained from the stellar spectral flux
library (Pickles 1998) is overplotted. The error bars represent the photometric
uncertainties corresponding to each data point.
(우)06579 서울시 서초구 반포대로 201(반포동)
Tel. 02-537-6389 | Fax. 02-590-0571 | 문의 : oak2014@korea.kr
Copyright(c) National Library of Korea. All rights reserved.