The need to develop low temperature and high strength casting steel for offshore structures has increased in line with the expanding resource development in areas, such as the Arctic Ocean. The brackets used for vessels or lathe structures are normally “ㄱ” or “T” shaped, and are used as supplementary structures to accommodate stress concentrations on the corners where columns meet, or where a beam and a triangular shape occurs. For a large bracket, the end part is designed using a curve to reduce interference, weight, and stress transfer (Lee, 2008).
A bracket for a vessel and structure is manufactured in plank form. When reinforcement is required, a face plate, flange, and side stiffener are welded to the bracket. The thickness of the bracket is basically determined by the girder, beam, or web plate. The thickness of the bracket is normally determined by the thickness of the web plate of the basic material. The bracket connects to the beam or column. For the bracket built-up type, a thickness adjustment and shape optimization considering the stresses are difficult. Moreover, a thicker member increases the welding requirements. Hence, a larger size and heavier member reduces the efficient use of space.
A study to change the design of the bracket girder or beam was conducted to solve these problems (Lee et al., 2004). Lee et al. attempted to omit the face bar by increasing the thickness from the standpoint of production efficiency (Lee et al., 2006). In another study, the bracket was removed from the structure, including the longitudinal stiffener or vertical stiffener (Kim et al., 2003). On the other hand, the weight of a vessel and its structure inevitably increases when a bracket is removed by strengthening the girder or beam. For a better design of the bulb bracket, a side stiffener and curve were adopted on the diagonal surface line instead of the face plate. As a result, the size and weight could be reduced by 30% and 50%, respectively, using the bulb bracket fabricated in the casting process instead of the built-up type.
The authors propose a concurrent engineering solution to interconnect systematically all the processes from the material design and fabrication process design. Therefore, to produce an optimal bracket shape for an offshore structure that requires stricter weight control and efficient spatial use, it is necessary to design a low temperature, high strength, low carbon steel material for a standard bulb bracket vessel structure, instead of a built-up type. The authors evaluated the optimal structure design using the ANSYS program and designed the optimized casting process using MAGMAsoft-V5 [http://www.magmasoft.com]. The authors considered the fabrication of parts through material development, parts design, and casting process analysis of the designed parts to identify the mechanical characteristics and development method of a carbon steel bracket.
>
Alloy design and its fabrication
The development of the raw material of the bulb bracket was carried out after setting a quantitative goal (Caron and Krauss, 1972; Offshore standard DNV-OS-B101 Metallic Materials, 2009). In the manufacturing process, low carbon scrap iron and pig iron were mixed and melted at a certain ratio. When melting reached 50%, manganese (Mn) was added initially because the melting time of Mn is longer than any other metal. After melting all the metal materials, trace minerals, such as Ni, Si, and Cr, were added based on an initial analysis Data Base (D.B) to obtain the target material. From the melted material, impurities and oxidezers were removed using a slurry remover, and deoxidization was performed using an aluminum deoxidizer as soon as melting was complete.
>
Preparation of alloy sample and evaluation of its chemical composition
To measure the component ratio of the alloy, a 100
The carbon equivalent is the relative ratio of the alloy element acting as carbon or playing carbon-like role in a metal material. Various equations have been applied to the carbon equivalent. In Ceq (1), the maximum value is considered up to 0.45, and up to 0.25 in Pcm (2).


The critical cooling speed and transformation temperature were lowered according to the carbon equivalent, which allowed easy transformation to martensite to increase the hardenability. Higher hardenability causes bending deformation and cracks. Therefore, bending and cracks might be avoided by preheating before welding at the interlayer temperature. Therefore, the carbon equivalent in welding serves as a barometer for determining the preheating and interlayer temperature. The Pcm and Ceq of the sample, as shown in Table 1, were confirmed to be within the allowable range.
[Table 1] Chemical properties based on chemical analysis of the sample (%) (before casting).

Chemical properties based on chemical analysis of the sample (%) (before casting).
Heat treatment was carried out to achieve the target mechanical properties, such as yield strength of 490
Considering the temperature maintenance and heating time as the heat treatment conditions, a heat treatment furnace was used for quenching and super kanthal was used as the heating element. The maximum heating temperature was 1,600
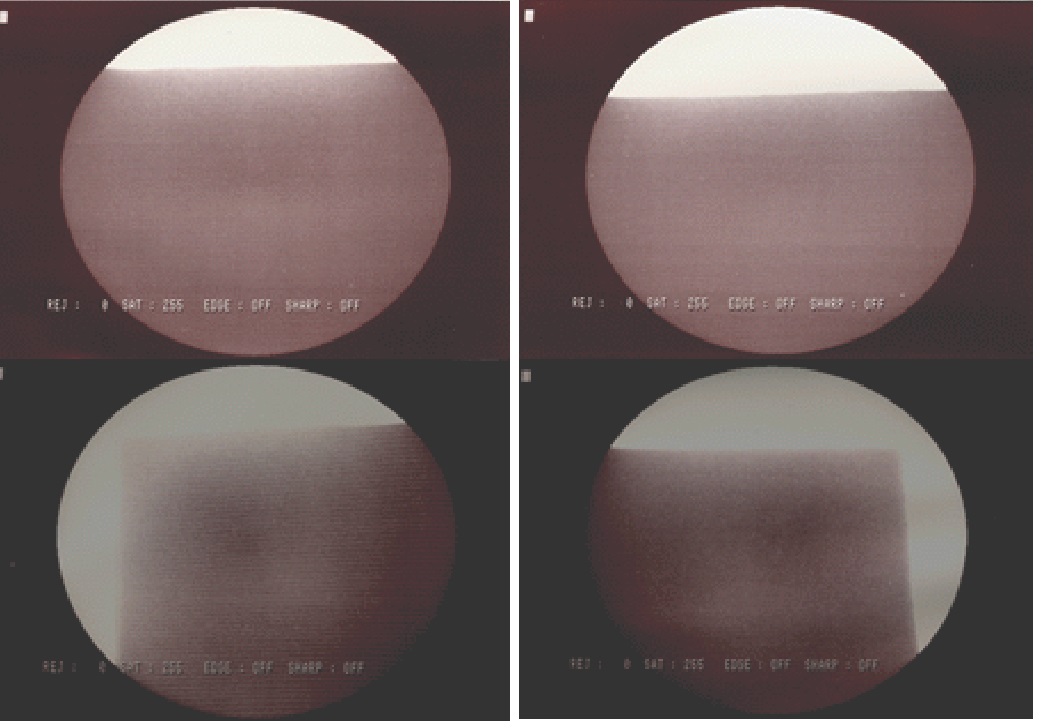
The refined structure before heat treatment depending on the carbon content and transformed martensite depending on the tempering conditions after quenching was compared. A specimen size of 10 × 10
The specimen was machined according to the ASTM A370 standard. During the tension test, the yield strength, tensile strength and elongation were measured. The contraction percentage in area was also measured after the tensile test. The surface where the contraction was most prominent was measured using Kandon digital vernier calipers. A hardness test was conducted using the specimen taken for photographing the structure, considering that the test surface and rear surface were parallel to meet the requirements for the hardness test. A hardness test is needed to measure the mechanical properties, or structural change due to heat treatment. The measurement was carried out at least five times using a Brinell harness tester at room temperature.
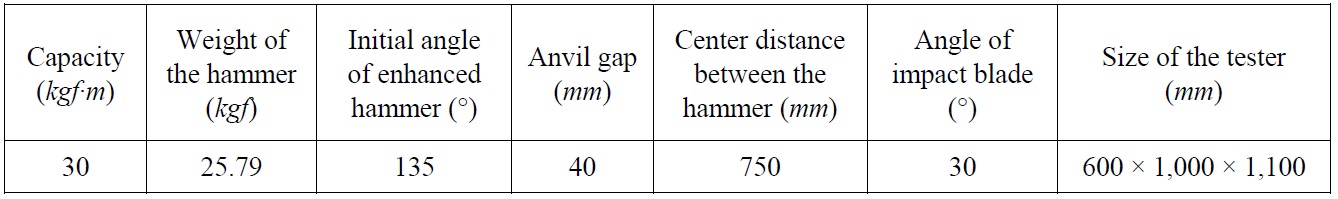
The impact test was carried out using a Charpy-type impact testing machine. An ASTM E 23 and Type A specimen was adopted according to ASTM E 23. Table 2 provides details of the impact test device.
A Charpy impact test impacts the rear side of the notch of the specimen, which was supported on both ends with a hammer for a single time. The impact speed was varied depending on the rising angle of the hammer, but the impact speed of the tester was normally 10
[Table 2] Conditions of the Charpy impact test.

Conditions of the Charpy impact test.
>
Results and discussion of material development
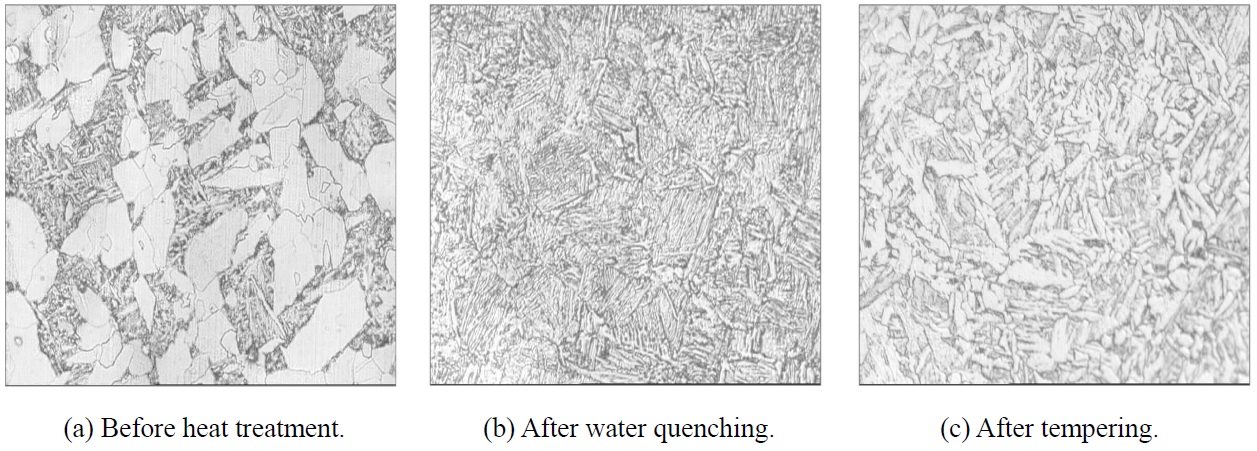
To observe the refined structure of the specimen, the structure before heat treatment was examined. The result is shown in Fig. 1(a). According to the histology classification, the nucleation and growth of ferrite or cementite occur along the austenite crystal. Such a crystal is a crystal allotriomorph, which forms when maintained for extended periods at a region where two phases coexist or when they slowly pass by slow cooling, i.e. a state near equilibrium. Under such conditions, the time for diffusion is sufficient while the thermodynamic driving force is small. Therefore, a relatively larger core was extracted heterogeneously to an austenite crystal. Such a process minimizes the increase in interfacial energy by nucleation from the new core and the existing austenite crystal. In Fig. 1, the part in white is free ferrite andin black is pearlite. The connection of free ferrite is often discontinued, unlike a Widmanstatten structure, because of an incoherent interface due to the poor atomic configuration between the ferrite and the other side of austenite.
To transform the sample structure to a martensitic structure, it was heated at 930
Fig. 1 shows the martensite structure after tempering for 4
[Table 3] Mechanical properties of the samples.
Mechanical properties of the samples.
Table 3 lists the mechanical properties of the sample. Quenching was carried out after maintaining the sample at 930
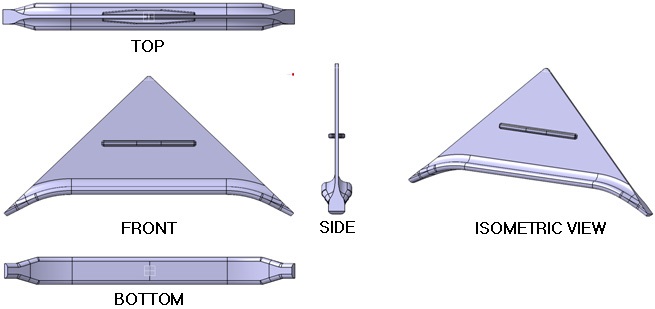
BRACKET DESIGN USING SIMULATION ANALYSIS
The material for the rolling process of the bulb bracket and built-up bracket is a DH36 class plate, which is normally used for the plate and rolling processes. The DH36 class plate has a 500
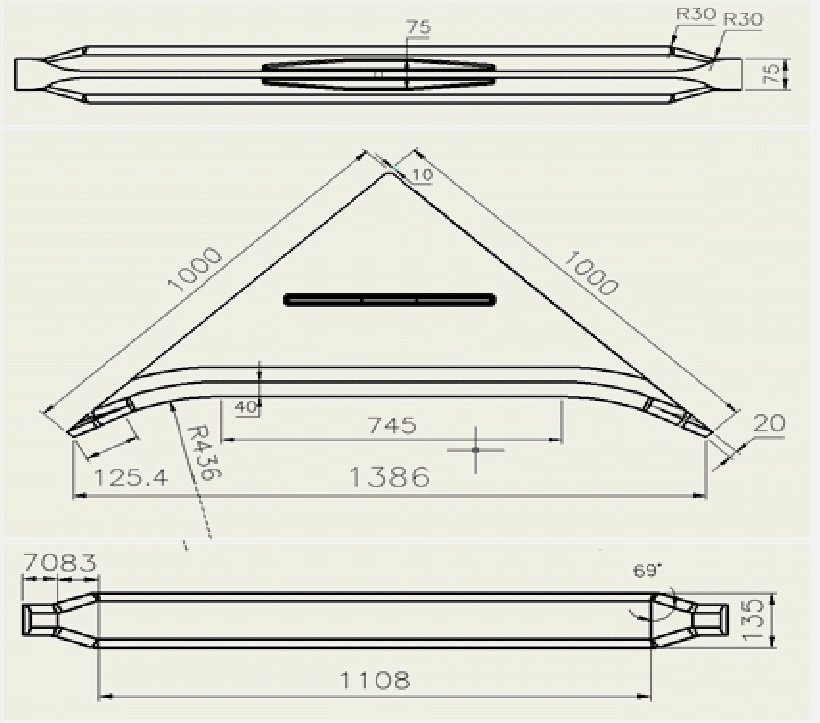
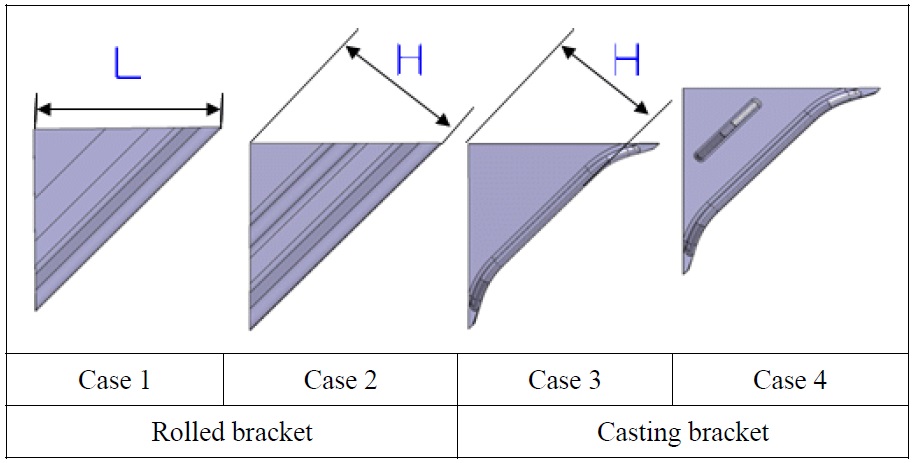
As shown in Fig. 3, the standard shape of the four bulb brackets using two types of rolled steel (cases 1 and 2) fabricated with DH36, and two types of cast steel (cases 3 and 4) fabricated with the material developed in this study, was designed to include a notch welding bead. For the built-up bracket produced to use the plate cutting and welding process, the face bar was applied to the medium or large size. Depending on the type of stress, a side stiffener was attached in parallel with a face bar, or
vertically to the web plate of the bracket. The thickness of the bracket web plate was determined to be less than the thickness of the web plate of the girder or beam. The face bar was less than twice the thickness of the web plate, taking into account the welding workability. The side stiffener had a basic shape within the thickness of the web plate, and the size varied according to the working load of the design. A small bracket that requires no reinforcement and no welding process was cut to size only.
The slope of the bracket was designed as a combination of a circular curve and a straight line for efficient transfer and expansion of the stress to reduce the size as well as secure the installation for accessory. Bending is required when installing the face bar. In a permanent design, an L-shape face bar is often used after cutting the face bar and bending the edge, but is not commonly used for offshore structures, which have many stress concentration points and relatively larger concentrated loads. The bulb bracket has a thicker face bar and side stiffener depending on the distribution of the stress working based on the basic shape of the built-up bracket and the connection between the curve and straight section was designed to be gentle, referring to the part of shape of bulb flat. A rolled shape requires less welding than a built-up type, and the thickness can be increased. A rolled shape has the advantage of lower manufacturing cost and better mass production compared to cast steel, but the rolling process has difficulties in producing diverse curves and adjusting the thickness.
For a thickness adjustment, a method was used to calculate the induced stress (σ) after computing the section modulus (Z, b is horizontal length of the square structure and h is the vertical length of the square structure) of the square structure described in Eqs. (3) and (4) for the difference in the stress distribution at each mesh and bending moment (M). Another method involving the application of a 1:25 Snip to both ends of the face bar and side stiffener was attempted for optimization, and was verified using ANSYS Finite Elements Method (FEM) analysis software. The following equations were used:


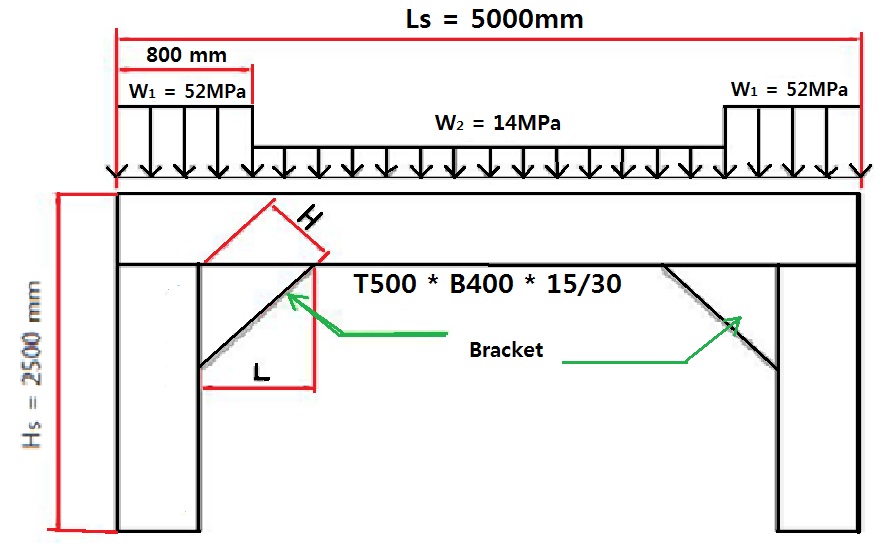
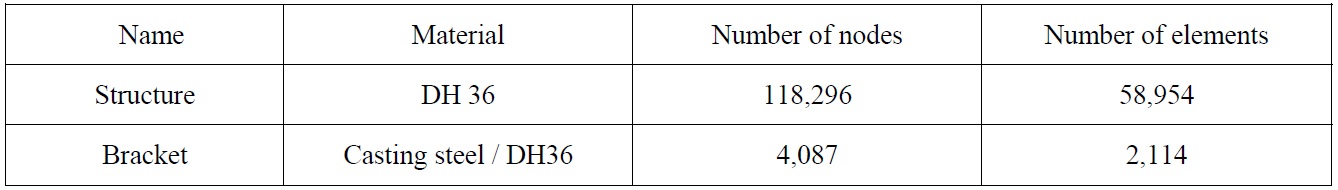
The beam and girder, which is the main structure serving the framework, was T-shaped and manufactured from DH36 steel. DH36 was used for bracket cases 1 and 2. Casting steel was used for cases 3 and 4. The shape for the analysis model was developed using the ANSYS program, as shown in Fig. 4. The main structure consisted of a 2,500
A bilateral symmetric structure with a DH36 beam and girder was produced. A uniform load differentiated by two vertical loads, 52
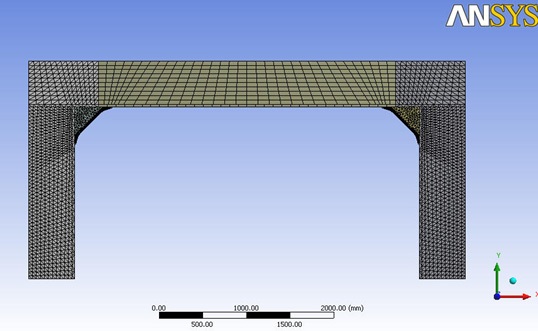
As shown in Table 4, the main structure has more nodes and elements for analysis, which was attributed to the difference in size, as indicated in Fig. 5. The mesh interval instructure was 100
The safety factor of the yield strength was not considered separately because the same load was applied to each case. The analysis was intended as a relative comparison and was applied within the maximum value. The displacement was checked by monitoring the deflection at the center of the beam. The maximum allowance was set to 10
[Table 4] Conditions of material and modeling.
Conditions of material and modeling.
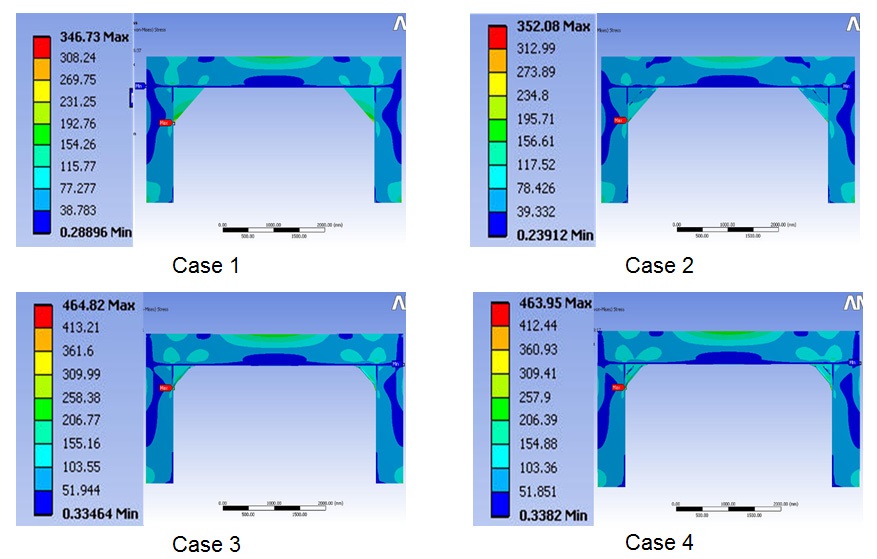
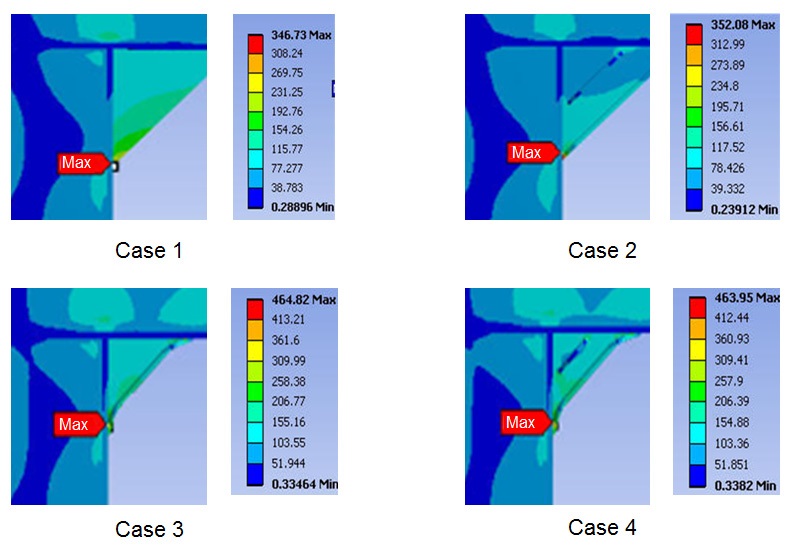
Figs. 6 and 7 present the results of structural analysis of each case under the same load conditions. The load working on the deck was concentrated on the girder, and then transferred to the beam or wall, except for the locally-applied load. Therefore, most of the loads on the bracket at the end, where the girder and beam met, were vertical loads, and the stresses were concentrated on the end of the lower part of the bracket, not on the upper part. The load on the bracket to be installed at the lower part of the beam showed a similar pattern of the load on top but the working point became symmetric.
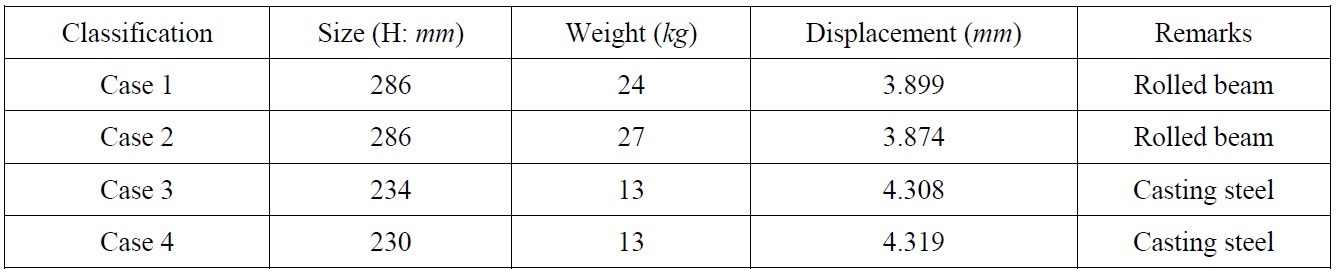
The size of the built-up bracket is dependent on the availability of the face bar and side stiffener as well as on the installation location, and when applying a double circular curve to a slope pattern, a gentle load flow transfer has a greater effect on the maximum stress distribution point, which will move closer to the vertex at the lower part or welding bead when the face bar is installed. For the built-up bracket, the structural stability is increased by installing a side stiffener closer to the slope than to the face bar, whereas most of the load is concentrated on the end part of the slope for the bulb bracket. This suggests that the role of the side stiffener for structural stability is insignificant. For the bulb bracket in cases 3 and 4, which features a double circular curve at the end part of the slope, the load was distributed more uniformly over the entire part compared to cases 1 and 2. As shown in Fig. 6, although the rolled bulb bracket used the same material as the built-up bracket, the decrease in the size and weight was only 40%. Mass production is expected to increase the cost efficiency. The bulb bracket made from cast steel had its size and weight decreased by 20% and 50%, respectively, compared to rolled steel (case 1 versus case 3).
The displacement in all four cases was 5
[Table 5] Properties of each case bracket.

Properties of each case bracket.
MOLD DESIGN AND PROTOTYPE CASTING ANALYSIS
To develop the parts designed in this study, the authors found a material with a carbon content closer to the developed prouct using the MAGMASOFT-V5 Database. As a result, GS16Mn5 was used for casting analysis.
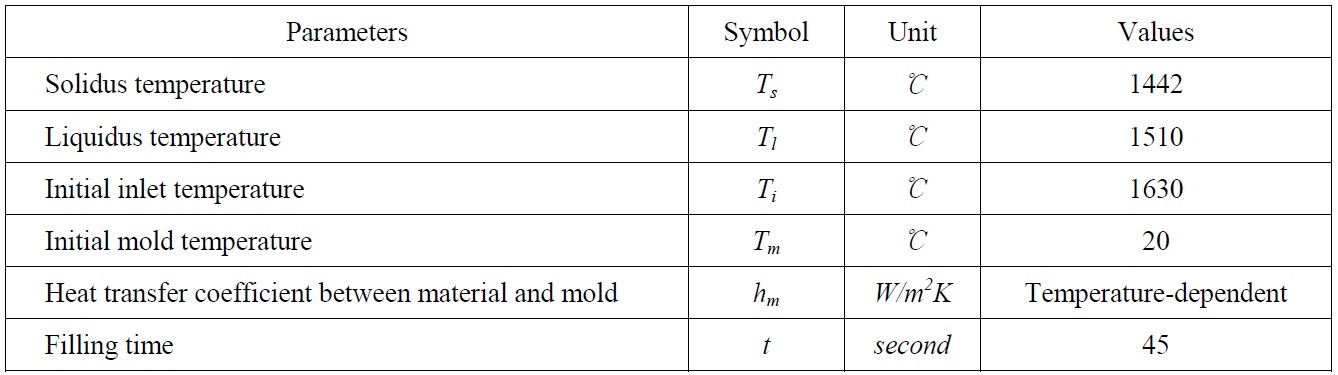
An analysis of the mold material was carried out using Furan, which is similar to artificial silica sand. Furan has higher strength than resin or hardener, provides the accurate dimensions of the mold, and has higher warm strength and caloric power. Moreover, it has superior flexibility when mulling, has less smoke and odor than with organic solvents, and provides more options in terms of price, strength, casting material, and workability. Because it has a wide range of hardener options and low viscosity, Furan minimizes the problems at low temperatures. Mulling and hardening can be improved in the low temperature range by giving the resin high activity. Hardening can be identified by monitoring the changes in mold color. The initial temperature of the molten metal was set to 1,630
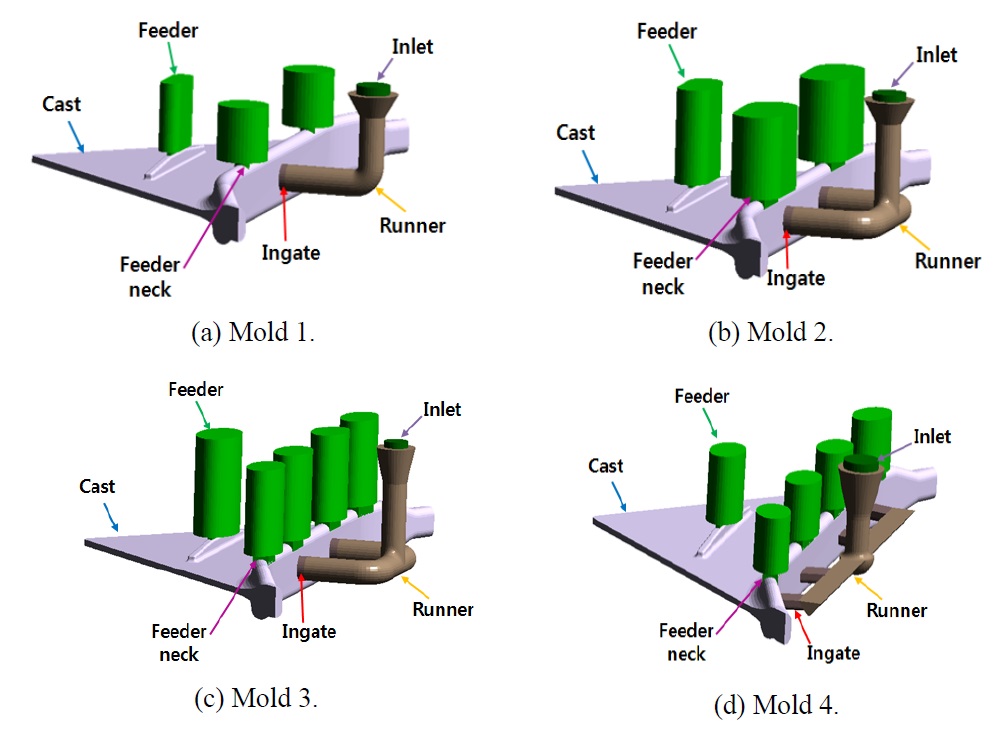
Fig. 10 shows casting methods 1 to 4, which were used to identify the optimal casting method of the bulb bracket. The bulb bracket was relatively thinner than that with other casting steels. Cast steel has poorer flexibility than cast iron. Therefore, the area of ingate, where the cavity is connected directly to the runner, is reduced to increase the speed of molten metal into the cavity for easy charging of the molten metal into the cavity. The casting method was designed through consultation with casting factory experts for an efficient casting process, and by immediately incorporating the casting analysis results into the casting process. What is more important in casting method for bulb bracket is the runner pattern design for smooth flow without gas inflow through turbulent flow from the inlet where the molten metal flows into the cavity and the inlet design to effectively fill the molten metal with low liquidity for casting and a relatively thinner cavity and design of the location and size of the feeder to deal with the contraction, which occurred in the solidifying process of casting steel.
[Table 6] Boundary conditions used in casting solidification analysis.
Boundary conditions used in casting solidification analysis.
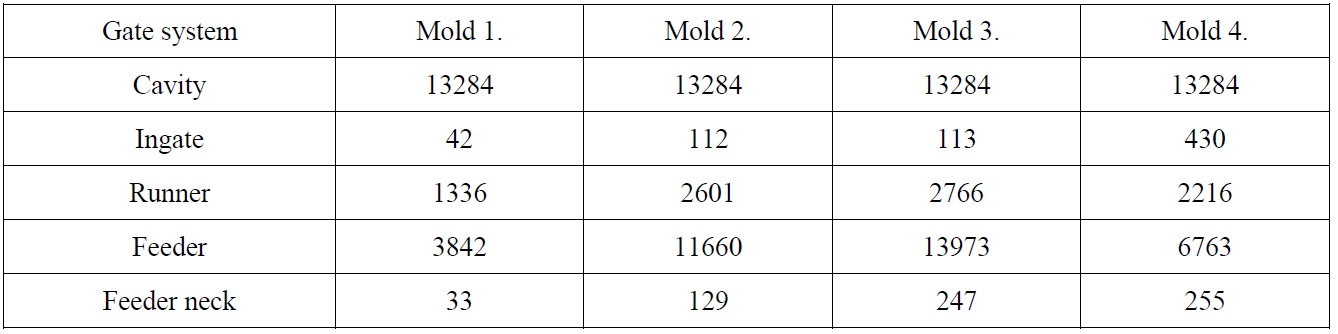
[Table 7] Volume of each region according to the casting design (unit: cm3).

Volume of each region according to the casting design (unit: cm3).
Table 7 lists the design-volume of the parts in casting methods 1 to 4. The volume of the bulb bracket and the cavity volume were identical, and the volume of the runner or ingate varies depending on the casting method. Casting analysis was carried out using different volumes and locations of the feeder to determine the appropriate feeder design for supplementing insufficient molten metal due to solidification contraction. Table 7 lists the volume of the feeder and the volume of the feeder neck that connects the feeder to the cavity.
When the feeder and cavity contact each other, the contact area is expanded, creating a risk of hot spots that can generate pores. The feeder neck functions to reduce such a contact area to move the hot spot inside the feeder instead of the cavity, and cause molten metal in the feeder to move rapidly into the cavity to fill the contracted part with molten metal. If the contact area of the feeder neck is too small, molten metal in the feeder can barely move into the cavity. When the contact area is too large, a hot spot might remain around the cavity or feeder neck. Therefore, the appropriate design is important.
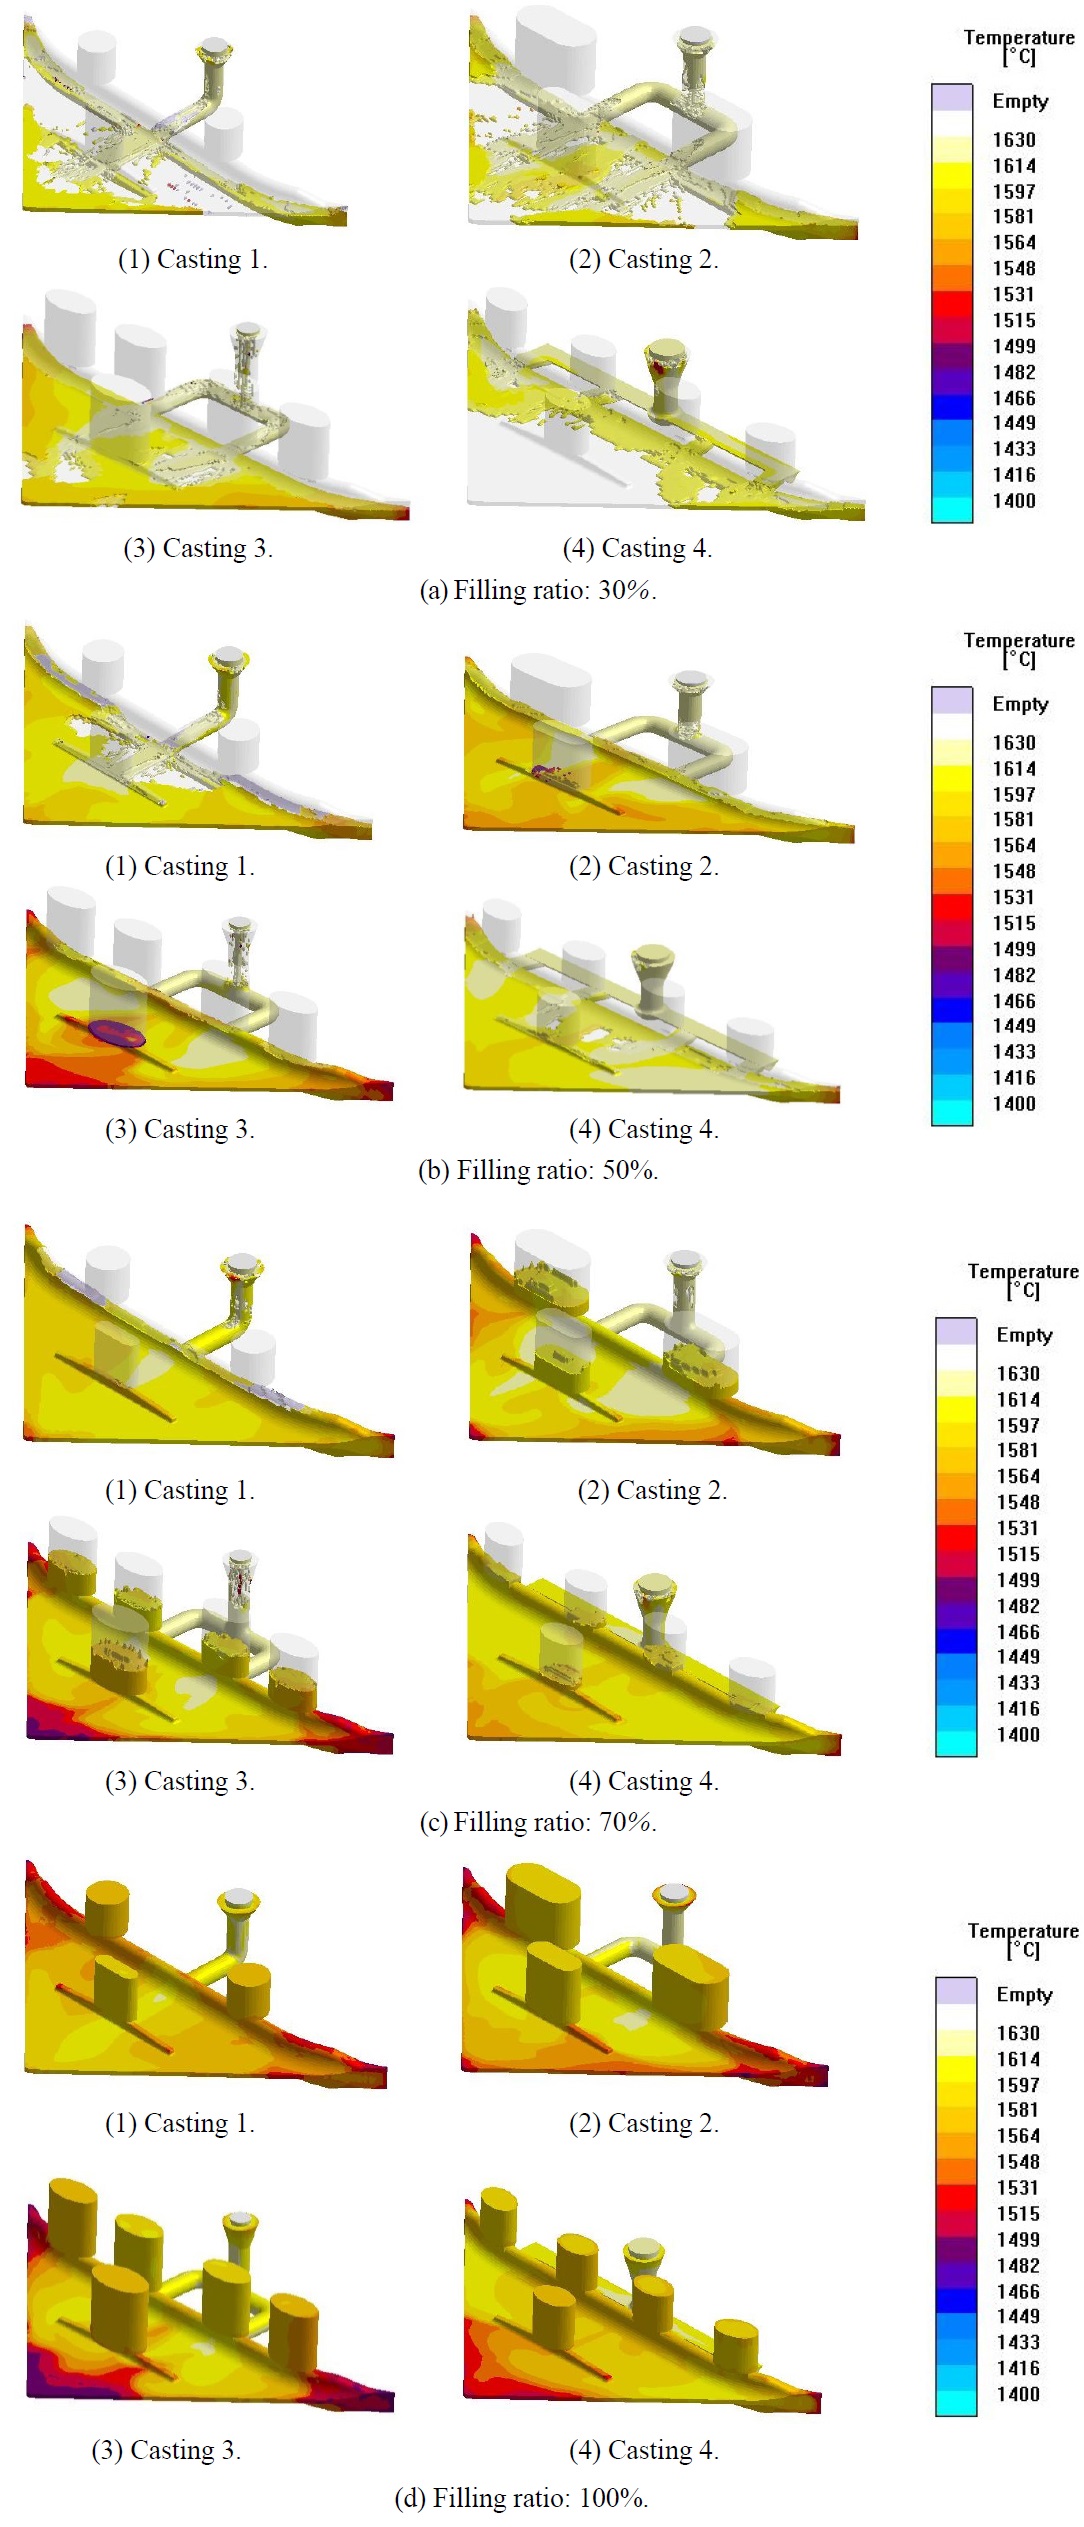
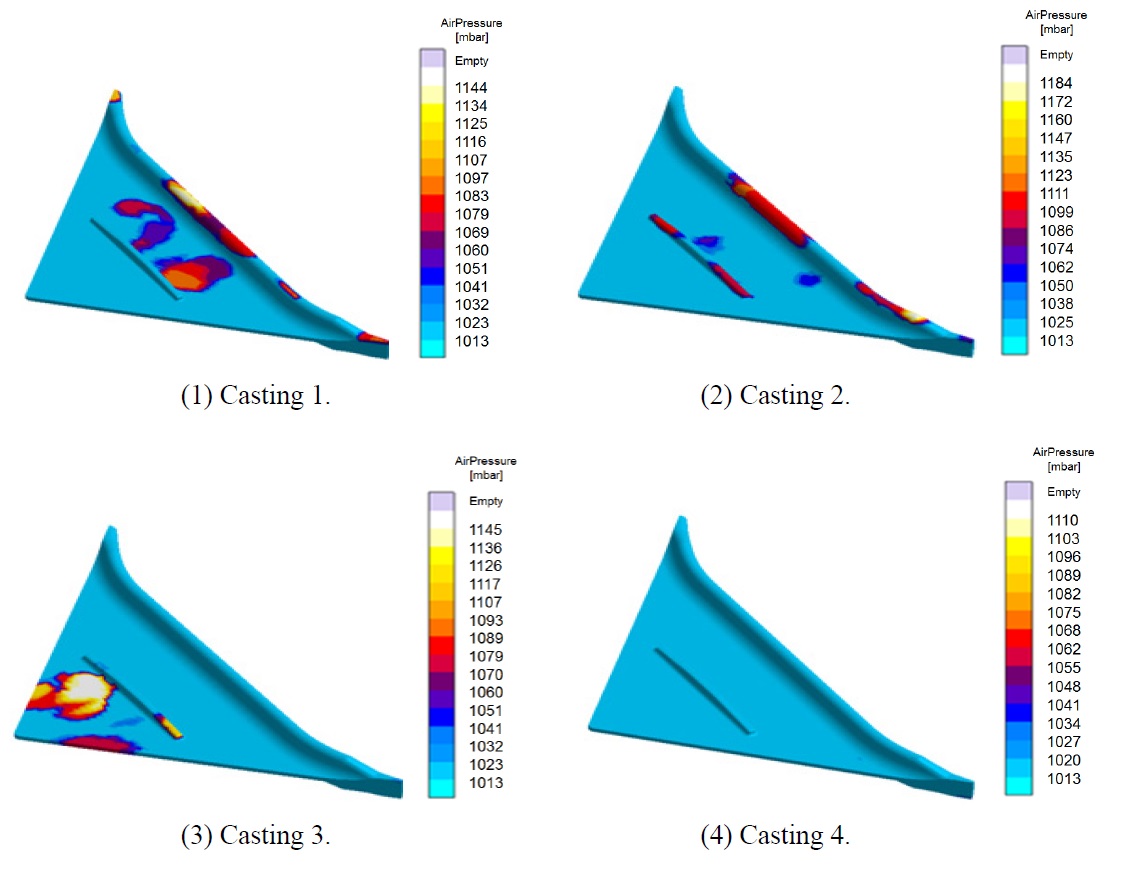
Fig. 11 shows the charging liquidity pattern of each casting method. Viewing the charging liquidity pattern of casting method 1 requiring one ingate at the center, the liquidity in the molten metal after passing ingate filled the vertex of the bulb bracket first at early stages of cavity filling. In this case, the gas remaining in the cavity did not flow out smoothly, causing residual gas to remain at both edges that were filled at a later stage, which resulted in pore generation. For the gas remaining inside to flow out smoothly, it is necessary to provide an air vent at the parts where charging is completed at a later stage and gas solidification occurred by charging molten metal in a liquidity pattern. In addition, it is important to stimulate the flow of molten metal through a redesign of the ingate.
With a view to the fluidity pattern of casting methods 2 and 3 requiring 2 ingates, unlike casting method 1, in which the vertex is filled first, charging was carried out from both edges, not the vertex. By charging from the edges to the vertex, the air vent on the vertex is expected to allow residual gas to flow out. Although the volume was lower compared to casting method 1, charging with molten metal was made later at the center in methods 2 and 3, which also caused the solidification of residual gas.
With the fluidity pattern of casting method 4 requiring four ingates, the molten metal charging pattern was completely different from that of methods 1 to 3. In casting method 4, the molten metal, after passing four ingates, filled the cavity toward the vertex gradually. During this gradual filling, the solidification of residual gas was reduced significantly, and the residual gas flowed out through the air vent on the vertex. The residual gas in the side stiffener (where charging was completed last), and the lugs at both ends at the bottom, could be discharged through the feeder.
According to the fluidity pattern of each casting method, casting method 4 with four ingates showed gradual charging from the ingate, which indicated the most stable charging pattern. Casting method 4, which was designed with four ingates, appeared to be more desirable with respect to performing the casting process.
Fig. 12 shows the air pressure pattern after charging the cavity with molten metal. To prevent residual gas from coagulation by charging liquidity when analyzing the casting, an air vent was installed at the part where gas solidification is likely before casting analysis. For casting methods 1 to 3, the residual gas was not removed completely, which was attributed to gas gathering at the other points where the air vents were not installed.
For the cavity and runner, ingate, feeder, and feeder neck, the design was carried out using the CATIA V5 3-D modeling program. For the air vent, the design was carried out using the analysis program, MAGMAsoft, which resulted in low accuracy. Therefore, the air vent design was not modeled accurately in casting analysis, and gas collection was detected, even at the part where the air vent was installed. The air pressure result might be referred to when determining the air vent location in a casting process.
Fig. 12 shows the air pressure pattern. The pressure increased by heated air expansion at the location where gas gathering was monitored. The MAGMAsoft results revealed the air pressure pattern numerically. Increased air pressure due to gas gathering caused pore generation, which resulted in pore and surface defects. For production quality, air vents to discharge the gas should be provided at the appropriate locations.
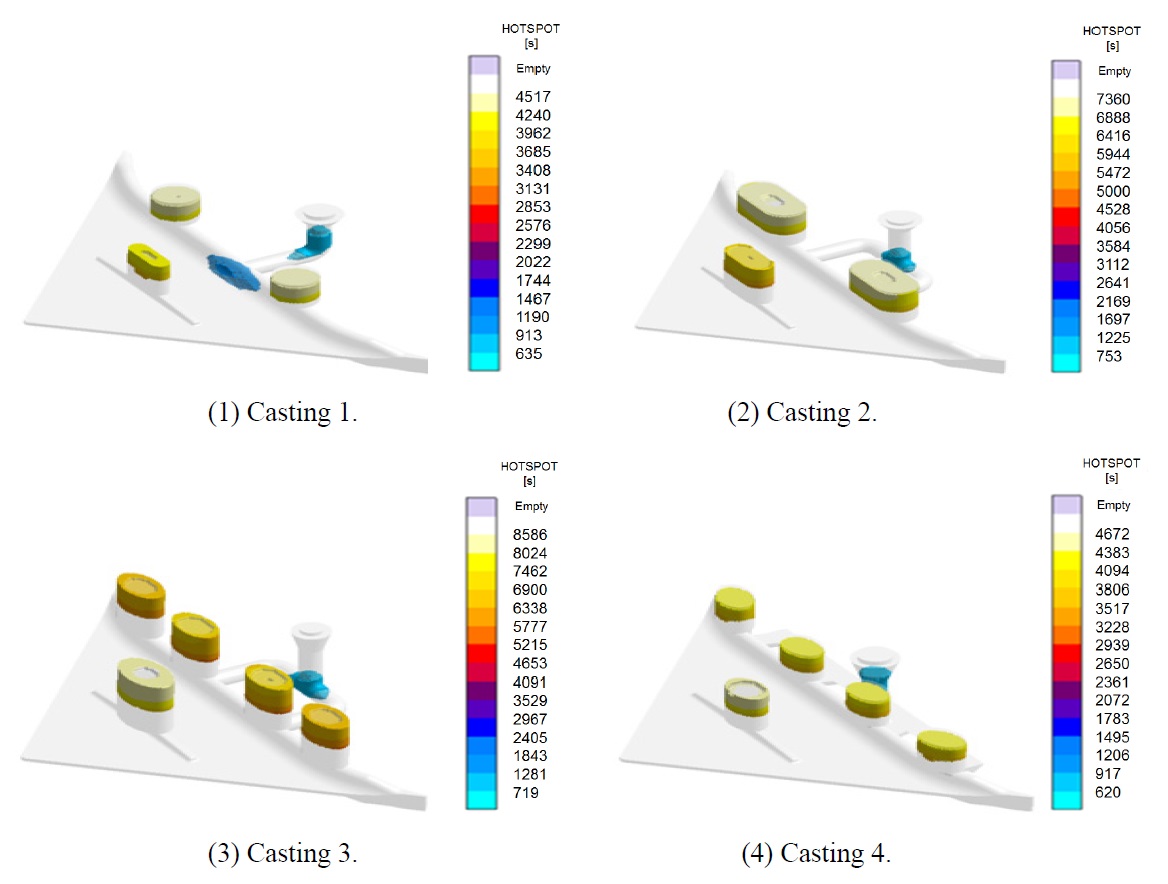
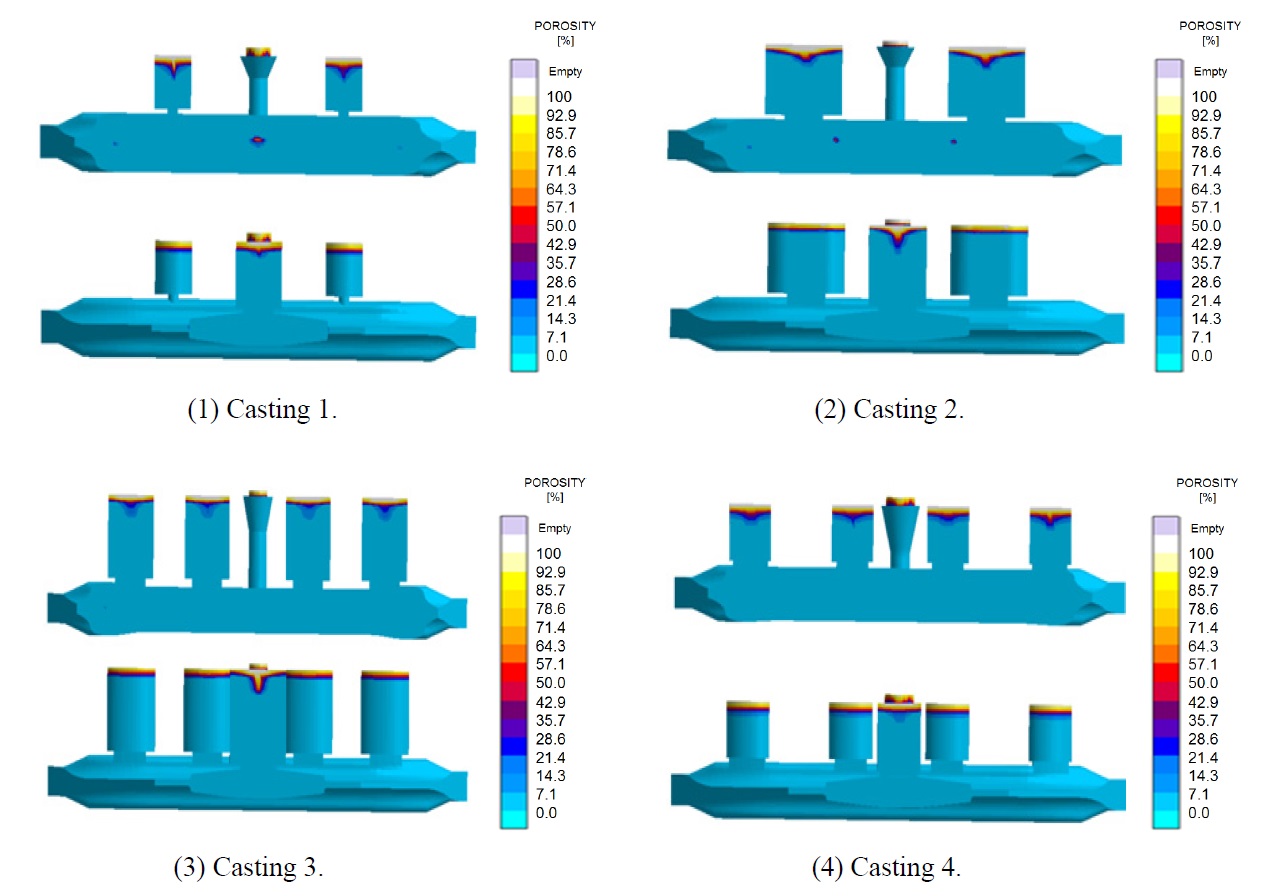
Fig. 13 shows hot spot patterns based on solidification analysis of each casting method. A hot spot, which is combined with air pressure, is the decisive factor causing a defect. The hot spot, when coagulated, indicates a higher temperature than the surroundings. As solidification occurs last, it causes contraction, which leads to porous defects in the product. A final defect analysis was carried out by comparing the hot spot result with the porosity result.
Casting analysis showed that a hot spot on the product could be eliminated by moving the hot spots to the runner part by redesigning the runner and ingate, or by providing a feeder or chiller to the hot spot area. In this study, the aim was to remove the hot spot by changing the design of the runner and ingate while providing a feeder to the hot spot area. After installing the feeder on the side stiffener and lugs on both ends, casting analysis was carried out for casting method 1. The hot spot on the lugs was still monitored. With casting method 2, which has 2 ingates and 2 feeders on the lug, and casting method 3, which has four feeders on the lug, no hot spot was monitored inside the product. The hot spot was moved to the runner part, causing no problems with the product. In the case of casting method 4 with four ingates and four feeders on the lug, no hot spot was monitored inside the product but on the runner part, causing no defect. No hot spot defects with casting methods 2, 3 and 4 were noted. A comparison of the volumes of the feeders showed that the feeder volume of casting methods 2, 3 and 4 was 11,660.8
Fig. 14 shows the porosity pattern after solidification analysis of each casting method. Porosity is represented directly as a defect as a result of casting analysis, suggesting that the pores formed during solidification. The porosity pattern is critical in analyzing casting because another casting method must be sought if porosity exists inside the product. As shown in Fig. 14, the porosity was monitored around the ingates on the lug where the hot spot occurred in casting method 1. Therefore, an improvement in the casting method is needed before starting the casting process.
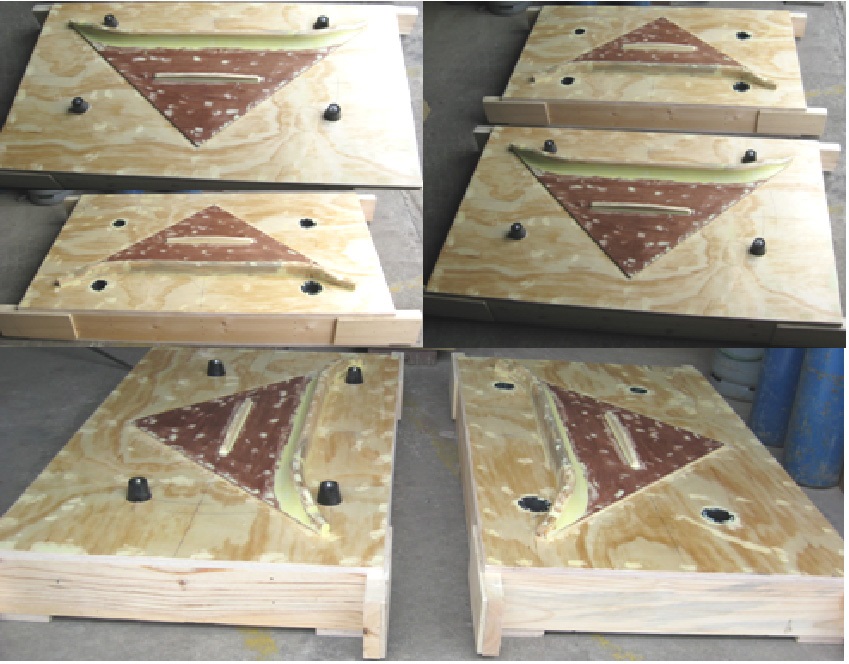
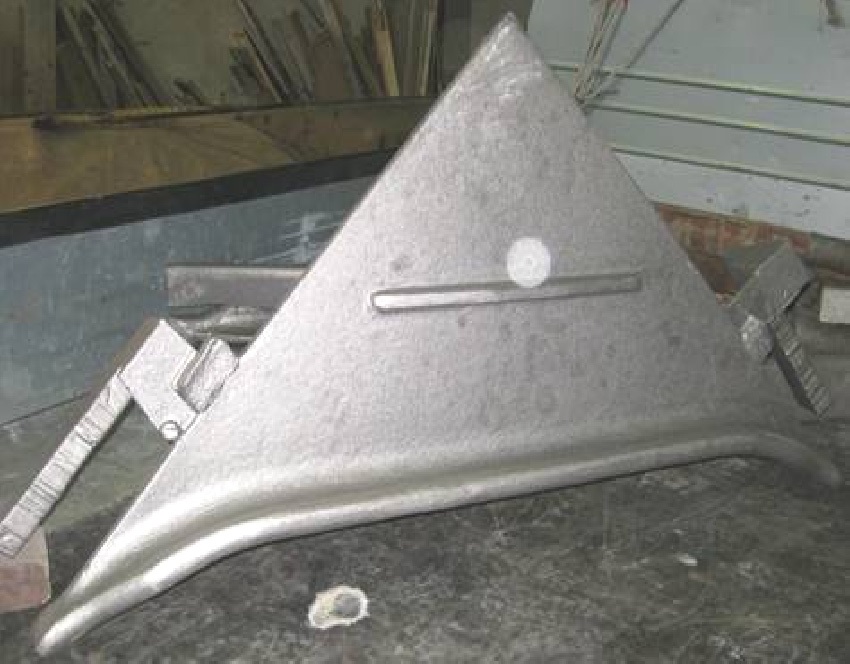
For casting methods 2 and 3, no defects with hot spots were observed. This suggests that the monitoring and measurement need to be improved to prevent potential defects in the casting process. For casting method 4, no porosity pattern was detected, as the case of the hot spot, and quality production is expected. After monitoring the porosity pattern of each casting method, casting method 4 was considered to be the optimal casting process. A wooden pattern model of the bulb bracket was fabricated based on the casting methods using MAGMAsoft. A parting line was separated to the top and bottom model to produce a product with an accurate cavity inside the mold. The parting line of the top and bottom model was determined, and a wooden model was fabricated, as shown in Fig. 15.
CHARACTERISTIC EVALUATION OF BULB BRACKET
Chemical analysis and a mechanical property evaluation of the bulb bracket fabricated by the casting process were performed to determine if the quantitative target had been accomplished. As shown in Fig. 16, two Y-blocks were installed on the side when fabricating the bulb bracket. Chemical analysis of the Y-block was carried out while producing the specimen for the tensile test, impact test and hardness test. A specimen with the same properties was produced for a property evaluation.
Chemical analysis of the bulb bracket was conducted with the specimen taken from the Y-block using a SPECTRO MAX component analyzer. Table 8 lists the chemical component analysis results of the bulb bracket. As shown in the table, the quantitative targets were satisfied. According to Eqs.(1) and (2), Pcm and Ceq were 0.203 and 0.43, respectively, which satisfied the target values of 0.23 and 0.45.
[Table 8] Chemical compositions of the bulb brackets analyzed after casting (%).
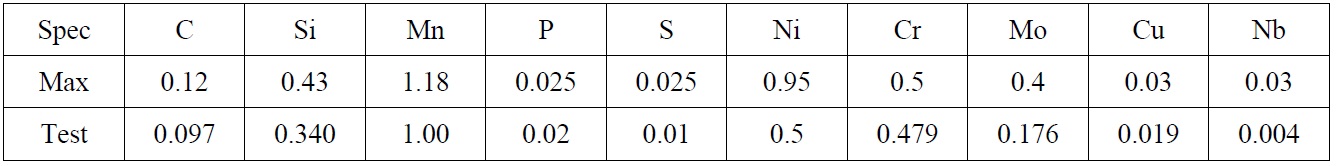
Chemical compositions of the bulb brackets analyzed after casting (%).
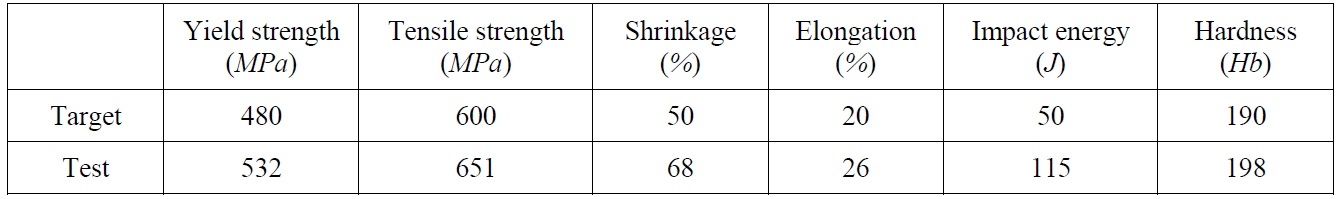
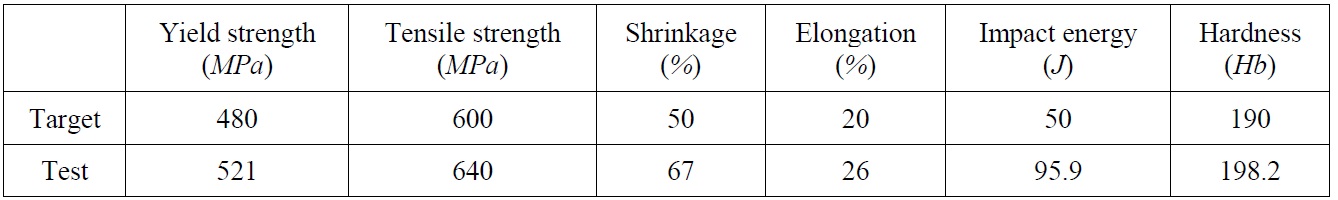
[Table 9] Mechanical properties evaluation results of the bulb bracket (after casting).

Mechanical properties evaluation results of the bulb bracket (after casting).
A tensile strength test was conducted at room temperature using a universal tensile tester, and the specimen was produced in accordance with the ASTM A370 standard. During the tensile test, the yield strength, tensile strength, and elongation mechanical properties were measured. After the test, the contraction percentage area was measured based on the part with the highest value. An impact test was carried out using a Charpy-type impact testing machine. An ASTM E 23 and Type A specimen was adopted according to ASTM E 23 (a standard specimen with a square section (10
A hardness test was carried out using a Brinell hardness tester at room temperature after cutting a Y-block and grinding both sides to make them parallel. The test was carried out three times for each specimen. A tensile test, impact test and hardness test were conducted. As shown in Table 9, the results were all acceptable with respect to the target value.
(1) A low carbon cast steel with carbon content of 0.12% was developed for offshore structural application. For this steel, Pcm and Ceq were estimated to be 0.23 and 0.45, respectively, that indicates a high weldability. The mechanical properties of cast steel satisfied the required target values for offshore structures.
(2) Fabrication of a new type of bulb bracket through a casting process was developed. The optimum design of brackets for strict weight control and the efficient utilization of space in offshore structures were sought. The shape of bulb brackets was designed and decided by ANSYS structural analysis, and it was compared with that of built-up brackets. The bracket with a double circle curved hypotenuse of the triangular type was more effective in comparison with the bracket with a straightline hypotenuse of the triangular type (case 4).
(3) MAGMASOFT was employed to simulate casting process of the designed bulb brackets. Flow pattern was studied for four different casting plans. The optimal casting plan was developed by considering residual gas, hot spots and porosity. A casting plan with four ingates was designed (casting 4).
(4) A bracket was manufactured according to the developed optimal shape and casting process. The chemical composition and mechanical properties of the sample was in accordance with the required properties.