The wild house mouse, Mus musculus, occurring in the Japanese Islands has a short body and white belly, an outward appearance that differs substantially from those in the northern Eurasia lineage, Mus musculus musculus (MUS). Past molecular analyses have indicated that the Japanese wild mouse is a hybrid of the two northern and southern subspecies groups of MUS and M. m. castaneus (CAS) (e.g., Suzuki et al., 1986; Yonekawa et al., 1988, 2012). However, the exact geographic origins of Japanese wild mice are uncertain due to the veiled histories of subspecies groups in East Asia. From our recent phylogeographic work on mice collected over wide areas of the two subspecies groups (Nunome et al., 2010; Suzuki and Aplin, 2012; Suzuki et al., 2013), it is now possible to more accurately pinpoint the multiple places of origin of Japanese mice in the Korean Peninsula and South China. Here we describe recent achievements related to this issue and discuss the possible interpretation of the historical migrations of wild mice from continental areas to Japan.
Phylogeographic studies using mitochondrial cytochrome b (Cytb) (Fig. 1A) and control region sequences have revealed that M. musculus possesses five distinct subspecies lineages, comprising those occurring in West Europe (M. musculus domesticus; DOM), Nepal (un-assigned subspecies; NEP), and Yemen (M. musculus gentilulus), in addition to CAS and MUS (Bonhomme and Searle, 2012; Yonekawa et al., 2012; Suzuki et al., 2013). CAS consists of four sublineages (CAS-1 to -4) that originated in the late Middle to Late Pleistocene (100,000-200,000 years ago), with a trend of confined distribution ranges around the eastern part of the Middle East,
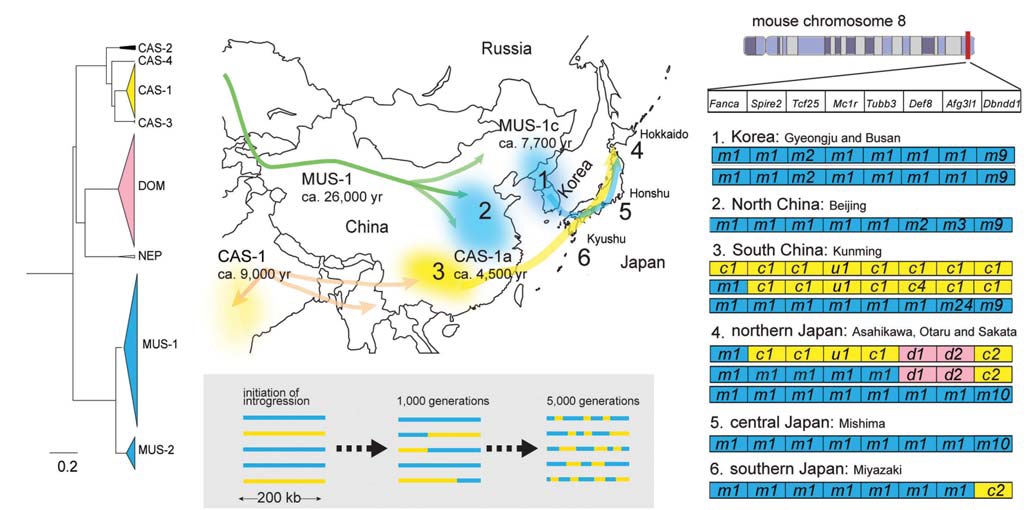
[Fig. 1.] Evolutionary history of mice in East Asia. (A) Cytb phylogenetic tree determined using a Bayesian MCMCMC method with the
program BEAST v. 1.7.4. Triangles represent collapsed subclades of wild mice subspecies groups. (B) Hypothetical migration routes
of two MUS-1 and CAS-1 sublineages. Times on the map indicate estimates for population expansions based on Cytb sequences,
assuming a mutation rate of 8.5% per million years per lineage. Arrows on the map indicate temporal migration routes of Mus
musculus musculus (MUS) and Mus musculus castaneus (CAS) inferred from mtDNA data. The numbers from one to six are locality
numbers where representative haplotypes of nuclear genes were obtained as shown in Fig. 1D. (C) A schematic illustration for intact
haplotype degradation of MUS (blue bar) and CAS (yellow bar) through generations by chromosomal recombination, assumed to
occur at a rate of 0.52 cM/Mb (Jensen-Seaman et al., 2004). This rate means one recombination event in a 200 kb genomic region
in 1,040 generations. Thus, it can be assumed that 5,200 generations will produce five recombinations in a 200 kb genomic region.
(D) Representative haplotypes from China, Korea, and Japan discovered in Nunome et al. (2010). The letters “m”, “c”, and “d” in
boxes represent MUS-, CAS-, and Mus musculus domesticus (DOM)-type alleles of eight linked genes within a 200 kb region on
mouse chromosome 8. The letter “u” refers to the alleles that could not be assigned to a particular type of subspecies. Haplotypes
in Japan contain genomic fragments from three subspecies that suggest ancient contacts of the subspecies there.
except for CAS-1, which appears to have spread rapidly during prehistoric times from a source region somewhere in India to the far eastern periphery of the CAS territory, including South China and Japan (Suzuki et al., 2013). Notably, the CAS-1 sublineage has low nucleotide diversity, which is consistent with the recent phylogeographic work on the castaneus subspecies group by Rajabi-Maham et al. (2012); see also Bonhomme and Searle (2012). Notably, network analyses depict a sub-cluster (“CAS-1a”) that harbors haplotypes from northern Japan (Hokkaido and northern Honshu), South China (Kunming and Guilin), and South Sakhalin. The presence of the subgroups is suggestive of a stepwise historical range expansion of CAS-1. The expansion time of the Cytb haplotypes, at a relatively higher mutation rate (e.g., 8.5% per million years per lineage), was roughly estimated to be 9,000 and 4,500 years ago for CAS-1 and CAS-1a, respectively (Suzuki et al., 2013; Kuwayama et al., unpublished) (Fig. 1B).
We suspect that the expansion of CAS-1 mice reflected ecological transformation of the landscape by early agriculturalists and the emergence of urban centers and trade networks, as in the case of the Middle East populations of M. musculus (Auffray et al., 1990; Cucchi and Vigne, 2006). There is good evidence for domestication of cereal crops, including rice and millet, by about 9,000 years ago in South and East Asia (Khush, 1997; Londo et al., 2006; Liu et al., 2007; Molina et al., 2011). Thus, the CAS-1 range expansion may be associated with the spread of cereal cultivation in these regions (Suzuki et al., 2013). With regard to the CAS-1a group expansion, it is of interest to note recent molecular and archaeological evidence for the origin of cultivated rice (Fuller et al., 2010, 2011; Huang et al., 2012). Archaeological studies have found that 4,000 years ago rice cultivation had spread to the nearby Yunnan province where Kunming is located (Fuller et al., 2010, 2011). An intensive genome survey on wild and cultivated rice suggested that southern China is the place of origin of cultivated rice in Asia (Huang et al., 2012). Thus, it is reasonable to believe that the CAS-1a group expanded its range in association with the spread of rice culture from South China to a wide area of East Asia including the Japanese Islands.
The MUS lineage consists of two sublineages, major(MUS-1) and minor (MUS-2) groups, which cover a broad range of North China and Russia, with an estimated divergence time of 150,000 years ago (Suzuki et al., 2013). Cytb sequence analyses have provided evidence for rapid population expansion of MUS-1, with an estimated time of 26,000 years ago at a mutation rate of 8.5% per million years per lineage (Suzuki et al., 2013) (Fig. 1B). This suggests an ancient residence of the MUS mice in north China and the Korean Peninsula, before the predicted ancient expansion of CAS-1 in the northern part of its range. In addition, the MUS-1 sublineage can be further subdivided into three subgroups. One subgroup, “MUS-1c,” exclusively integrated haplotypes from Japan, Korea and its nearby continental areas, northeast China, and southern Primorye, Russia. It is interesting to note that the estimated expansion time of MUS-1c, about 7,700 years ago, is somewhat comparable to that of CAS-1 (Suzuki et al., 2013).
Our mitochondrial DNA analyses clearly indicated that the mitochondrial DNA of Japanese wild mice originated from southern China and the Korean peninsula, for CAS and MUS, respectively. However, we must carefully consider the timing of the introduction of each of these two components into Japan. To investigate the order of the migration of Japanese MUS and CAS lineages, we calculated the mean genetic distances between haplotypes from the predicted source areas of the continent and Japan using the Cytb sequences with Kimura-2-parameter (K2P) genetic distance. The mean genetic distances between the continental and Japanese groups were 0.02 and 0.001 for the CAS and MUS subgroups, respectively (Kuwayama et al., unpublished). Thus, we suggest that CAS arrived in Japan prior to MUS. The recent MUS migration from the Korean peninsula to Japan is likely to be associated with the peopling of Japan a few thousand years ago. Phylogenetic analyses using Y chromosomal and mitochondrial markers of Japanese people have consistently indicated an immigration of Japanese people from Korea during the Neolithic period (Tanaka et al., 2004; Hammer et al., 2006).
Our previous phylogeographic study focusing on haplotypes of linked autosomal genes highlighted the concealed evolutionary history of Japanese wild mice (Nunome et al., 2010). In that study, we examined eight linked genes in a 200 kb region of chromosome 8 and assigned the alleles into three subspecies groups (DOM, CAS, and MUS) and disclosed haplotype structures defined by the combination of the eight genes and their geographic distributions. The majority of mice from Japan have a MUS-specific haplotype. Interestingly, a minor proportion of mice, particularly those from northern Japan, have “recombinant” haplotypes, in which CAS alleles or CAS+DOM alleles are embedded in the 200-kb MUS haplotypes.
The existence of small CAS segments within the MUSlike haplotypes implies that a number of generations existed after the hybridization events between the CAS and MUS groups in Japan (Fig. 1C). Hybridization time has been estimated to be a thousand generations (Nunome et al., 2010), providing concrete evidence that the “recombinant” haplotypes resulted from a historical event in ancient times and were not due to stowaway introduction during the modern age. The results of mitochondrial and nuclear gene analyses allowed us to predict that two areas of the continent, South China and the Korean peninsula, are the primary source areas of Japanese wild mice. A CAS subgroup would have arrived in Japan from southern China as a precursor to mice in Japan. Then, a MUS subgroup subsequently entered Japan from the Korean peninsula, perhaps a few thousand years ago, and mixed with the existing Japanese CAS populations.
Notably, the Japanese CAS components in the nuclear genome are likely to be unique and to differ from those of other CAS territories, including South China. Allele types of Dbndd1, for example, differ between northern Japan (allele “c2”) and other areas (allele “c1”) (Fig. 1D). Phylogeographic analyses using nuclear genes have revealed the presence of the East European DOM within a CAS segment of the haplotypes from northern Japan, implying the presence of hidden evolutionary episodes of the CAS migration from the continent to Japan (Nunome et al., 2010) (Fig. 1D). Thus, to further understand the histories of mice in eastern Eurasia, an intensive geographic survey to identify the unassigned CAS and DOM fragments incorporated into the haplotypes from northern Japan is desirable.
The ranges of the three M. musculus subspecies, particularly in the eastern part of Eurasia, have not been finely determined and their evolutionary history remains unclear. Phylogeographic analyses of wild mice from the Japanese Islands, the terminal regions of several different migrations from west to east, and those from the two source areas of South China and the Korean Peninsula, provide a valuable foundation for building a comprehensive view on the evolutionary history of the house mouse, Mus musculus, and highlight hidden episodes of ancient peopling and agricultural development in East Asia as well.