A man's feet, a limb made up of 26 bones, 38 muscles and over 100 ligaments and tendons intricately intertwined, plays important roles of supporting and moving the human body(Lee & Kwon, 2008). Moreover, a body part holding up the entire body weight, a man's feet should fit the footwear perfectly. In case the footwear is either too tight or too loose with much room to spare, it could cause the wearer to feel uncomfortable to get about in it. Wearing the right type and size footwear noticeably affects overall health of the body as well as that of the feet(Choi, 2012). Accordingly, if we are to manufacture a footwear tailored to the shape of the feet that enables them to play their functions properly, it is necessary to categorize types of feet and set down criteria for classifying them (Park, 2002). The sole of the feet is one of the most important elements of walking, and wearing an ill-fitting, wrong pair of shoes causes uncomfortableness and fatigue. In order to improve the way soles of shoes are designed, it is necessary to develop soles and insoles that perfectly fit the feet. Accordingly, it is essential to categorize soles of feet by type. The elderly in particular, who find it difficult to balance themselves due to lack of agility and slowing reflexes, are increasingly exposed to accidents, and due to changes in the bone tissue, a minor accident that happens to the elderly could cause a serious fracture(Park & Chae, 2008). In addition, since the elderly are much more dependent on shoes as an auxiliary means of protecting their feet than other age groups are, it is essential to offer footwear particularly tailored to the elderly by taking into consideration the way the elderly walk about. This makes it essential to study shapes and types of feet and soles of feet in order to design shoes suited to the elderly. Preceding studies on shapes of feet include categorization of feet of the elderly females and those on the system of footwear sizes(Jung & Lee, 2001; Park, 2003; Park, 2005; Park & Chae, 2008). Included in the studies on categorization of males' feet is a study now under way by Size Korea that makes use of 3-dimensional data(Lee & Kwon, 2008; Seok & Park, 2007; Seok et al, 2009). Studies on categorization of shapes of soles of feet include a study using footprint(Choi, 1998; Jung, 2001; Seong, 1997) and one using a scanning approach(Park, 2005) is now under way. With the majority of such studies targeted at elderly females, studies on the elderly males are few and far between, and virtually no study is now under way on categorization of soles of feet of the elderly males using ratios and indices.
Therefore, this study proposes to measure the soles of feet of the elderly males by using a 2D scanner, categorize types of the soles of feet using ratios and indices of the length of the feet, and analyze their traits by type in an effort to supplement functions of the feet, while providing basic data for the manufacturing of soles and
[Table 1.] Subjects distribution by age groups
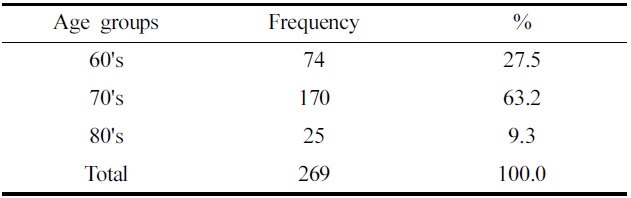
Subjects distribution by age groups
insoles of shoes designed to improve the fitness of the feet to the shoes.
2.1. The subjects of the study
The subjects of the study were 269 elderly men over 60 of age living in Gwangju. Table 1 shows the age groups distribution of the subject. They were measured during the months from July 10 to July 18 2012, and their right feet were measured indirectly by using 2D scanner.
2.2. Measurement methods and items
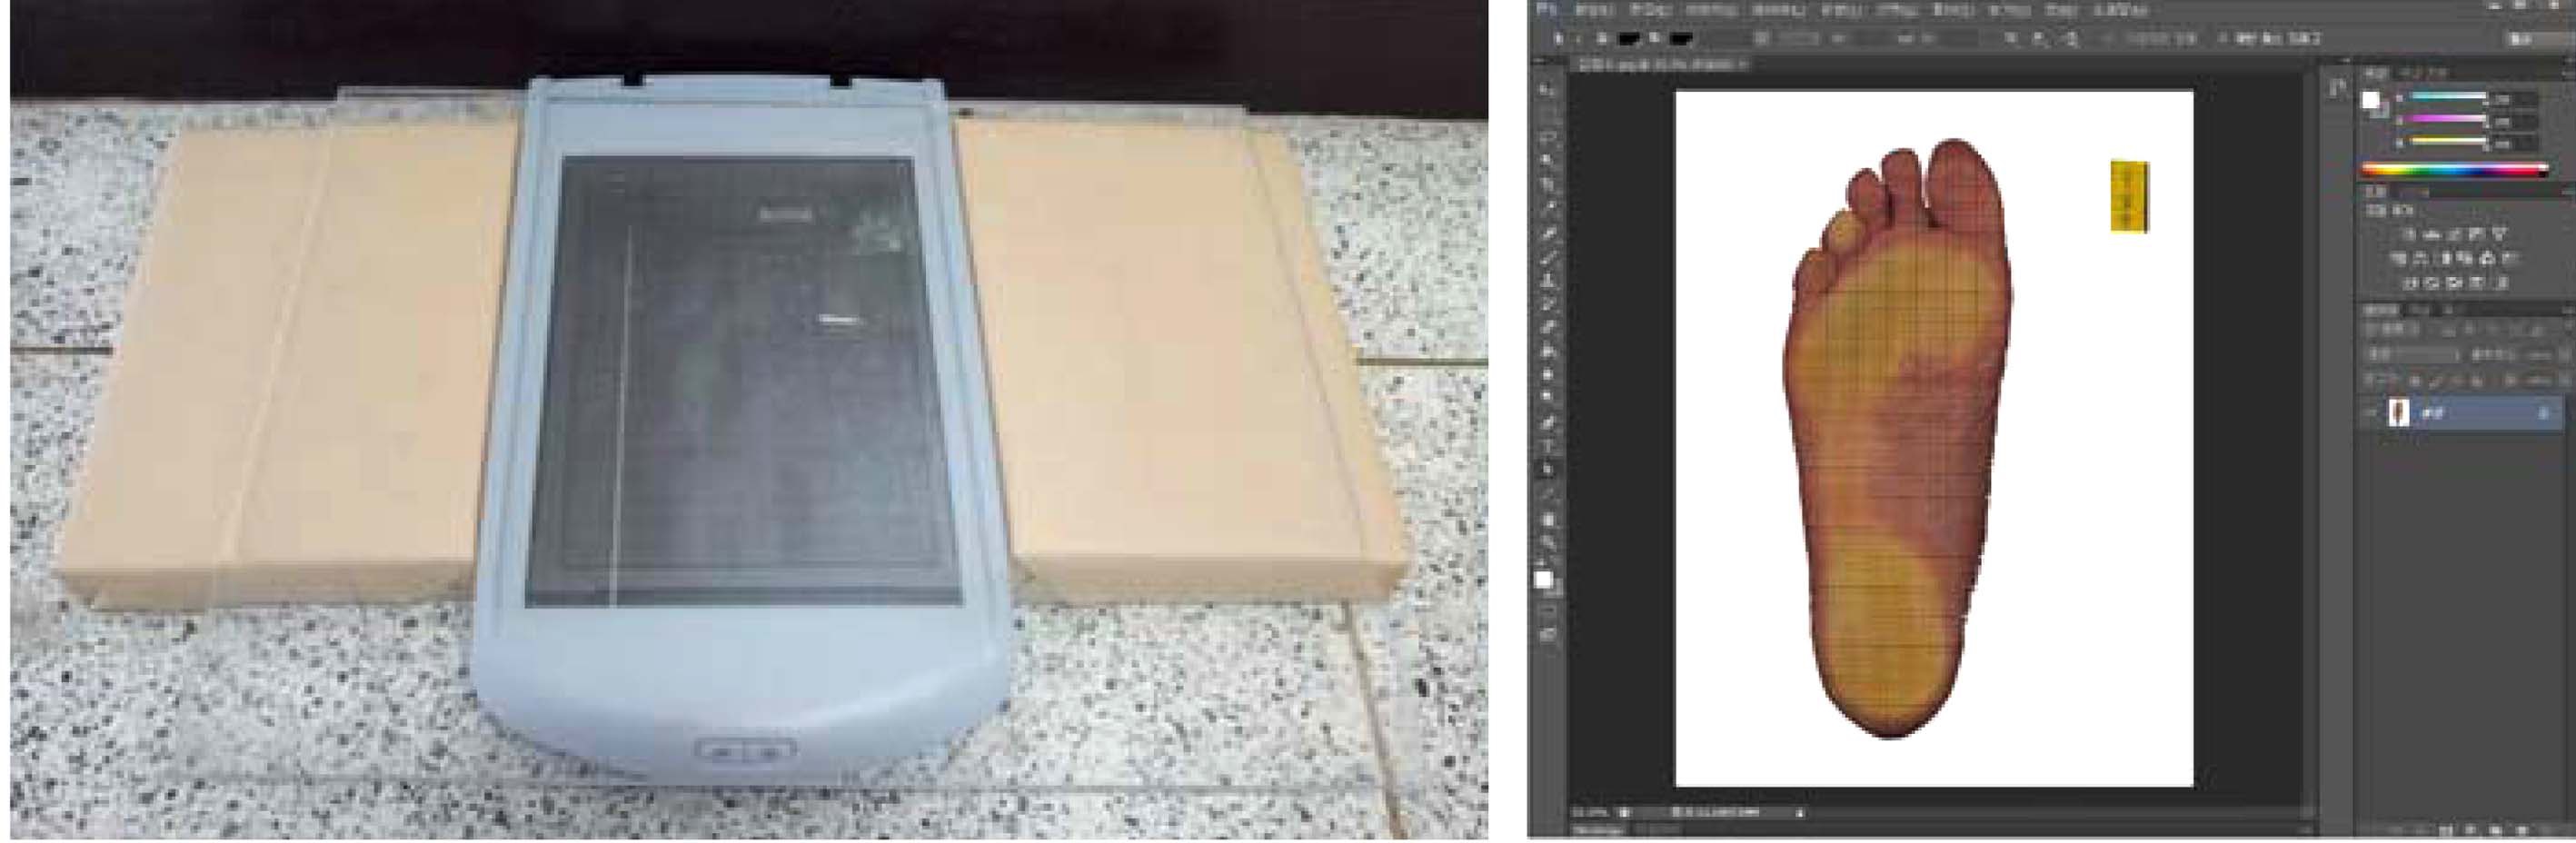
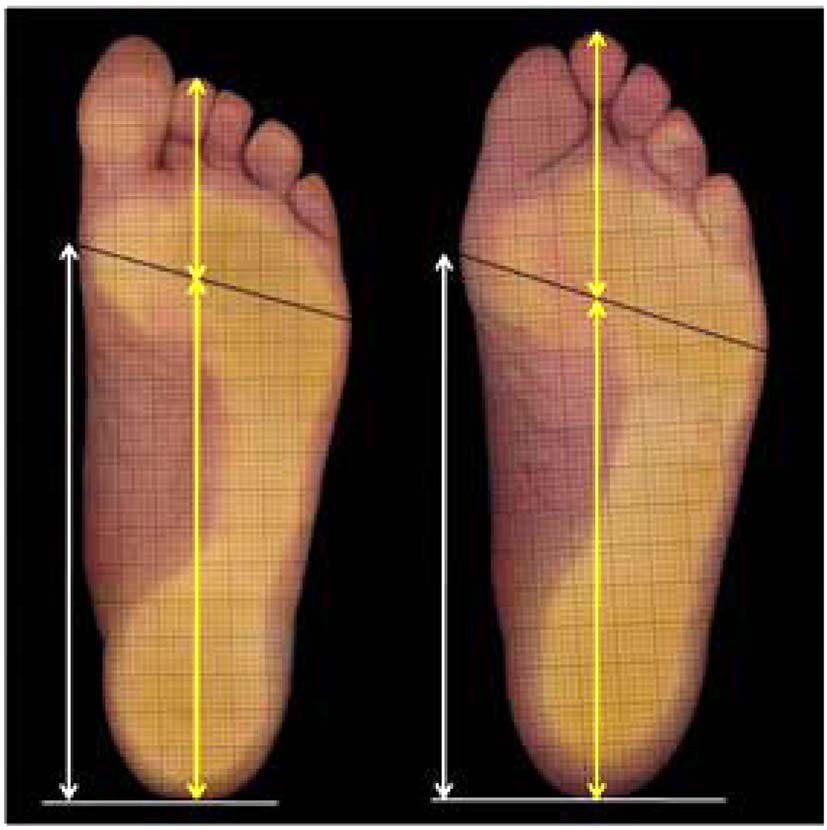
The soles of feet were measured using a scanner so that shapes of the soles of feet were precisely grasped, with the aid of a measuring device having props on both sides of a flat scanner (HP Scanjet G2410) on which a transparent acrylic plane was laid, modeled on an idea from a preceding study by Park (2003). HP Scanjet G2410, the scanner used for this study, is a CCD type featuring a maximum optical scanning resolution of 1200 dpi. Specifications of the scanner are shown in Table 2.
For an ideal measuring posture for scanning the soles of feet, the left foot was placed on the prop and the right on the scanner, thus balancing the body weight evenly between the two feet, with the tip of the feet facing the front. A sheet of graph paper was attached on to the acrylic plane for use when calibrating. For a vivid contour line, a black cloth was spreaded over the right foot. Scanned data were printed out to actual sizes with the aid of Adobe Photoshop CS6 and thus directly measured.
[Table 2.] HP Scanjet G2410 Scanner specification
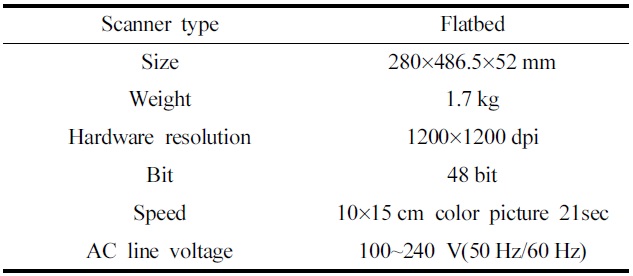
HP Scanjet G2410 Scanner specification
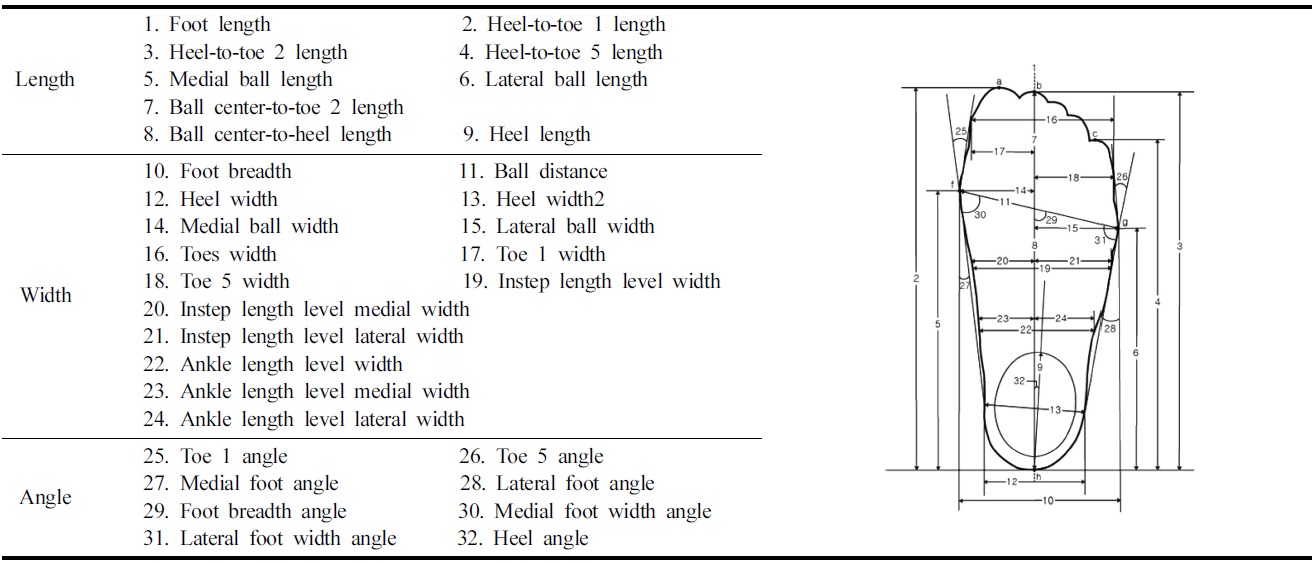
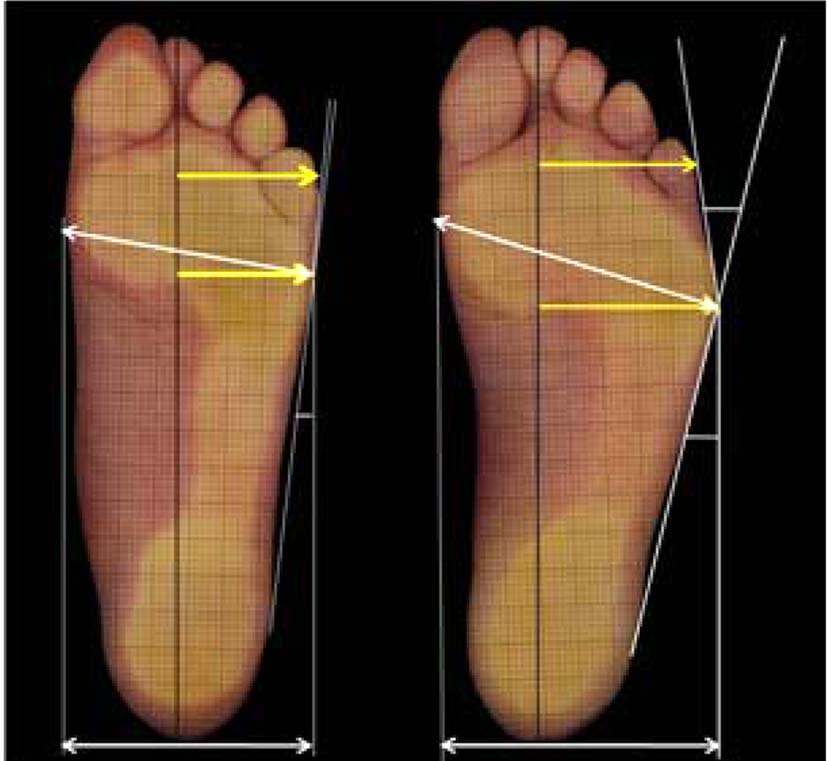
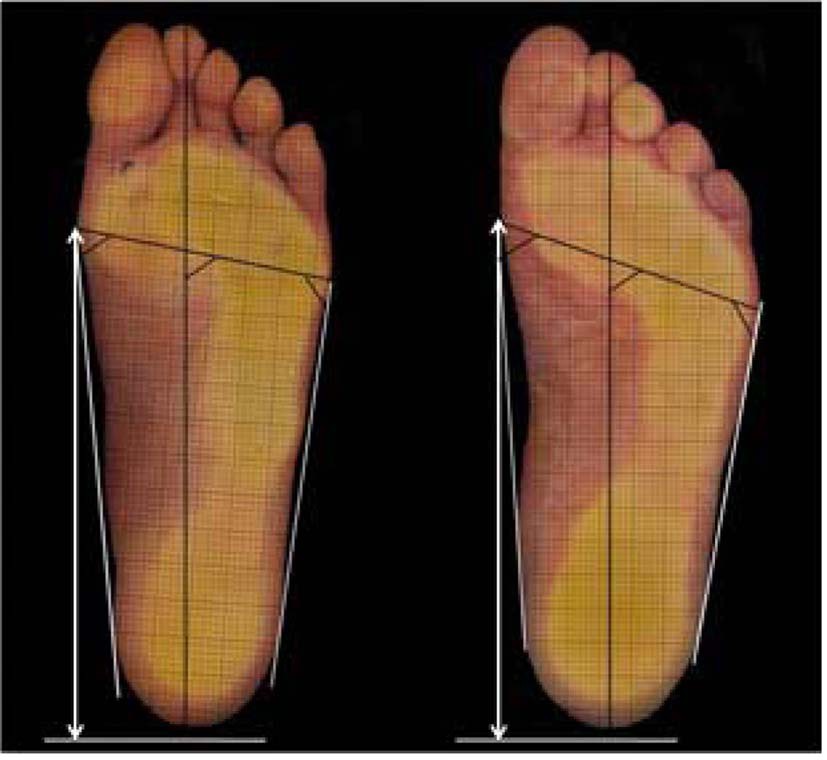
For the establishment of the indirect measuring items of shapes of the soles of feet by means of the soles of feet scanning, a preceding study(Park, 2003) was consulted, with 9 items, 15 items, and 8 items under the dimensions of length, width, angle items, respectively, totalling 32 items.
Specific points and lines of reference, indirect measuring items and the methods are shown in Table 3.
Data from the findings of the study were processed statistically by using SPSS 19.0 Package. To extract factors associated with shapes of the soles of feet, an analysis of factors were conducted and information the measured values have was summarized. For the criteria whereby to determine the number of factors, the decision was made at the point where the Eigen value exceeds 1.0 and explanation ability does not noticeably change. To make extracted factors and the factor loading of each variable clear, extracted factors were orthogonally rotated by a Varimax method, thus getting at what the factors are all about. To group shapes of the soles of feet by type, a cluster analysis was conducted with each factor extracted from the result of a factor analysis as an independent variable, and for the criteria whereby to measure similarities between specimens, a Euclidean distance measuring method was adopted, and the subjects were clustered by means of a hierarchical technique.
In addition, in order to probe into the traits of the soles of feet of the group distinguished by a group analysis, factor scores, measured values index value of major measuring items and the absolute

Measurement items
value were verified by means of technical statistics by item and ANOVA analysis. For the items that are thought to show statistically
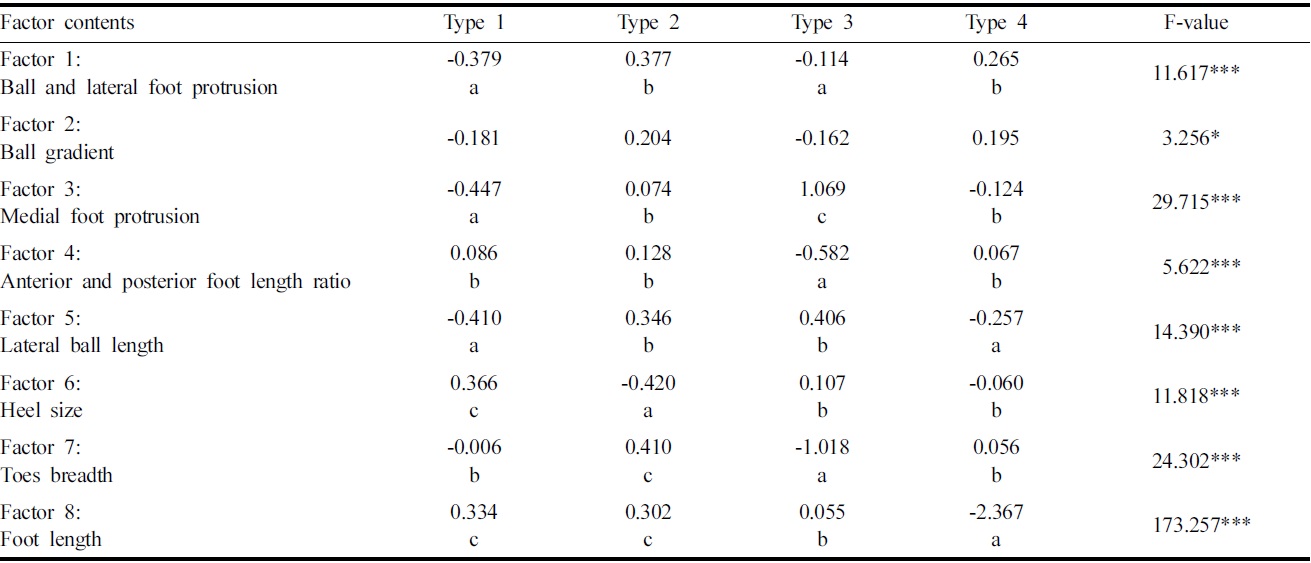
[Table 4.] Factor analysis of elderly men's sole
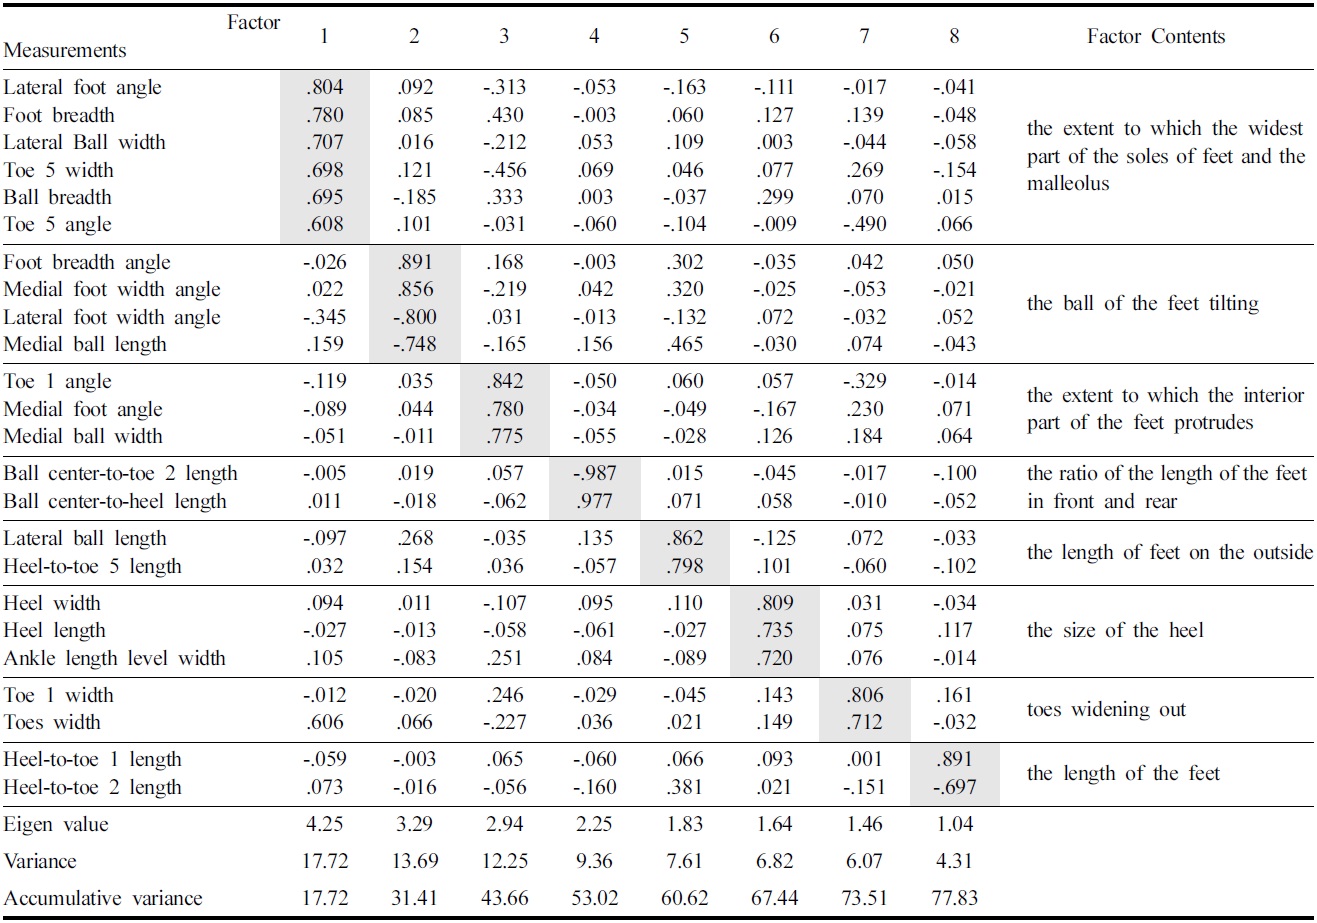
Factor analysis of elderly men's sole
significant differences between groups, differences between the groups were compared and examined by means of the Duncan's multiple range test.
3.1. Factor analysis of sole shape
Before categorizing the types of the soles of the feet of elderly males, an analysis of factors was conducted to extract factors related with shapes of the soles of feet of elderly males. For the items used to this end, index values for the length of feet for all items were used except the angle item in order to exclude factors of the size of the soles of feet, and 24 items were finally used as factors essential to silhouette embodiment except items that were indistinct as to the factor loading. To make the nature of factors clear, 8 factors were extracted, and the factor loading of each factor is shown in Table 4.
These eight factors explained 77.83% of the total variance. In order to look into the features of each factor, to clarify the characteristics of the factors, factor score for each factor value of the minimum and maximum were compared with a sole shape(Fig. 2~9).
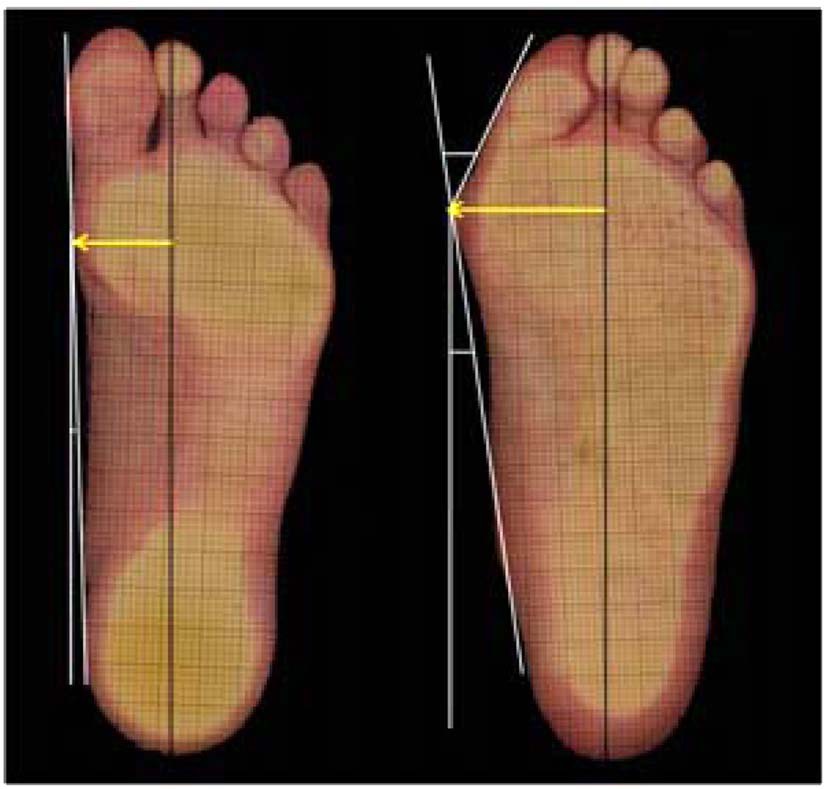
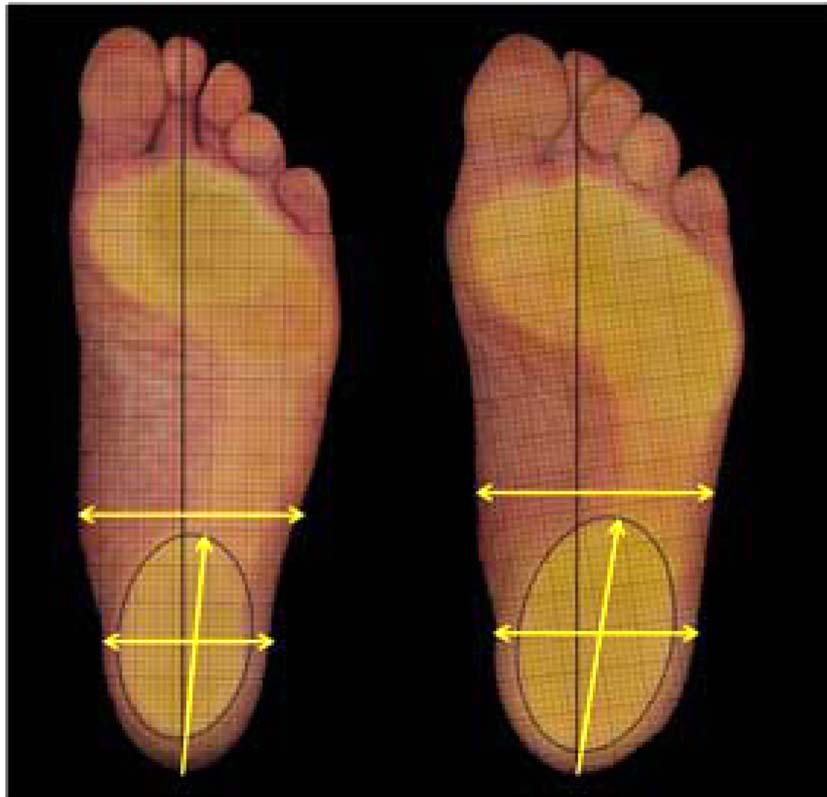
The measurement items expressing meaningful factor loadings in factor 1 are ‘lateral foot angle’, ‘foot breadth’, ‘lateral ball width’, ‘toe 1 width’, ‘ball distance’, ‘toe 5 angle’. Factor 1 shows the factor of the extent to which the widest part of the soles of feet and the malleolus. The Eigen value is 4.25, it explains 17.72% of the total amount of variance.
The measurement items expressing meaningful factor loadings in factor 2 are ‘foot breadth angle’, ‘medial foot width angle’, ‘lateral foot width angle’, ‘medial ball length’. Factor 2 shows the factor of the ball of the feet tilting. The Eigen value is 3.29, it explains 13.69% of the total amount of variance.
The measurement items expressing meaningful factor loadings in factor 3 are ‘toe 1 angle’, ‘medial foot angle’, ‘medial ball width’. Factor 3 shows the factor of the extent to which the interior part of the feet protrudes. The Eigen value is 2.94, it explains 12.25% of the total amount of variance.
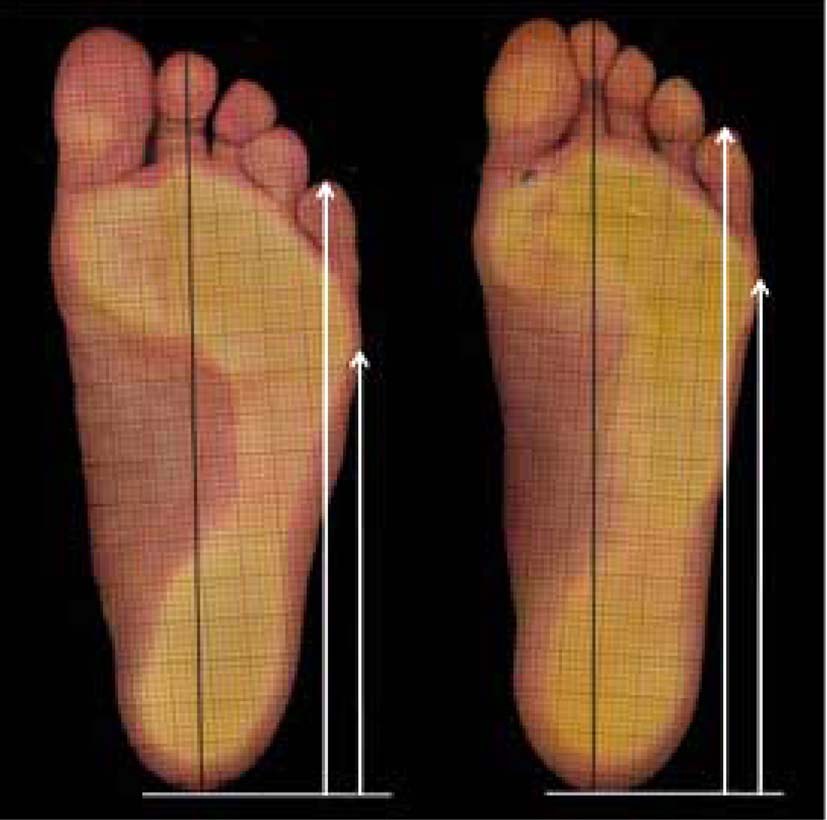
The measurement items expressing meaningful factor loadings in factor 4 are ‘ball center-to-toe 2 length’, ‘ball center-to-heel
length’. Factor 4 shows the factor of the ratio of the length of the feet in front and rear. The Eigen value is 2.25, it explains 9.36% of the total amount of variance.
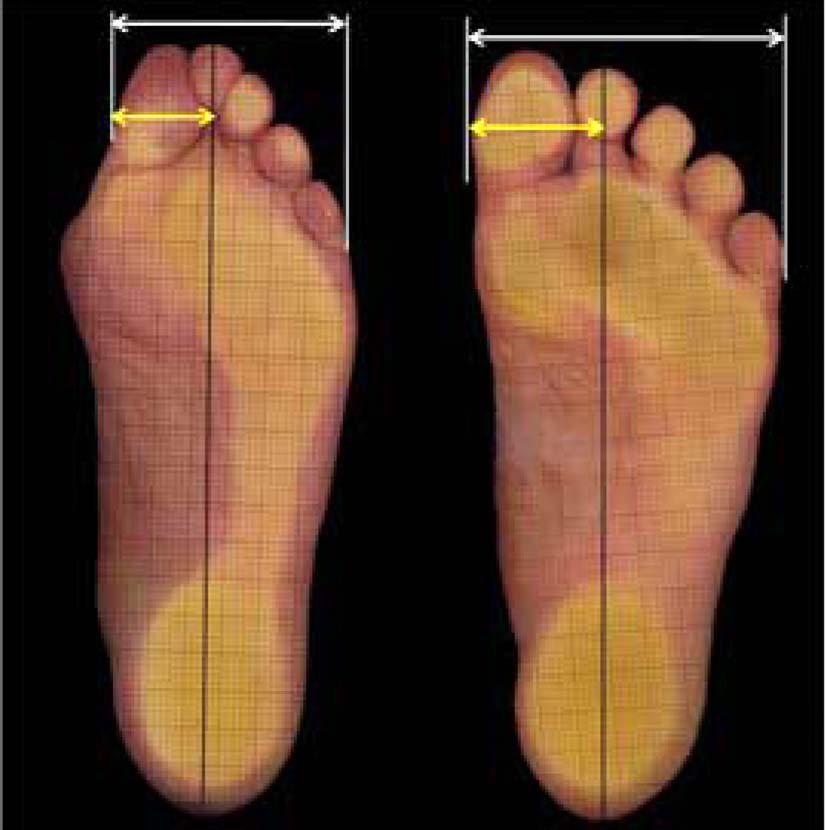
The measurement items expressing meaningful factor loadings in factor 5 are ‘lateral ball length’, ‘heel-to-toe 5 length’. Factor 5 shows the factor of the length of feet on the outside. The Eigen value is 1.83, it explains 7.61% of the total amount of variance.
The measurement items expressing meaningful factor loadings in factor 6 are ‘heel width’, ‘heel length’, ‘ankle length level width’. Factor 6 shows the factor of the size of the heel. The Eigen value is 1.64, it explains 6.82% of the total amount of variance.
The measurement items expressing meaningful factor loadings in factor 7 are ‘toe 1 width’, ‘toes width’. Factor 7 shows the factor of the size of the heel. The Eigen value is 1.46, it explains 6.07% of the total amount of variance.
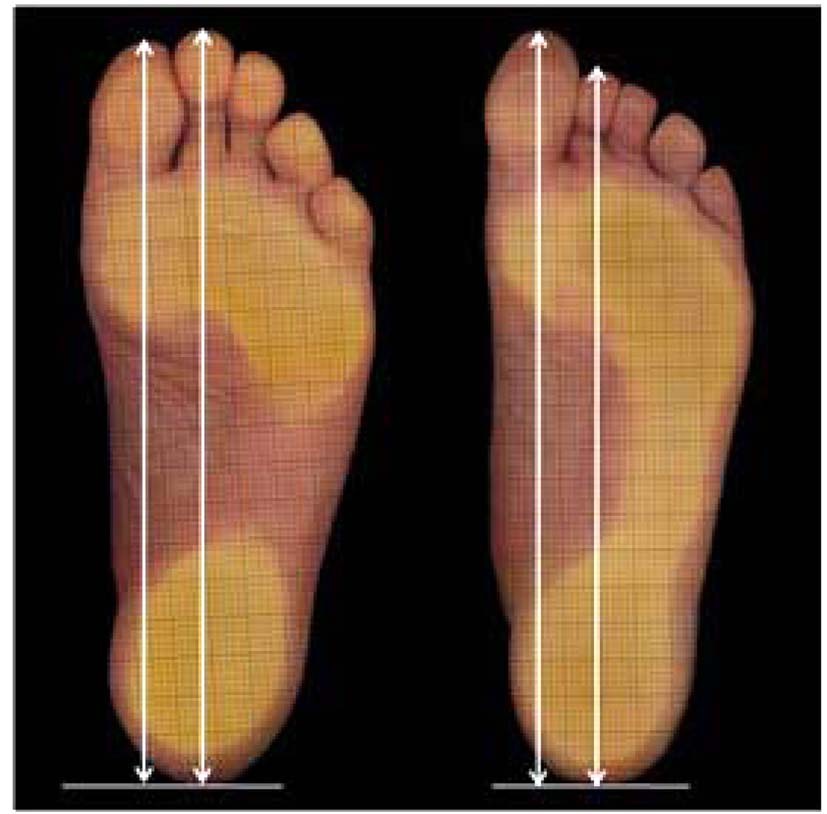
The measurement items expressing meaningful factor loadings in factor 8 are ‘heel-to-toe 1 length’, ‘heel-to-toe 5 length’. Factor 8
shows the factor of the length of the feet. The Eigen value is 1.04, it explains 4.31% of the total amount of variance.
Preceding studies on shapes of feet include categorization of the same research methods elderly women sole measured Park and Nam(2009) in the study of the factor analysis results, medial ball width and medial foot protrusion, inner point and outer point gradient, lateral foot width and lateral foot protrusion, anterior and posterior foot length ratio, toes breadth, heel size, toe length of uniformity seven factor, the present study similar content were derived. However, unlike the results for elderly women feet shape characteristics that represent the most 'ball and lateral foot protrusion' factor and 'medial foot protrusion' factor of the order of elderly women and elderly men are drawn in the reverse order of the sole shape factor medial foot lateral foot shape factor of the shape factor is more affected than is expected. Park(2011) study of elderly women foot sole shape of the 3D data by utilizing the results of factor analysis foot length factor, medial foot shape factor, ball and lateral foot shape factor, ball gradient factor were derived factor of four. Choi(2005) study of the 3D data using factor analysis results for the women sole shape foot length factor, foot breadth and lateral foot factor, medial foot factor appears to Park(2011), and similar results derived factor represented the difference in the number of similar factors, but the results of this study showed that represents.
To categorizing the types of the soles of the feet of elderly males, extracted eight factor in the independent variable in the cluster analysis was performed. When determining optimal cluster number, 3 to 5 cluster numbers were tested step by step in analyzing cluster analysis. The entire subjects were divided into 4 different
[Table 5.] The result of ANOVA of factor scores according to sole type

The result of ANOVA of factor scores according to sole type
sole type. Type 1, as the most typical sole type of elderly men consisted of 38.7% of the subjects. Type 2 consisted of 36.1% of the subjects. Type 3 consisted of 14.9% of the subjects. Type 4 consisted of 10.4% of the subjects.
ANOVA analysis and Duncan multiple range test were conducted to verify the differences for all factor score, measurements and values(Table 5~7).
Table 5 shows the result of ANOVA analysis of factor scores according to sole type. Significant differences of each factor among four sole types were recognized at level of
On examining the characteristic of sole type of feet by each type, shape characteristic of type 1 is narrow foot breadth without the protrusion part because of medial foot protrusion factor score is low. On the other hand, it represents high heel size factor score and toes breadth factor is midium value. Type 2 represents an inverted triangle shape because of the highest factor score of toes breadth and ball and lateral foot protrusion, but it represents the lowest factor score of heel size factor score. Characteristic of type 3 is the lowest value ball and lateral foot protrusion factor score. On the other hand, medial foot protrusion factor score is the highest value and toes breadth factor score is the lowest value. Type 4 represents shape of wide ball width and protruding lateral foot, as high ball and lateral foot protrusion factor score.
Table 6 shows the result of ANOVA analysis and duncan test of indices value according to sole type. As analysis result, significant differences of four sole types were recognized 22 items of 29 items.
Type 1 tends to be narrow foot breadth compared with foot length, and tends to be large toes width and heel width, and toes width/foot breadth and heel width/foot breadth represents the largest value of 4 type. Accordingly, this type represents foot breadth uniform shape. Type 2 is the lowest index value of heel breadth/foot breadth of 4 types. On the other hand, foot breadth/foot length, ball distance/foot length, toes width/foot length is high index value. Accordingly, this type represents wide shape toes part narrow heel width compared with foot length and foot breadth. Type 3 is high index value of length items/foot length and width items/foot length, and toes width/foot breadth, toe 1 length/foot length, toe 5 length/foot length, toes width/foot length is the lowest index value. Accordingly, this type represents shape to wide ball and narrow toes width. Type 4 is greek type as toe 2 length/foot length index value is 1. Also, index value of toes width/foot breadth, toes width/foot
[Table 6.] The result of ANOVA of indices value according to sole type
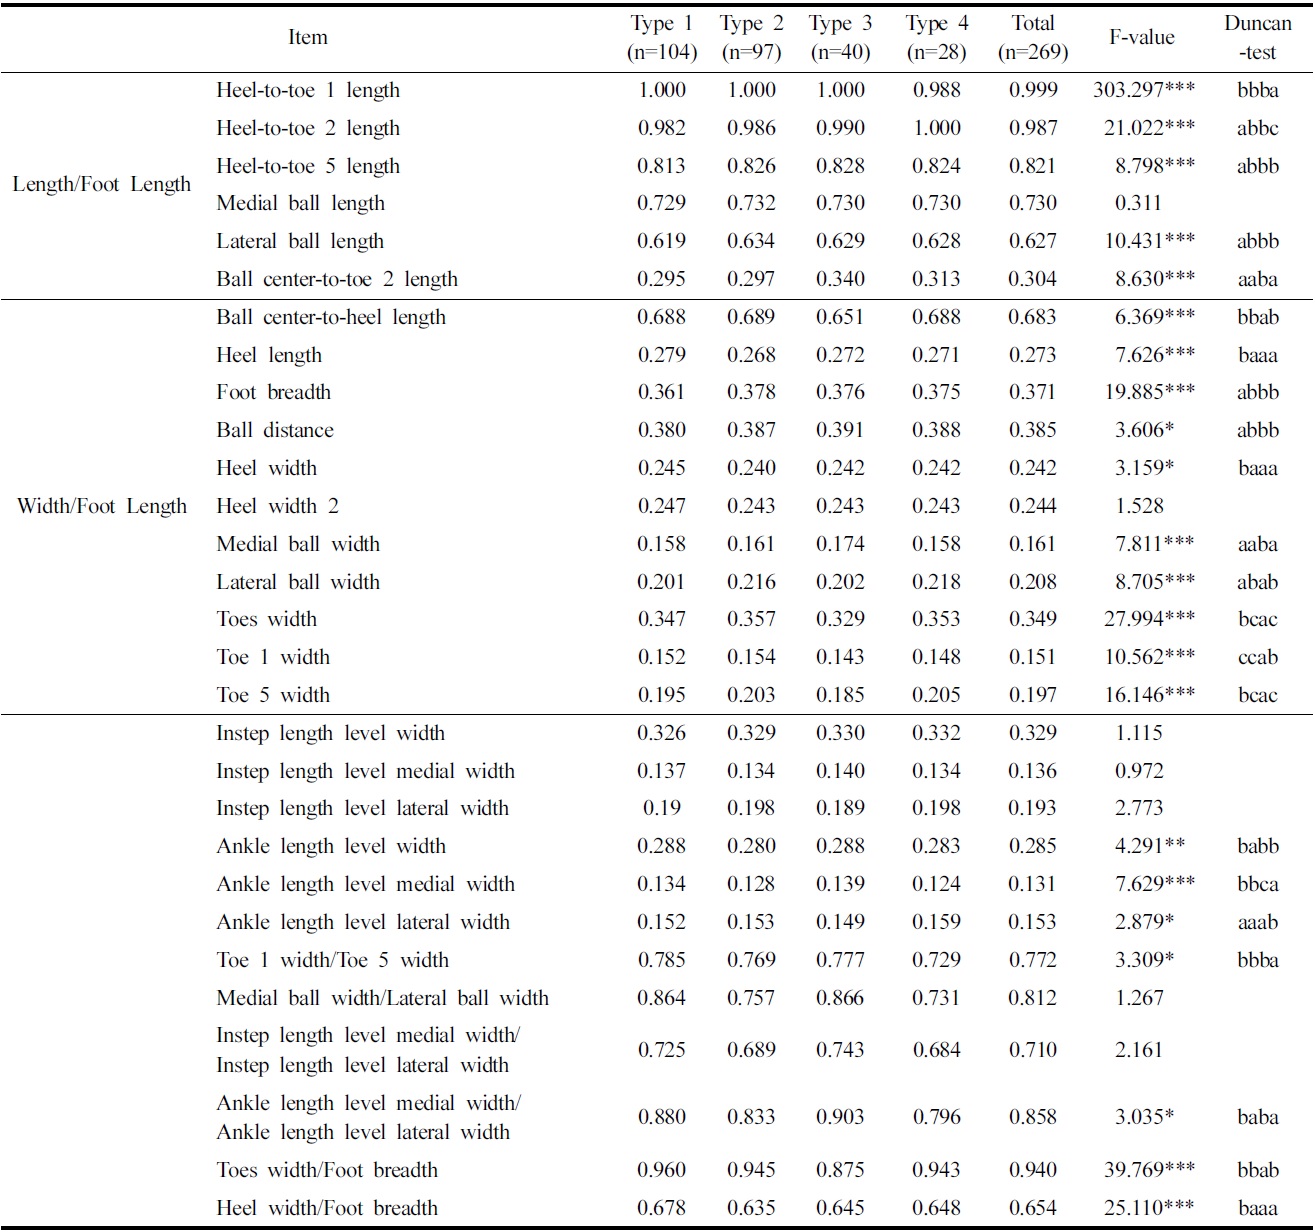
The result of ANOVA of indices value according to sole type
length, lateral ball width/foot length, toe 5 width/foot length, ankle length level medial width/foot length is high. Accordingly this type tends to represent large ball and lateral foot protruding.
Table 7 shows the result of ANOVA analysis and duncan test of measurement by sole type. As analysis result, significant differences of four sole types were recognized 22 items of 32 items.
Type 1 tends to be long foot length. And foot breadth is the narrowest, but heel width and ankle length level width tend to be wide. Also, the difference between foot breadth and toes width is the smallest, value of toe 1 angle, toe 5 angle, medial foot angle, lateral foot angle item represent small. Accordingly, this type represents foot breadth uniform shape.
[Table 7.] The result of ANOVA of measurements according to sole type
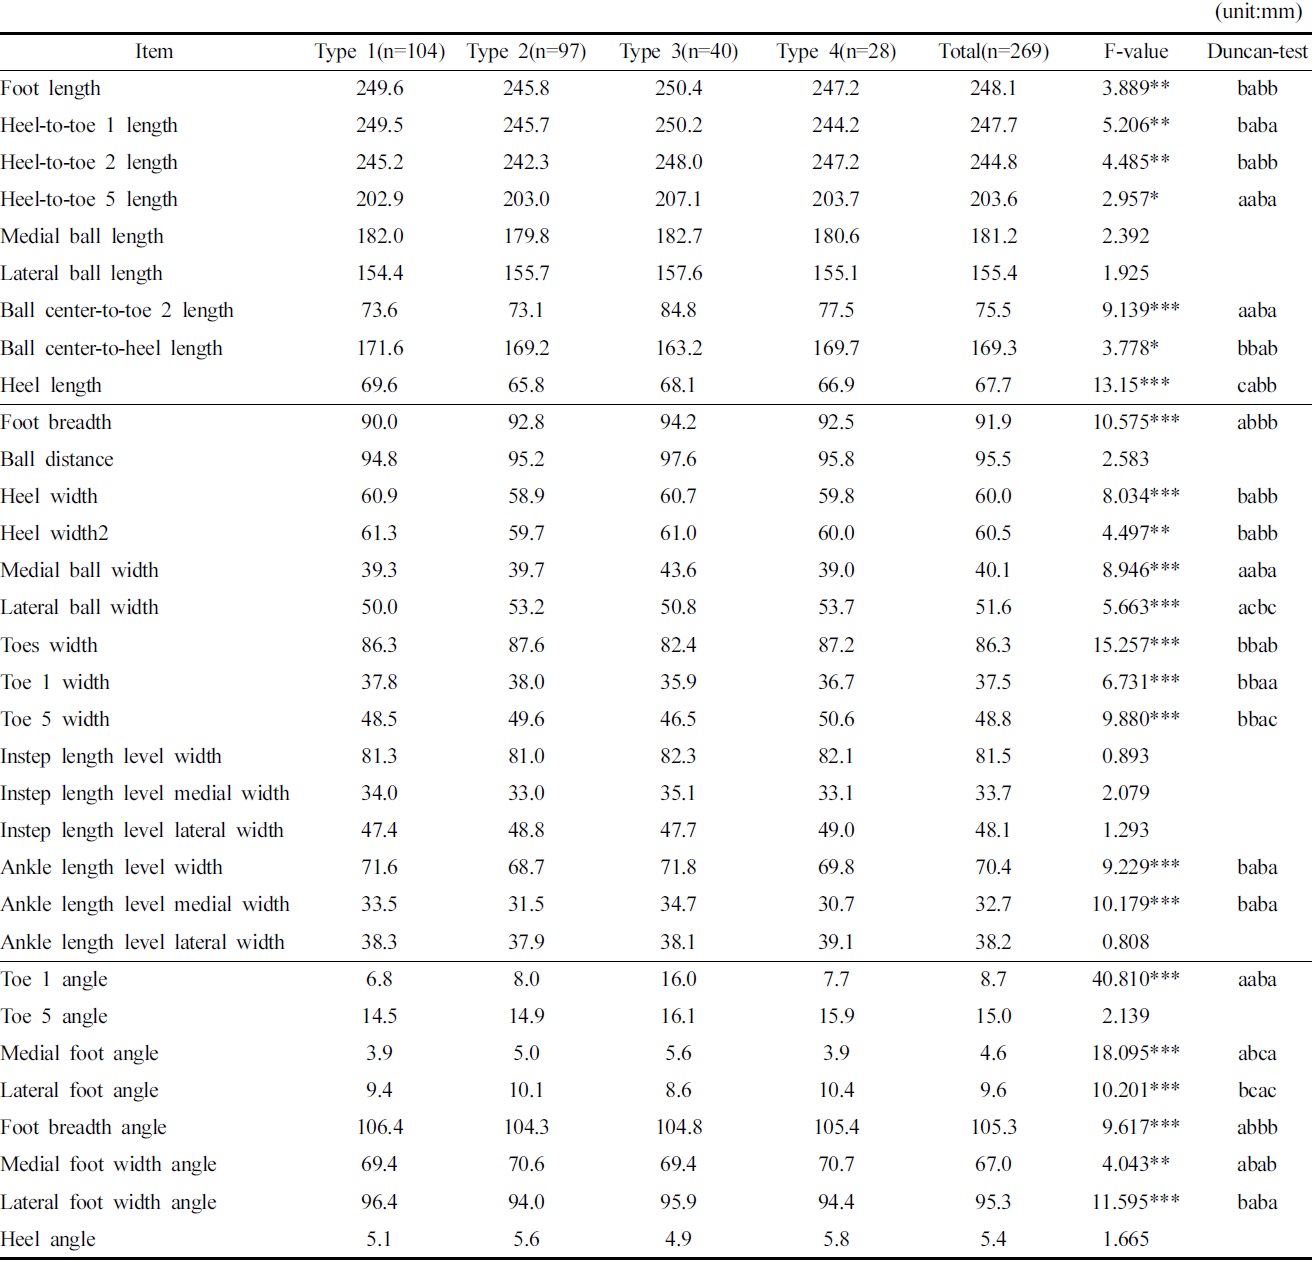
The result of ANOVA of measurements according to sole type
Type 2 is the shortest length items among 4 type, but toes width and foot breadth is wide. On the other hand, this type represents the narrowest heel width of 4 types. Toe 1 angle and toe 5 angle tend to be small, medial foot angle and lateral foot angle represent large value. Accordingly this type represent as foot length short and ball width wide compared with heel width.
Type 3 among 4 types is largest type of the length and width item. However, toes width among 4 type is smallest, toe 1 angle and toe 5 angle is largest, toes converged toward center. Also, this type is that foot breadth and ball distance tend to side with a large medial ball width and medial foot angle represents the largest value. On the other hand, lateral ball width and lateral foot angle inner point tend to a small in shape is very protruding.
Type 4 is shape to longer toe 1 length than toe 2 length. Toe 1 width, medial ball width and medial foot angle, while the small toe 5 width, lateral ball width and the lateral foot angle represented the largest value among 4 type foot inside the line and make up outer point has protruding shape.
3.3. Silhouette classified sole shape
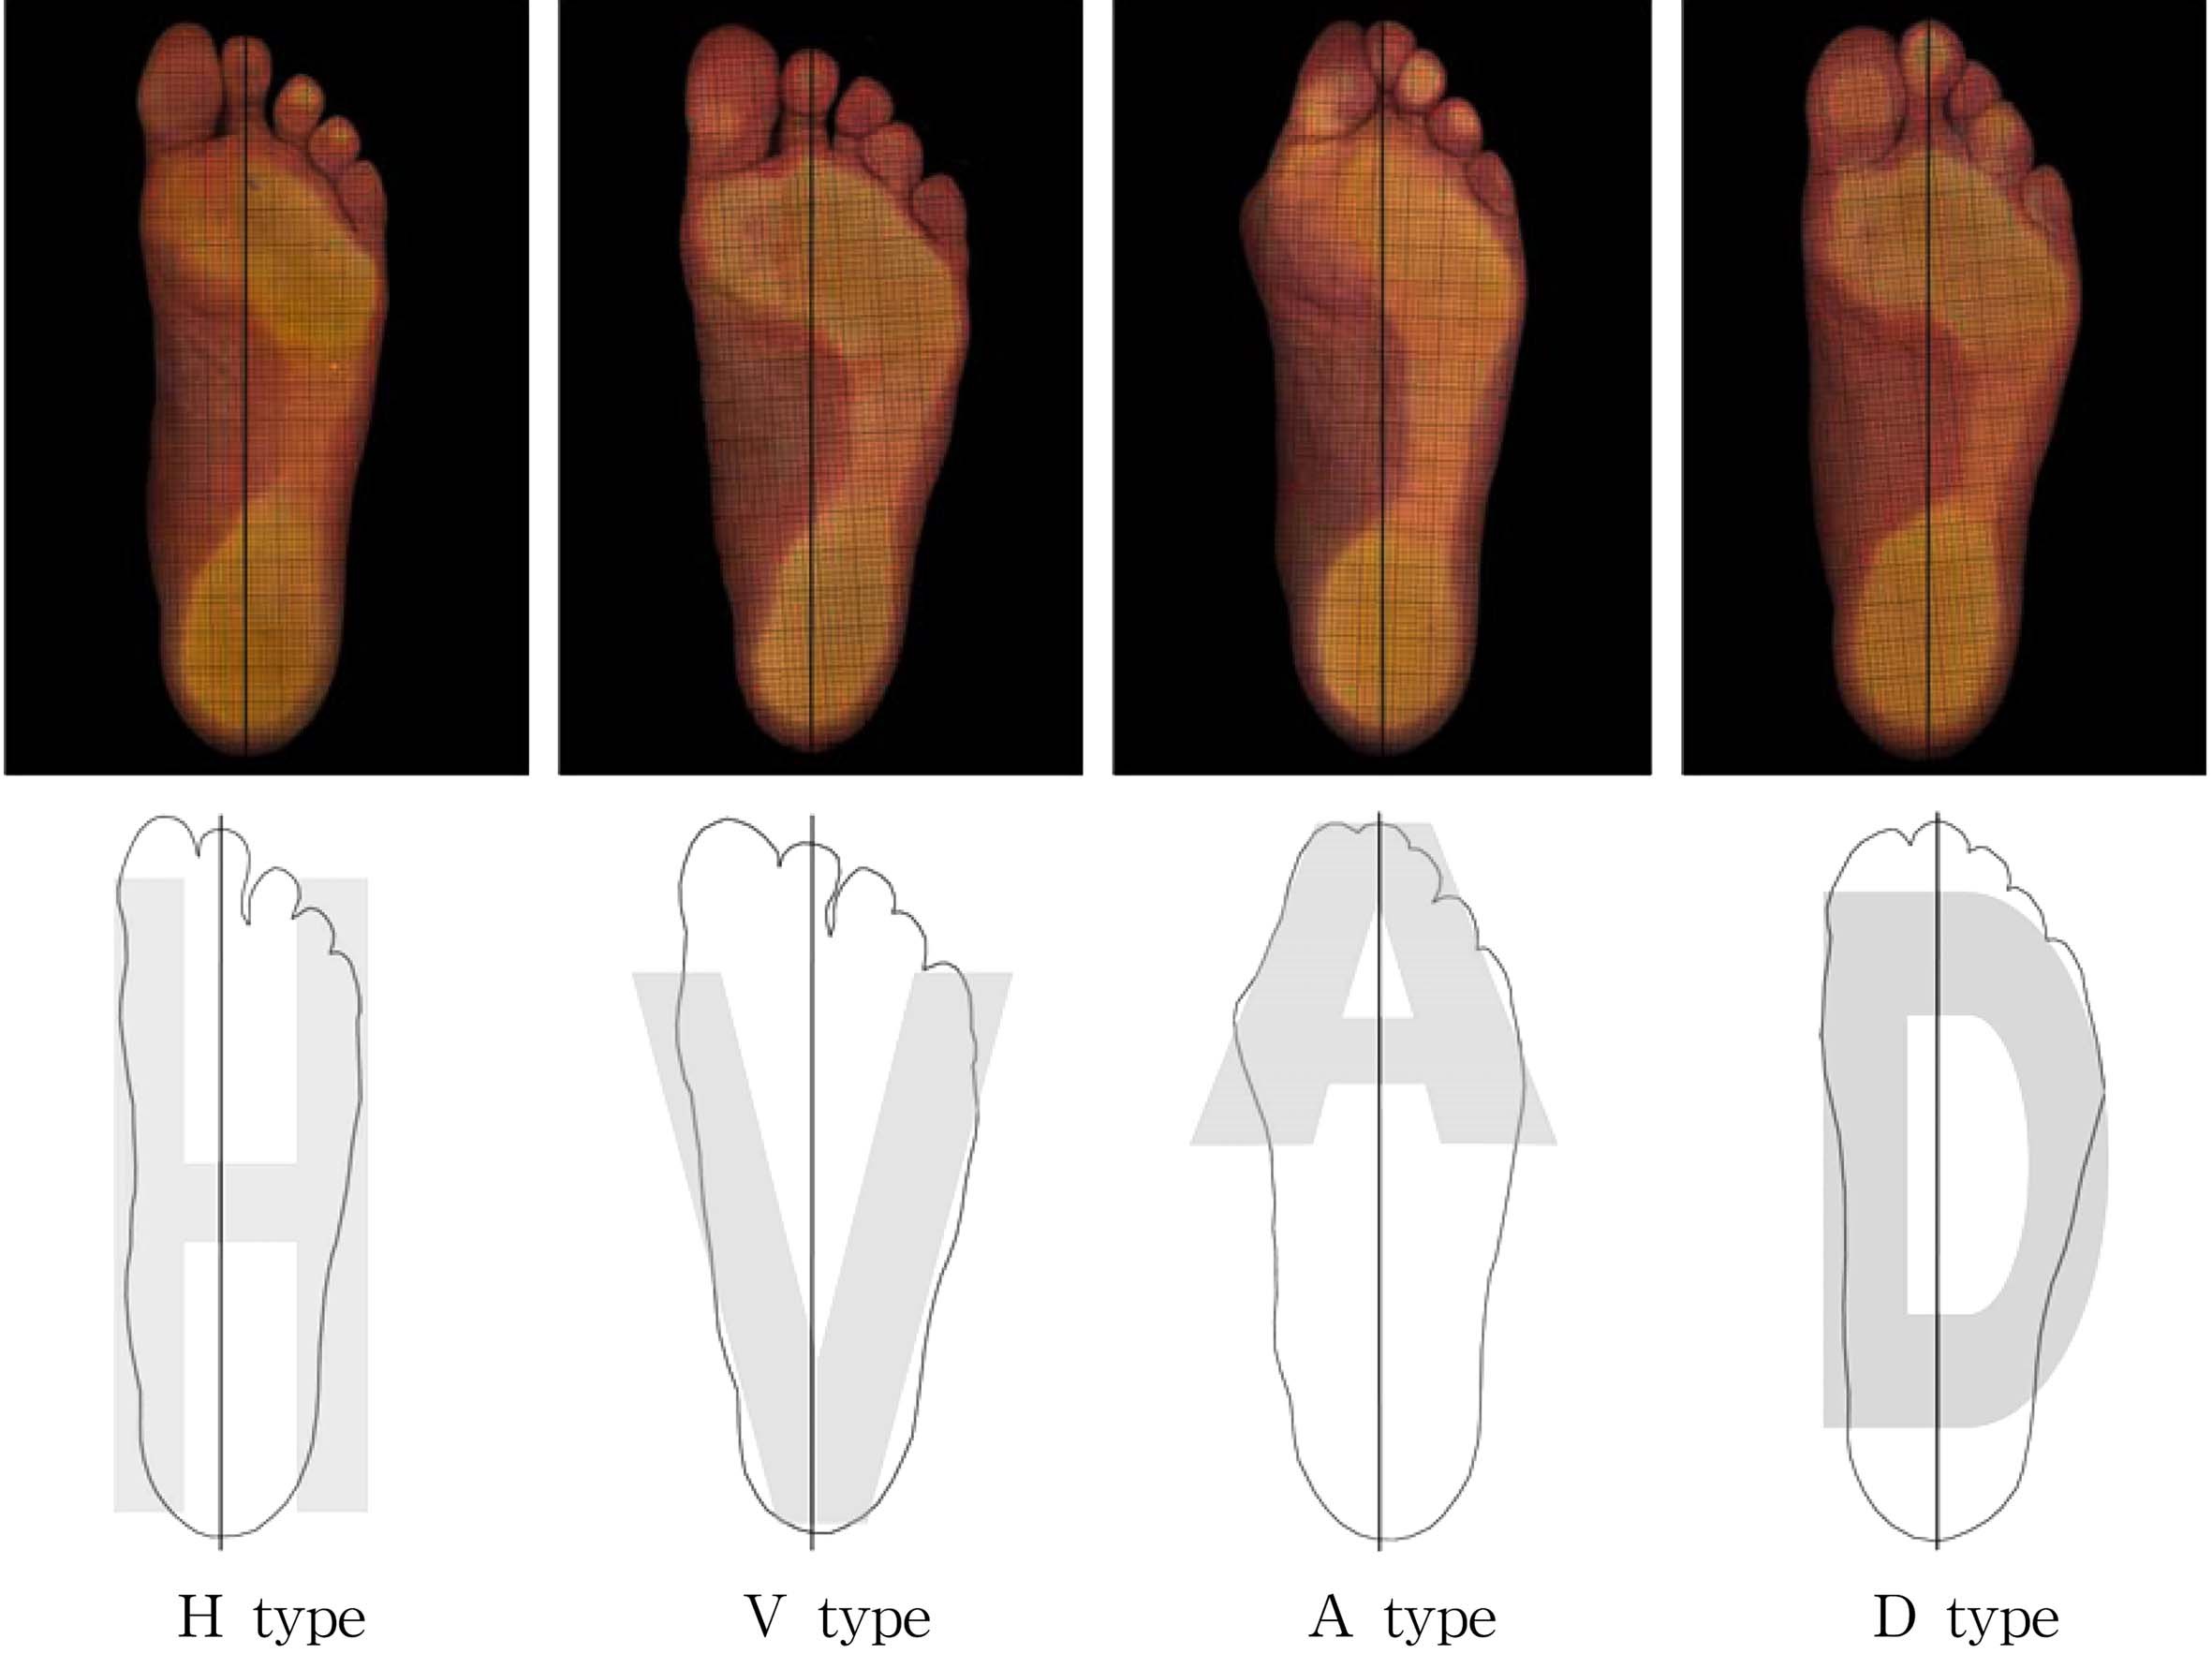
Fig. 10 shows the result of compared with a sole shape characteristics of each type ANOVA and duncan test, type 1 is called H type that consisted of 38.7% of the subjects, which foot breadth is narrow and heel width is wide, without protruding uniform shape.
Type 2 is called V type that consisted of 36.1% of the subjects, shows like distribution type 1, which heel width is narrow, ball width and toes width is wide. Type 3 is called A type that consisted of 14.9% of the subjects. This type is that toes is gathered, inner point is protruding and heel width is wide. Type 4 is called D type that consisted of 10.4% of the subjects. This type is that toe 2 length is longer compared with toe 1 length, foot inside is straight, outer point is protruding shape.
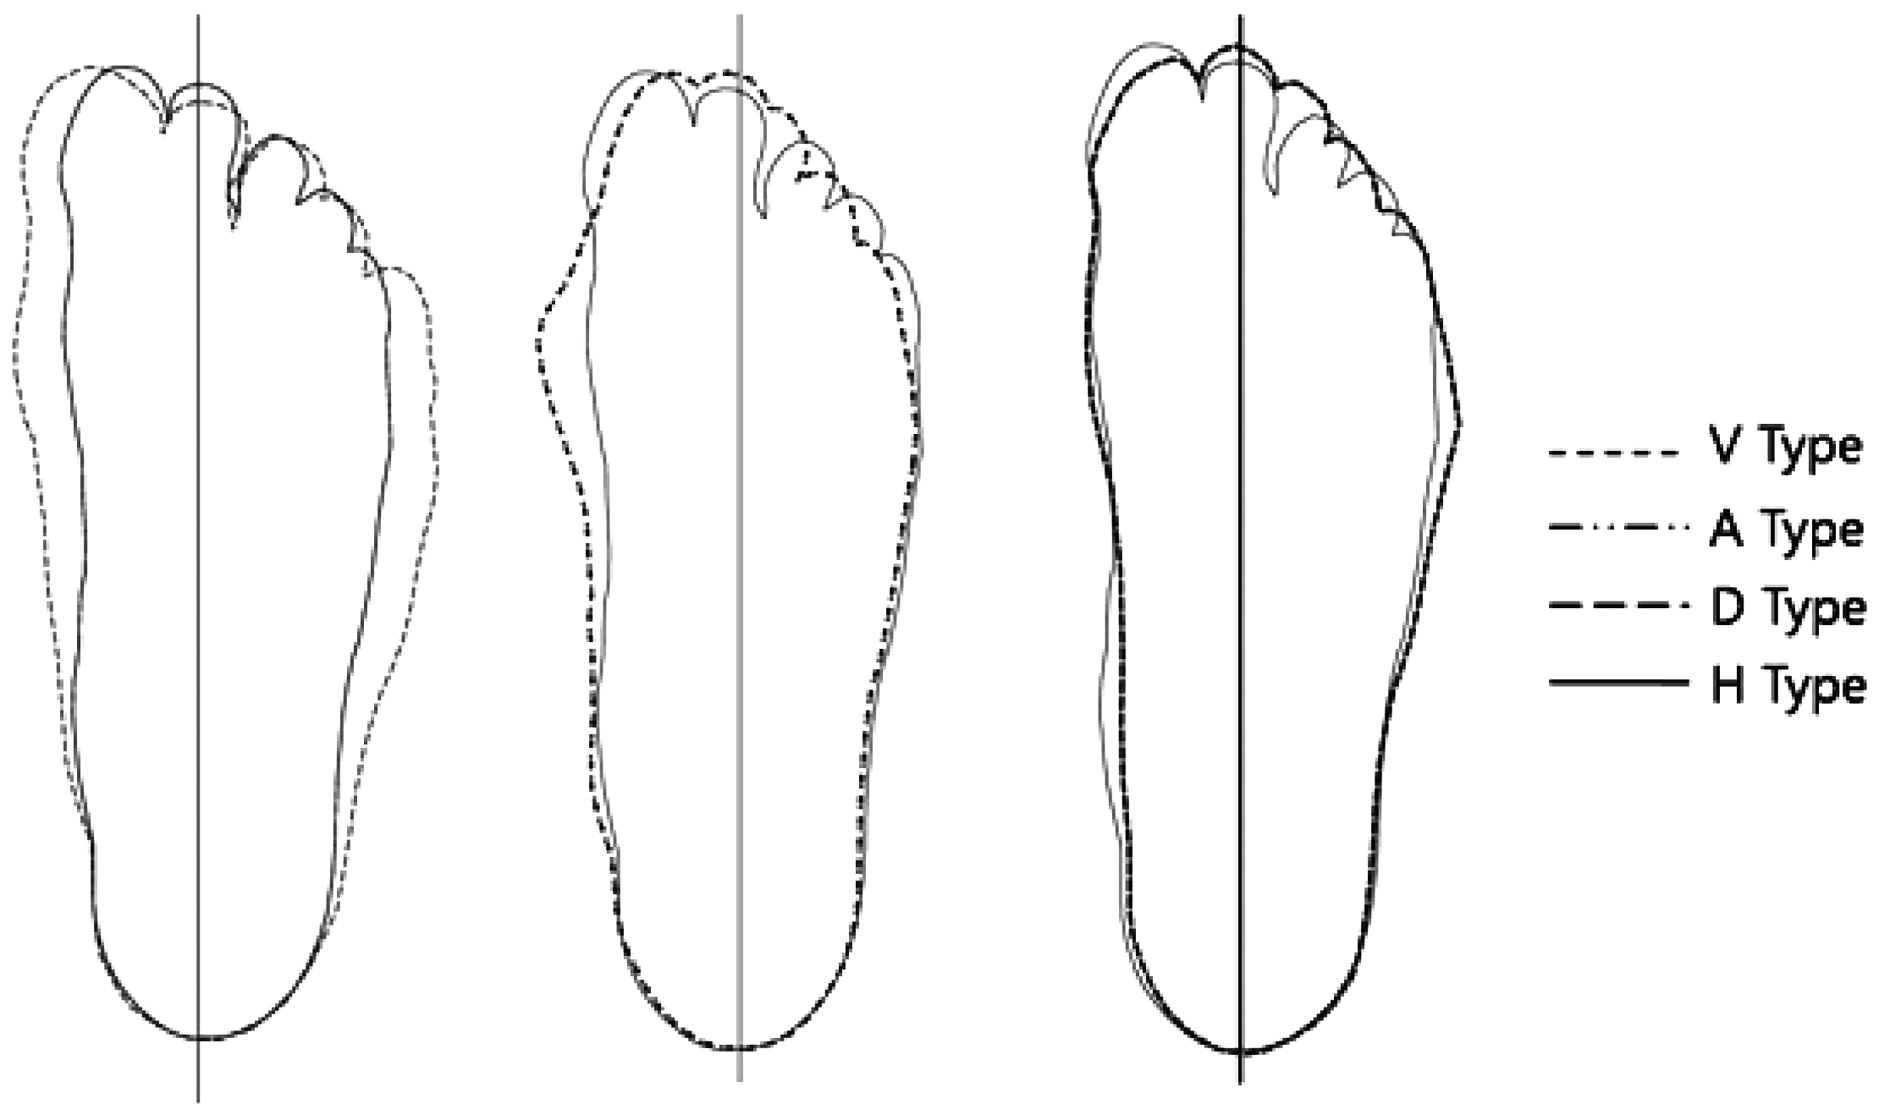
For a comparison of the silhouette between the types, all were compared with H type as a standard, with the result that whereas V type was similar to H in the width of heels, the feet and toes were found to be wider across. While in A type heels were similar in widths, the inner part protruded and toes converged together, making the toes narrower in width, D type showed that while the outer contour line was similar to that of H type, the outer point protruded, pointing to differences existing between the types(Fig. 11).
This study proposed to provide basic data for the manufacture of insoles tailored to shapes of the soles of feet that will supplement functions of the feet effectively and enhance fitness to the shape of the soles by categorizing shapes of the soles of feet of the elderly males and analyzing their traits by type. Here is the conclusion of categorizing the soles of feet.
First, an analysis of factors using index values of the length of feet in order to exclude the influence of sizes indicates that 8 factors were extracted that include factors of the extent to which the widest part of the soles of feet and the malleolus protrude, the factor of the ball of the feet tilting, the factor of the extent to which the interior part of the feet protrudes, the factor of the ratio of the length of the feet in front and rear, the factor of the length of feet on the outside, the factor of the size of the heel, the factor of toes widening out, and the factor of the length of the feet. The foregoing factors accounted for 77.83% of shapes of the soles of feet.
Second, a cluster analysis was conducted with the 8 factors extracted from an analysis of factors, thus identifying 4 types. An analysis of the index values and measured values shows that Type 1 (38.7%) was found to fall into H type where widths of toes, feet and heels were even and the inner side and malleolus hardly protrude, Type 2 (36.1%) was identified as V type where while feet and toes were wide, heels were narrow across, Type 3 (14.9%) was found to belong to A type where while the feet were widest of all, and heels were also wide, toes converged toward the center, and the inner point protruded most noticeably, Type 4 (10.4%) were identified as D type where the fore toe was relatively longer than the big toe and the outer point of the feet protruded more than the inner point.
Third, for a comparison of the silhouette between the types, all were compared with H type as a standard, with the result that whereas V type was similar to H in the width of heels, the feet and toes were found to be wider across. While in A type heels were similar in widths, the inner part protruded and toes converged together, making the toes narrower in width, D type showed that while the outer contour line was similar to that of H type, the outer point protruded, pointing to differences existing between the types.
An examination of shapes of the soles of feet of the elderly males indicates that whereas H type with a uniform shape was most widely distributed, among such types as V, A and D, where the feet were wider across, various types were identified due to differences in the width of toes and the positions that protruded. V type and D type where outer points developed in particular accounted for 46.5%, a noticeably high portion, and A type that tends to hallux valgus featuring the inner point protruding represents a high distribution rate. It is advisable to design insoles by taking into account the findings of this study.
The subjects sampled for this study reside in Kwangju Metropolitan City, a geographical limitation, thus making it necessary to use discretion in generalizing the findings of this study. Since the findings of the study show patterns differing from shapes of the elderly females, this study is expected to help significant to establish a system of sizes of footwear for the elderly males and provide basic data and findings of analyses for the design of footwear from the perspectives of ergonomics and comfortableness. Follow-up studies are encouraged to establish systems of footwear sizes and methods of designing footwear reflecting characteristic features of the elderly males.