To establish an aging management plan considering seawater influx and changes in groundwater within nuclear power plant sites, the characteristics of groundwater flow must be understood. This study investigated the characteristics of groundwater flow within the site and analyzed groundwater level recorded by monitoring wells to evaluate groundwater flow characteristics and elements that affected these characteristics for supplying the information to conduct the appropriate aging management for ensuring the safety of the safety-related structures in Shin Kori Unit 1 and 2. The increase in groundwater level during the wet season results from high sea-level conditions and the large amount of precipitation. As a result of the analysis of groundwater distribution and change characteristics, the site could be divided into a rainfall-affected area and a tide-affected area. First, the rainfall-affected area can further be divided into areas that are affected simultaneously by excavation, backfill, and a permanent dewatering system. Secondly, areas that are not affected by excavation, or the dewatering system, or by structure arrangement and excavation. Analysis of the spectrum for wells affected by tides resulted in confirmation of the M2 component (12.421 hr) and S2 component (12.000 hr) of the semidiurnal tides, and the O1 component (25.819 hr) of the diurnal tides. In the crosscorrelation results regarding tides and groundwater levels, the lag time occurred diversely within 1-3 hours by the effect of the well location from sea, the distribution of the backfill material with depth, and the concrete structure.
In the water cycle, the coastal area is where groundwater that has passed through the local and regional flow process is finally discharged into the sea. Coastal areas are commonly developed for industrial, residential, and recreational purposes, which lead to various problems, such as disturbance of the hydrogeological characteristics of the geological media and several issues induced by the establishment of underground structures, drainage pipelines, water supply pipeline, etc. Some problems noted by researchers include (1) the reduced safety of structural foundations, and (2) problems with the soundness of structures, such as damage to basement floors and walls and ruptures in electricity, gas, and water supply pipes [1,2,3] and (3) flooding of underground spaces such as basements and underground parking lots [4,5] due to a rise in groundwater levels that occurs due to an increase of the recharge rate by sewage and water leakages and landscape irrigation in areas where the groundwater level has descended in the initial urban development process.
Problems also exist with damage to facilities due to ground subsidence occurring [6], and pollution of agricultural water due to salinization of groundwater [7] when the groundwater level descends due to excessive pumping.
In countries with nuclear power plants, the design lifetime of the plant is extended through methods such as Long Term Operation (LTO), Plant Life Extension (PLEX), and Plant Life Management (PLiM) [8]. These methods require aging management plans, which check if essential safety functions are maintained across the overall operation period, in consideration of changes that occur over time in the safetyrelated structure compared with the initial design [9].
Korean nuclear power plants are located in coastal areas to secure a large amount of cooling water, and geographical changes occur during the construction process due to excavation and reclamation. The foundation of some structures is located below the groundwater table. The excavation and backfill that occur during the construction process cause changes in the hydrogeological stratigraphic sequence (e.g., removal of semi-permeable strata) leading to groundwater drawdown and seawater intrusion. Coastal reclamation and drainage commonly cause a low groundwater level across a large area, resulting in the wide existence of saline groundwater in the reclamation area [10]. Therefore, to establish an aging management plan that considers the seawater influx and groundwater changes within the site, the characteristics of groundwater flow must be understood.
The characteristics of groundwater flow include its direction and speed, recharge area and discharge area, and change in groundwater level due to natural/artificial factors. These characteristics can be inferred from the groundwater level and water quality data measured regularly/continuously at the monitoring well. Specifically, the interpretation of groundwater level changes can provide information regarding hydrological stress applied to the aquifer through an understanding and quantization of factors comprising the water cycle. This analysis can be used to evaluate the effect of natural factors such as rainfall and tides, as well as artificial factors such as artificial recharge and pumping, on the movement of groundwater through geologic media [11].
This study was conducted to evaluate groundwater flow characteristics and elements within the site of Shin Kori Nuclear Power Plant Unit 1 and 2 to provide appropriate information for implementing an aging management plan.
2. STUDY AREA AND GEOLOGICAL CHARACTERISTICS
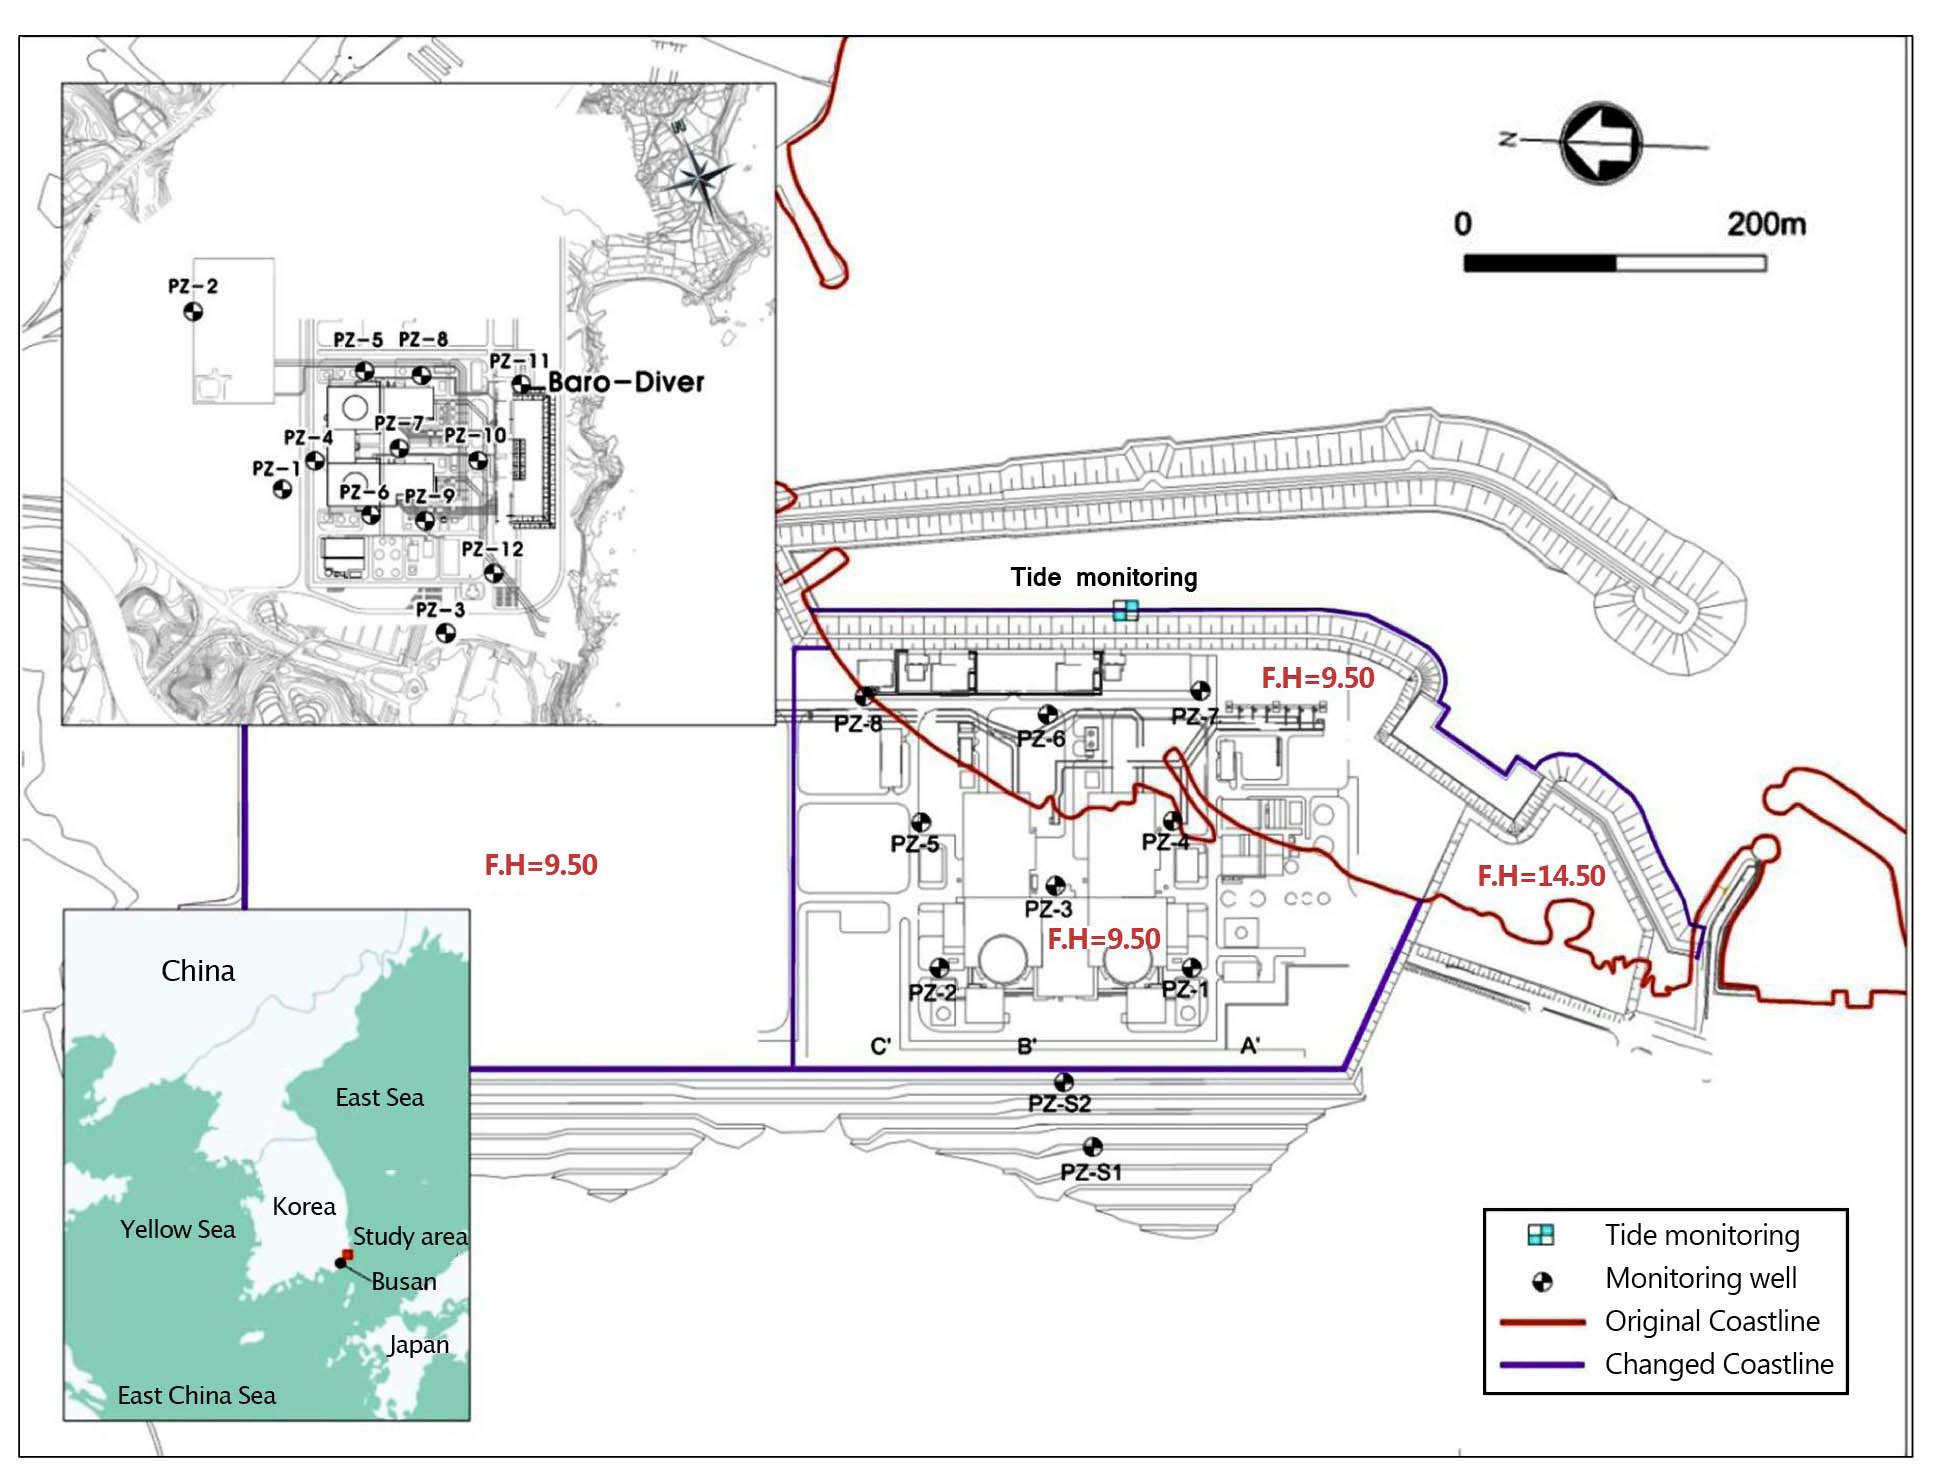
The study area is located in the southeastern coastal area of the Korean peninsula (Fig. 1) [12]. Approximately
400 m to the west is the western slope of a mountain peak (129.2 m above sea level), and an approximately 800 m course of water from
2.2 Geological Characteristics
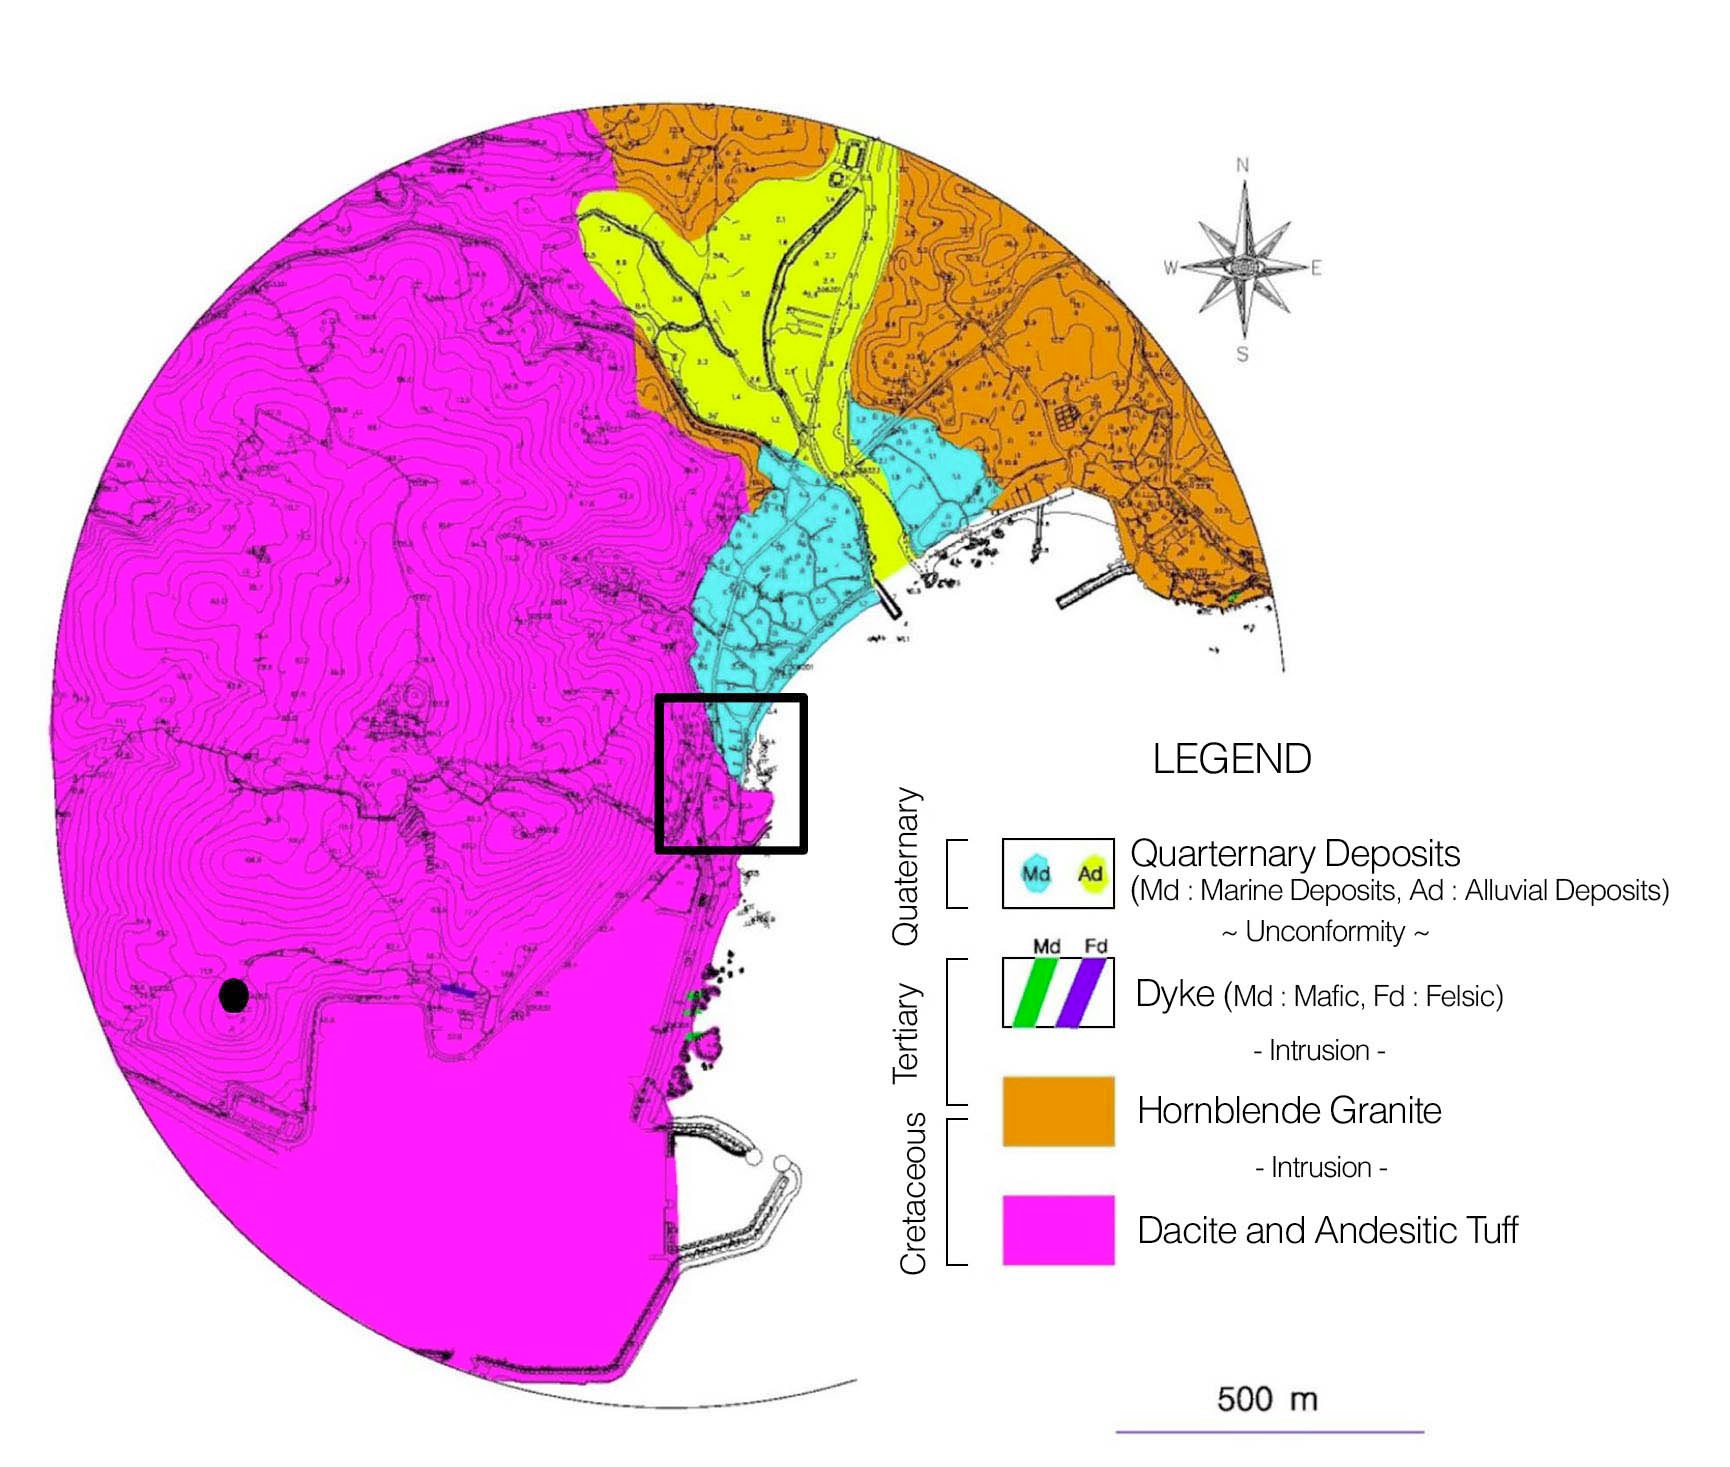
Main rock types of the study area are dacite and andesitic tuff partly covered with quaternary marine deposits in the northeastern part (Fig. 2) [13].
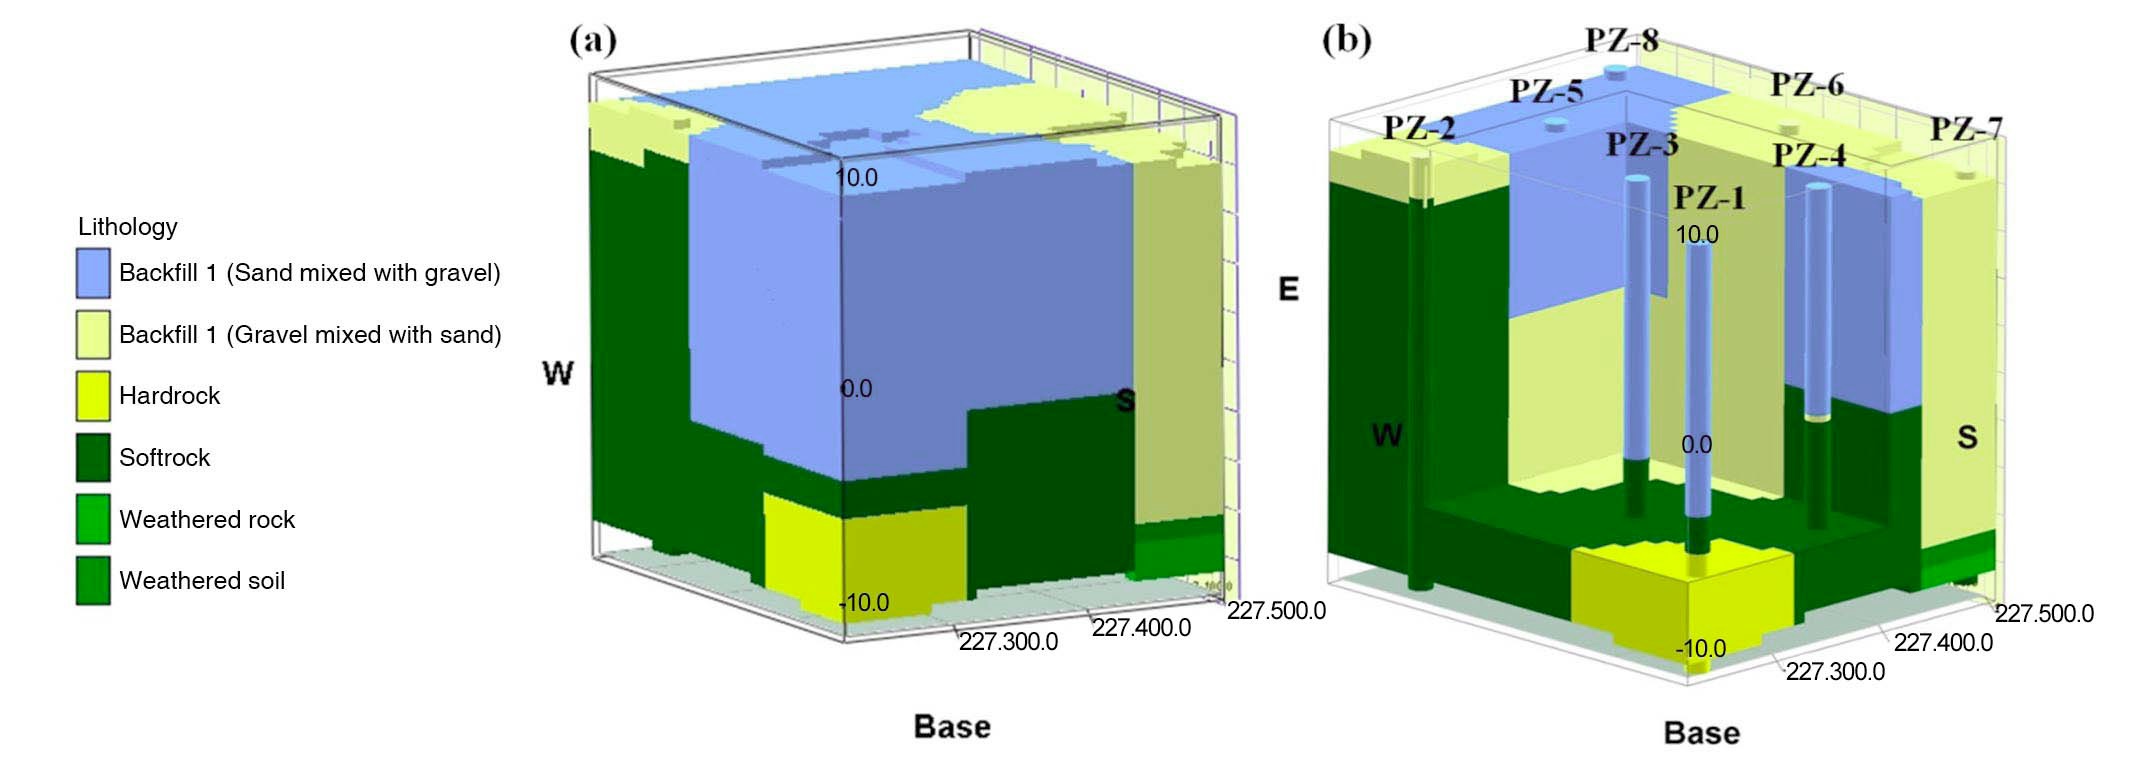
Fig. 3 shows the distribution characteristics of the hydrogeological media that generated by applying borehole data obtained from 8 monitoring wells installed within the site to the RockWorks program (RockWorks15, RockWare). PZ-1, 2, 3, 4 and 7 are made up of backfill material up to EL. -3.8 m, +8.17 m, -3.9 m, -1.5 m, and -7.9 m respectively, and the remaining section is the original strata. The entire section encompassing PZ-5, 6 and 8 is made up of backfill material.
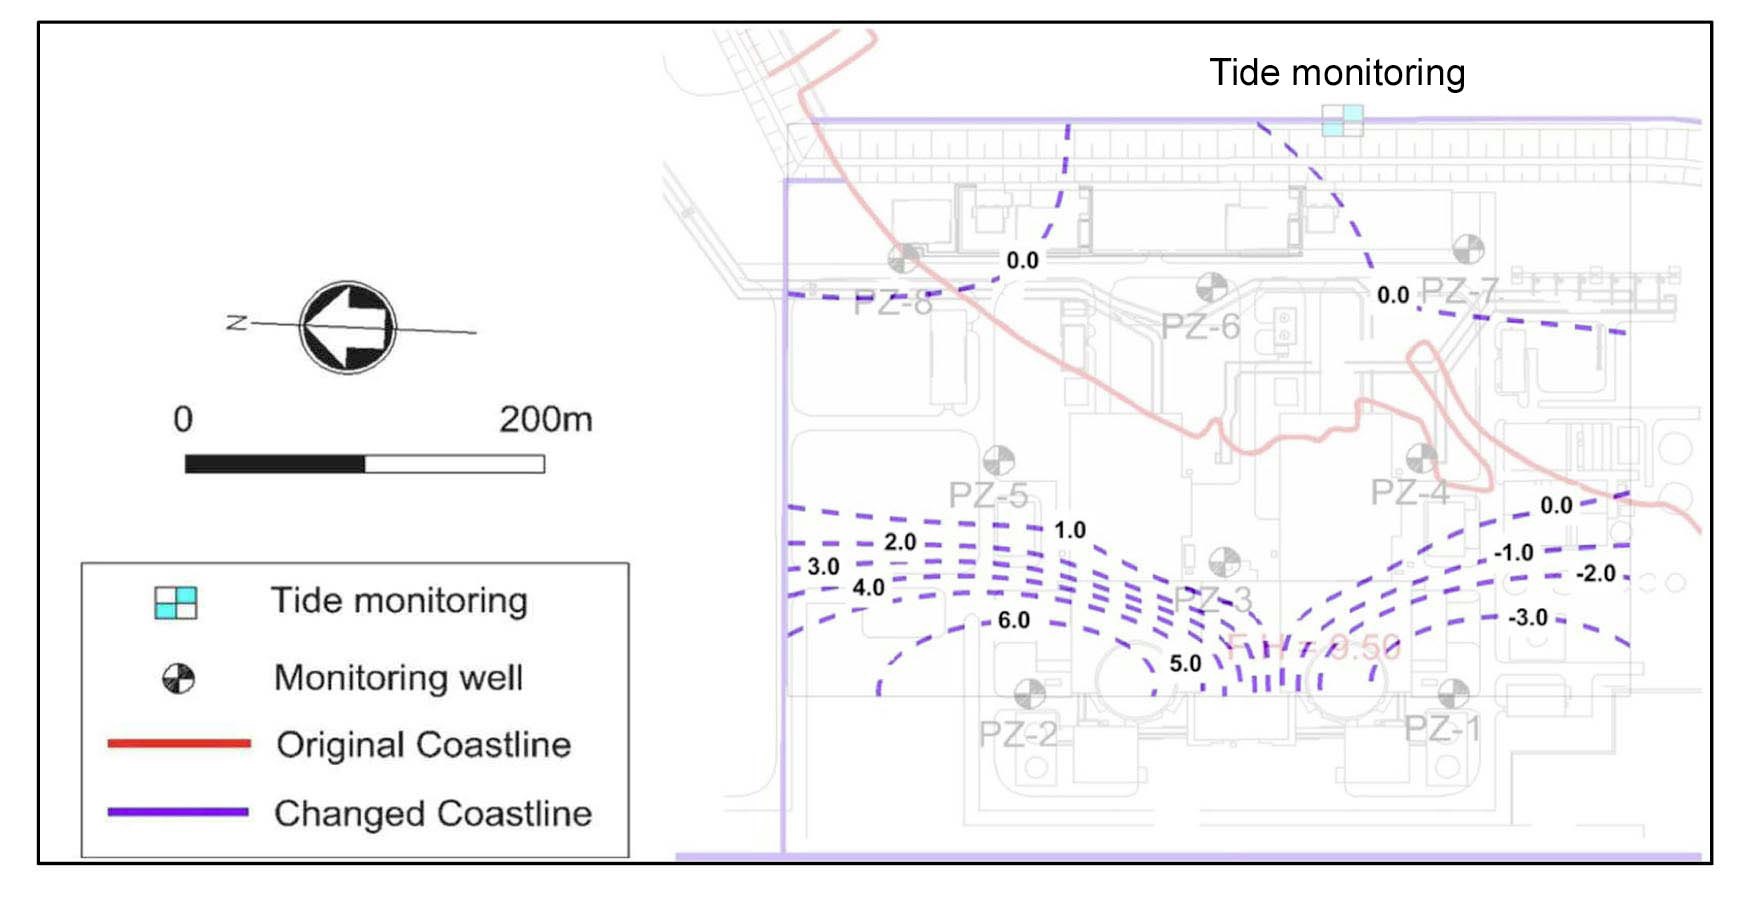
Factors that affect groundwater level were investigated using groundwater level data from 8 monitoring wells (PZ-1~8) installed in the study area (excluding 2 wells, PZ-S1 and S2, that are located on the slope presented in Fig. 1), tide data measured in intake (tide gauge is marked such as the chequered box in Fig. 1), and rainfall data measured by a meteorological tower (tower is marked as the dot in Fig. 2) at the Kori Site. Factor analysis was conducted to
[Fig. 3.] (a) 3D Formation and (b) Multi-panel 2D Cross Section of Hydrogeological Media in the Site
[Table 1.] Locations of the Monitoring wells and the Depth of Measurement Devices in the well
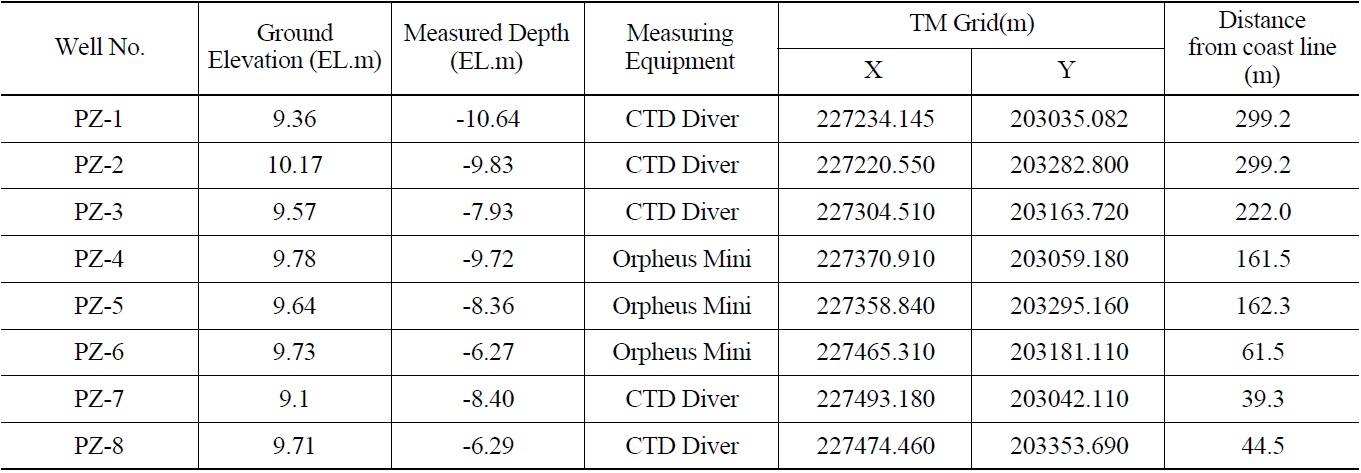
Locations of the Monitoring wells and the Depth of Measurement Devices in the well
evaluate the influence of construction activity on groundwater flow. Information regarding the monitoring wells on the site and their locations are shown in Table 1.
This research obtained data on tide, rainfall, groundwater level, and barometric pressure at hourly intervals. Rainfall and tide data were measured for 23 consecutive months from May 1, 2010 to March 31, 2012. However, missing values occurred in the groundwater level data due to adjusting location for barometric pressure measurement (07/14/11 20:00 ? 07/15/11 09:00), breakdown of measurement equipment (PZ-3 and 7 at 05/01/10 00:00 ? 01/10/11 14:00 and 07/21/11 10:00 ? 08/11/11 09:00, PZ-8 at 01/04/12 14:00 ? 03/31/12 23:00), and errors in the process of groundwater sample collection and data collection. When evaluating the physical characteristics of groundwater and analyzing the interrelationships between each parameter, missing values can cause bias in the analysis results. Therefore, out of all data, only the continuous measurements for 1 month each in March, June, and November of 2011 were used, as there were no missing values in groundwater level.
The auto-correlation analysis, the spectrum analysis using Fourier transform, and the cross-correlation analysis were performed to examine the time effect of natural factors that influence changes in groundwater level. The autocorrelation analysis is a method that measures the interrelationship according to the time difference of each data value within the relevant time series. When a secondary maximum value (which is a considerably large value) exists in the results of the auto-correlation analysis, this signifies that a signal with a similar shape repeatedly appears at a specific interval in the time series. In addition, as the time series has a strong linearity and memory effect, it has an auto-correlation function value higher than 0 for a long lag time. However, if it has weak linearity and memory effect, it reaches 0 within a shorter lag time [14,15]. In other words, the auto-correlation is usually conducted to measure the periodicity of a certain function, and the auto-correlation coefficient [
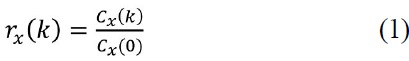
In the above formula (1),

In this formula, N is the total data number and

is the mean value of the time series data.
Fourier transform is effective in comprehending the characteristics of frequency nested in the measurement data by transforming the time series data to the frequency domain [17,18]. Therefore, through the power spectral density function where the auto-correlation function is Fourier transform, the periodic factors that cause changes in groundwater level can be confirmed.
Moon et al. [19] used daily data in the cross-correlation analysis of the effect of rainfall on groundwater level and
suggested that rainfall and groundwater level be measured hourly to confirm a more accurate interrelationship. The cross-correlation analysis is used to express the similarity and linear relationship in the time domain of the input data (rainfall or tide) and output data (groundwater level) [20]. The cross-correlation function is asymmetrical [rxy(k) ≠ rxy(k)], and when rxy(k) > 0 when and k>0 the input data affect output data, and when rxy(k) > 0 when and k<0 the output data affect input data. The lag time is the time difference between k=0 and when the cross-correlation value (±1 range) reaches the highest point [maximum rxy(k)], and this signifies the point at which rainfall has the maximum effect on groundwater level [21]. Generally, it can be interpreted as conveyance is faster as delay is shorter.
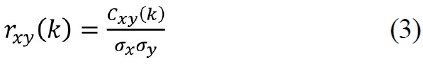

In the above formula (3) and (4), Cxy(k) is the crosscovariance, k the lag time, x and y the time series input data (rainfall and tide) and output data(groundwater level), σx and σy the standard deviation of each time series data and

the mean values of each time series data, respectively.
4.1 Characteristics of Continuous Measurement Data
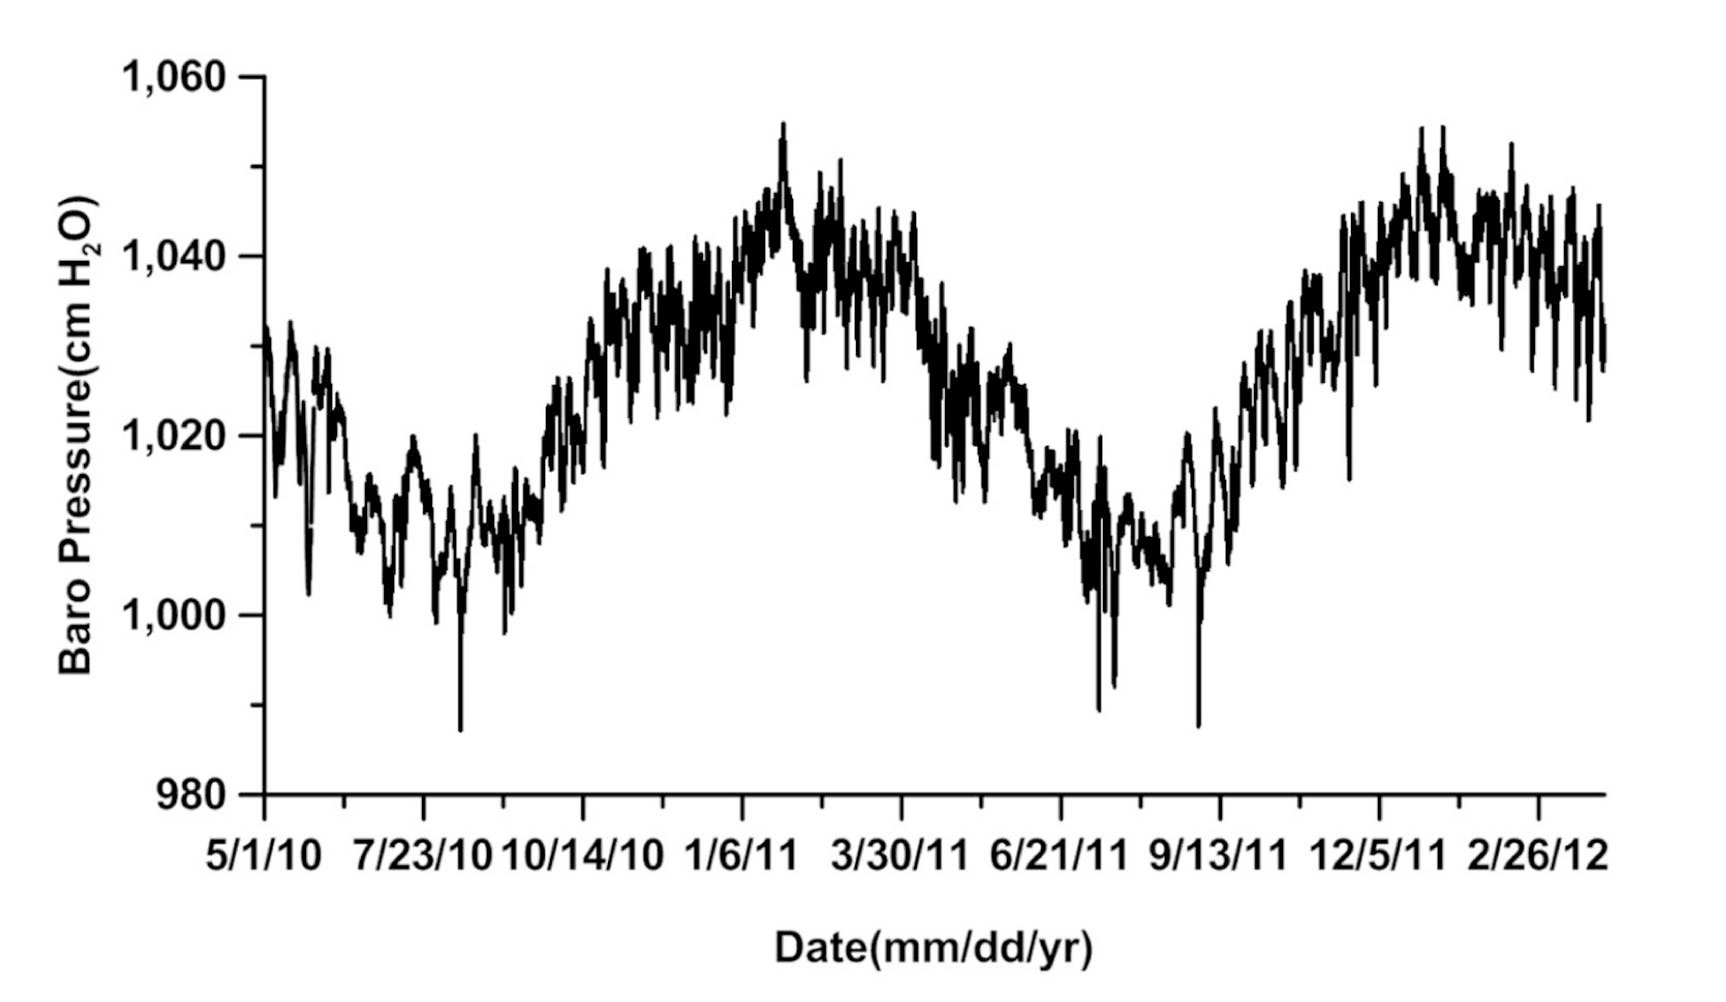
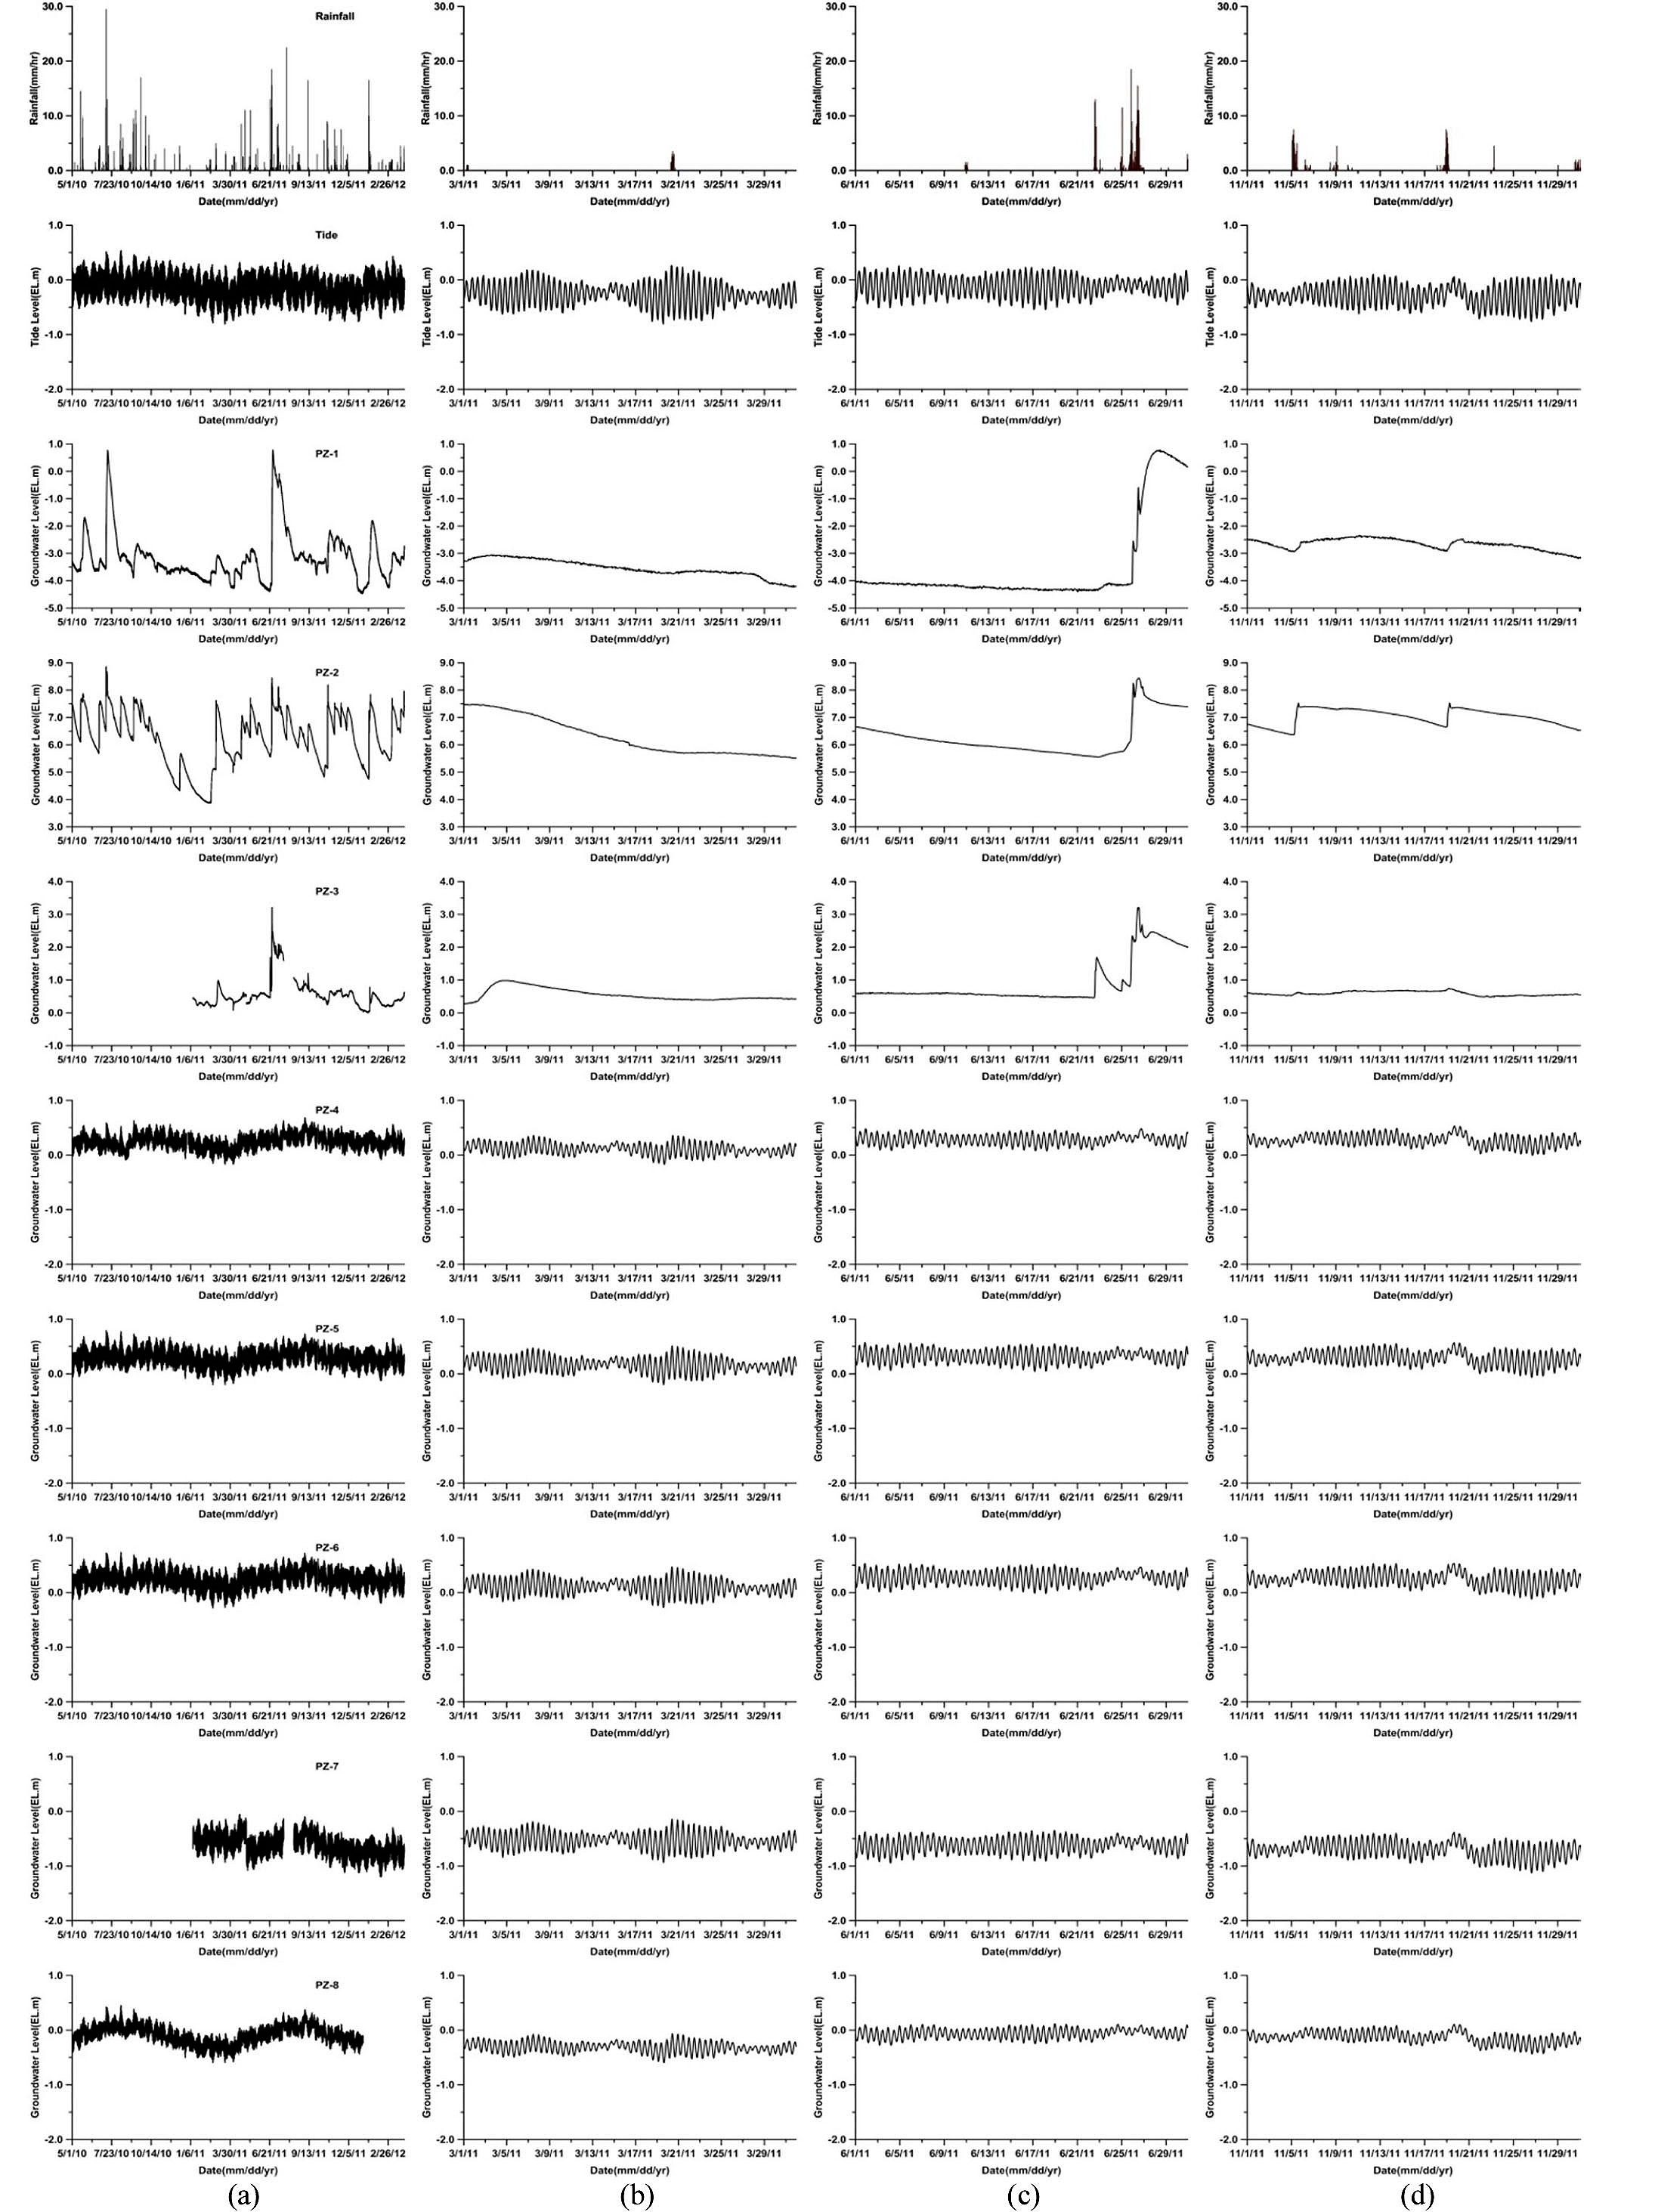
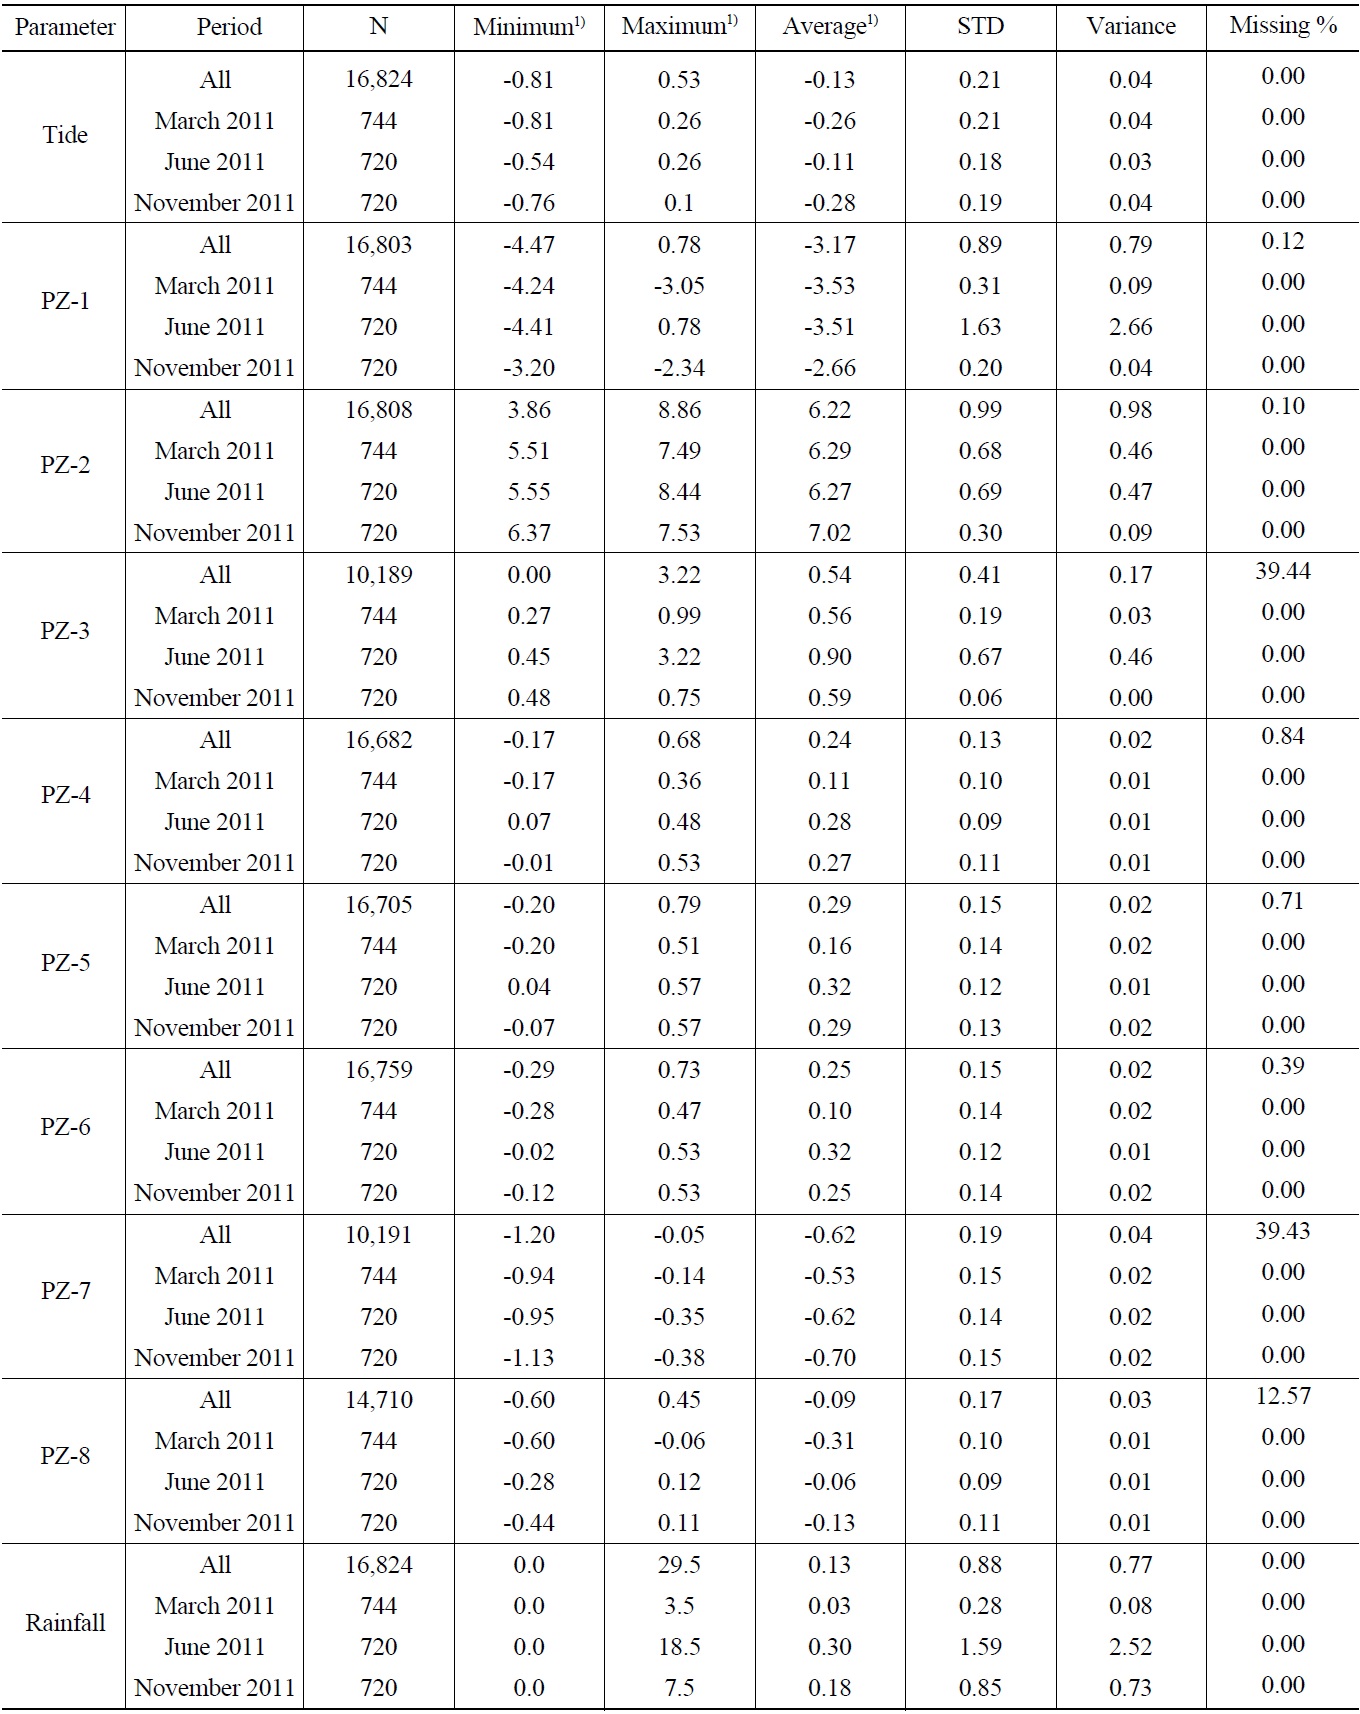
Fig. 5 shows rainfall, tides, and groundwater level for the entire study period (May 1, 2010 to March 31, 2012), as well as March, June, and November of 2011. Basic statistical data regarding each measurement parameter are presented in Table 2.
The total accumulated rainfall amount during the study period was 2,108.2 mm (average for 1,100.3 mm), including 834.2 mm for the last 8 months of 2010, 1,013.5 mm for 2011, and 260.5 mm for the first 3 months of 2012. Annual precipitation for 2011 is smaller than that of for the neighboring Busan area(1,491 mm, [22]). In the rainy season, comprising the 4 months from June to September in 2010 and 2011, the amounts of rainfalls were 577.5 mm and 449.5 mm, respectively. The maximum hourly rainfall during the study period was 29 mm/hr on July 11, 2010 from 12 to 1 p.m. The total rainfall amounts for the months of March, June, and November included in analysis were 24.5 mm, 212.0 mm, and 132.5 mm, respectively.
The mean value, standard deviation, minimum value, and maximum value for tides during the study period were EL.-0.132 m, ±0.21 m, EL.-0.81 m and EL.+0.53 m, respectively. The mean values for the analysis period of March, June, and November were EL.-0.26 m, EL.-0.11 m, and EL.-0.28 m, respectively, and the standard deviations were ±0.21 m, +0.18 m, and +0.19 m, respectively.
Fig. 5 shows that PZ-1~3 develop an immediate water
[Table 2.] Basic Statistics of Tide, Groundwater Level and Rainfall

Basic Statistics of Tide, Groundwater Level and Rainfall
level response to rainfall, and PZ-4~8 the response to tidal changes. During the month of November in 2011 the groundwater level of PZ-2, especially, had been quickly reacted to the rainfall than PZ-1 and 3, because groundwater level of PZ-2 was initially higher than those of PZ-1 and 3.
For PZ-1~8, the maximum ranges of change occurring from such effects are 5.25 m, 5.00 m, 3.22 m, 0.85 m, 0.99 m, 1.02 m, 1.15 m, and 1.05 m, respectively.
For monitoring wells PZ-1~8, the mean groundwater levels during the study period were EL.-3.17 m, EL.+6.22 m, EL.+0.54 m, EL.+0.24 m, EL.+0.29 m, EL.+0.25 m, EL.-0.62 m, and EL.-0.09 m, respectively. The distribution characteristics of groundwater levels are shown in Fig. 6.
Although PZ-1 is a similar distance from the structures compared to PZ-2, it shows a relatively lower mean groundwater level than the other monitoring wells. This difference results from PZ-1 being located where the backfill medium is widely distributed due to excavation (Fig. 3). It is directly affected by artificial drainage, such as permanent dewatering system. In contrast, PZ-2 is located in a non-excavated area, as can be seen in the borehole data, and is not affected artificially by permanent dewatering system. With PZ-3 as the boundary separating east and west, the tidal (PZ-4~8) and rainfall (PZ-1~3) influence ranges can be seen. Among those located within the rainfall influence range, PZ-1 can be classified as the effect of permanent dewatering system, PZ-2 as the effect of undisturbed hydrogeological conditions, and PZ-3 as the effect of structural arrangement. On the other hand, groundwater level differences occur between the line connecting PZ-2 and 3 and 4 in the dry season. As suggested by Fig. 3, this groundwater level difference is attributable to the relatively wide distribution of non-excavated original strata, in contrast to the location of PZ-5~8.
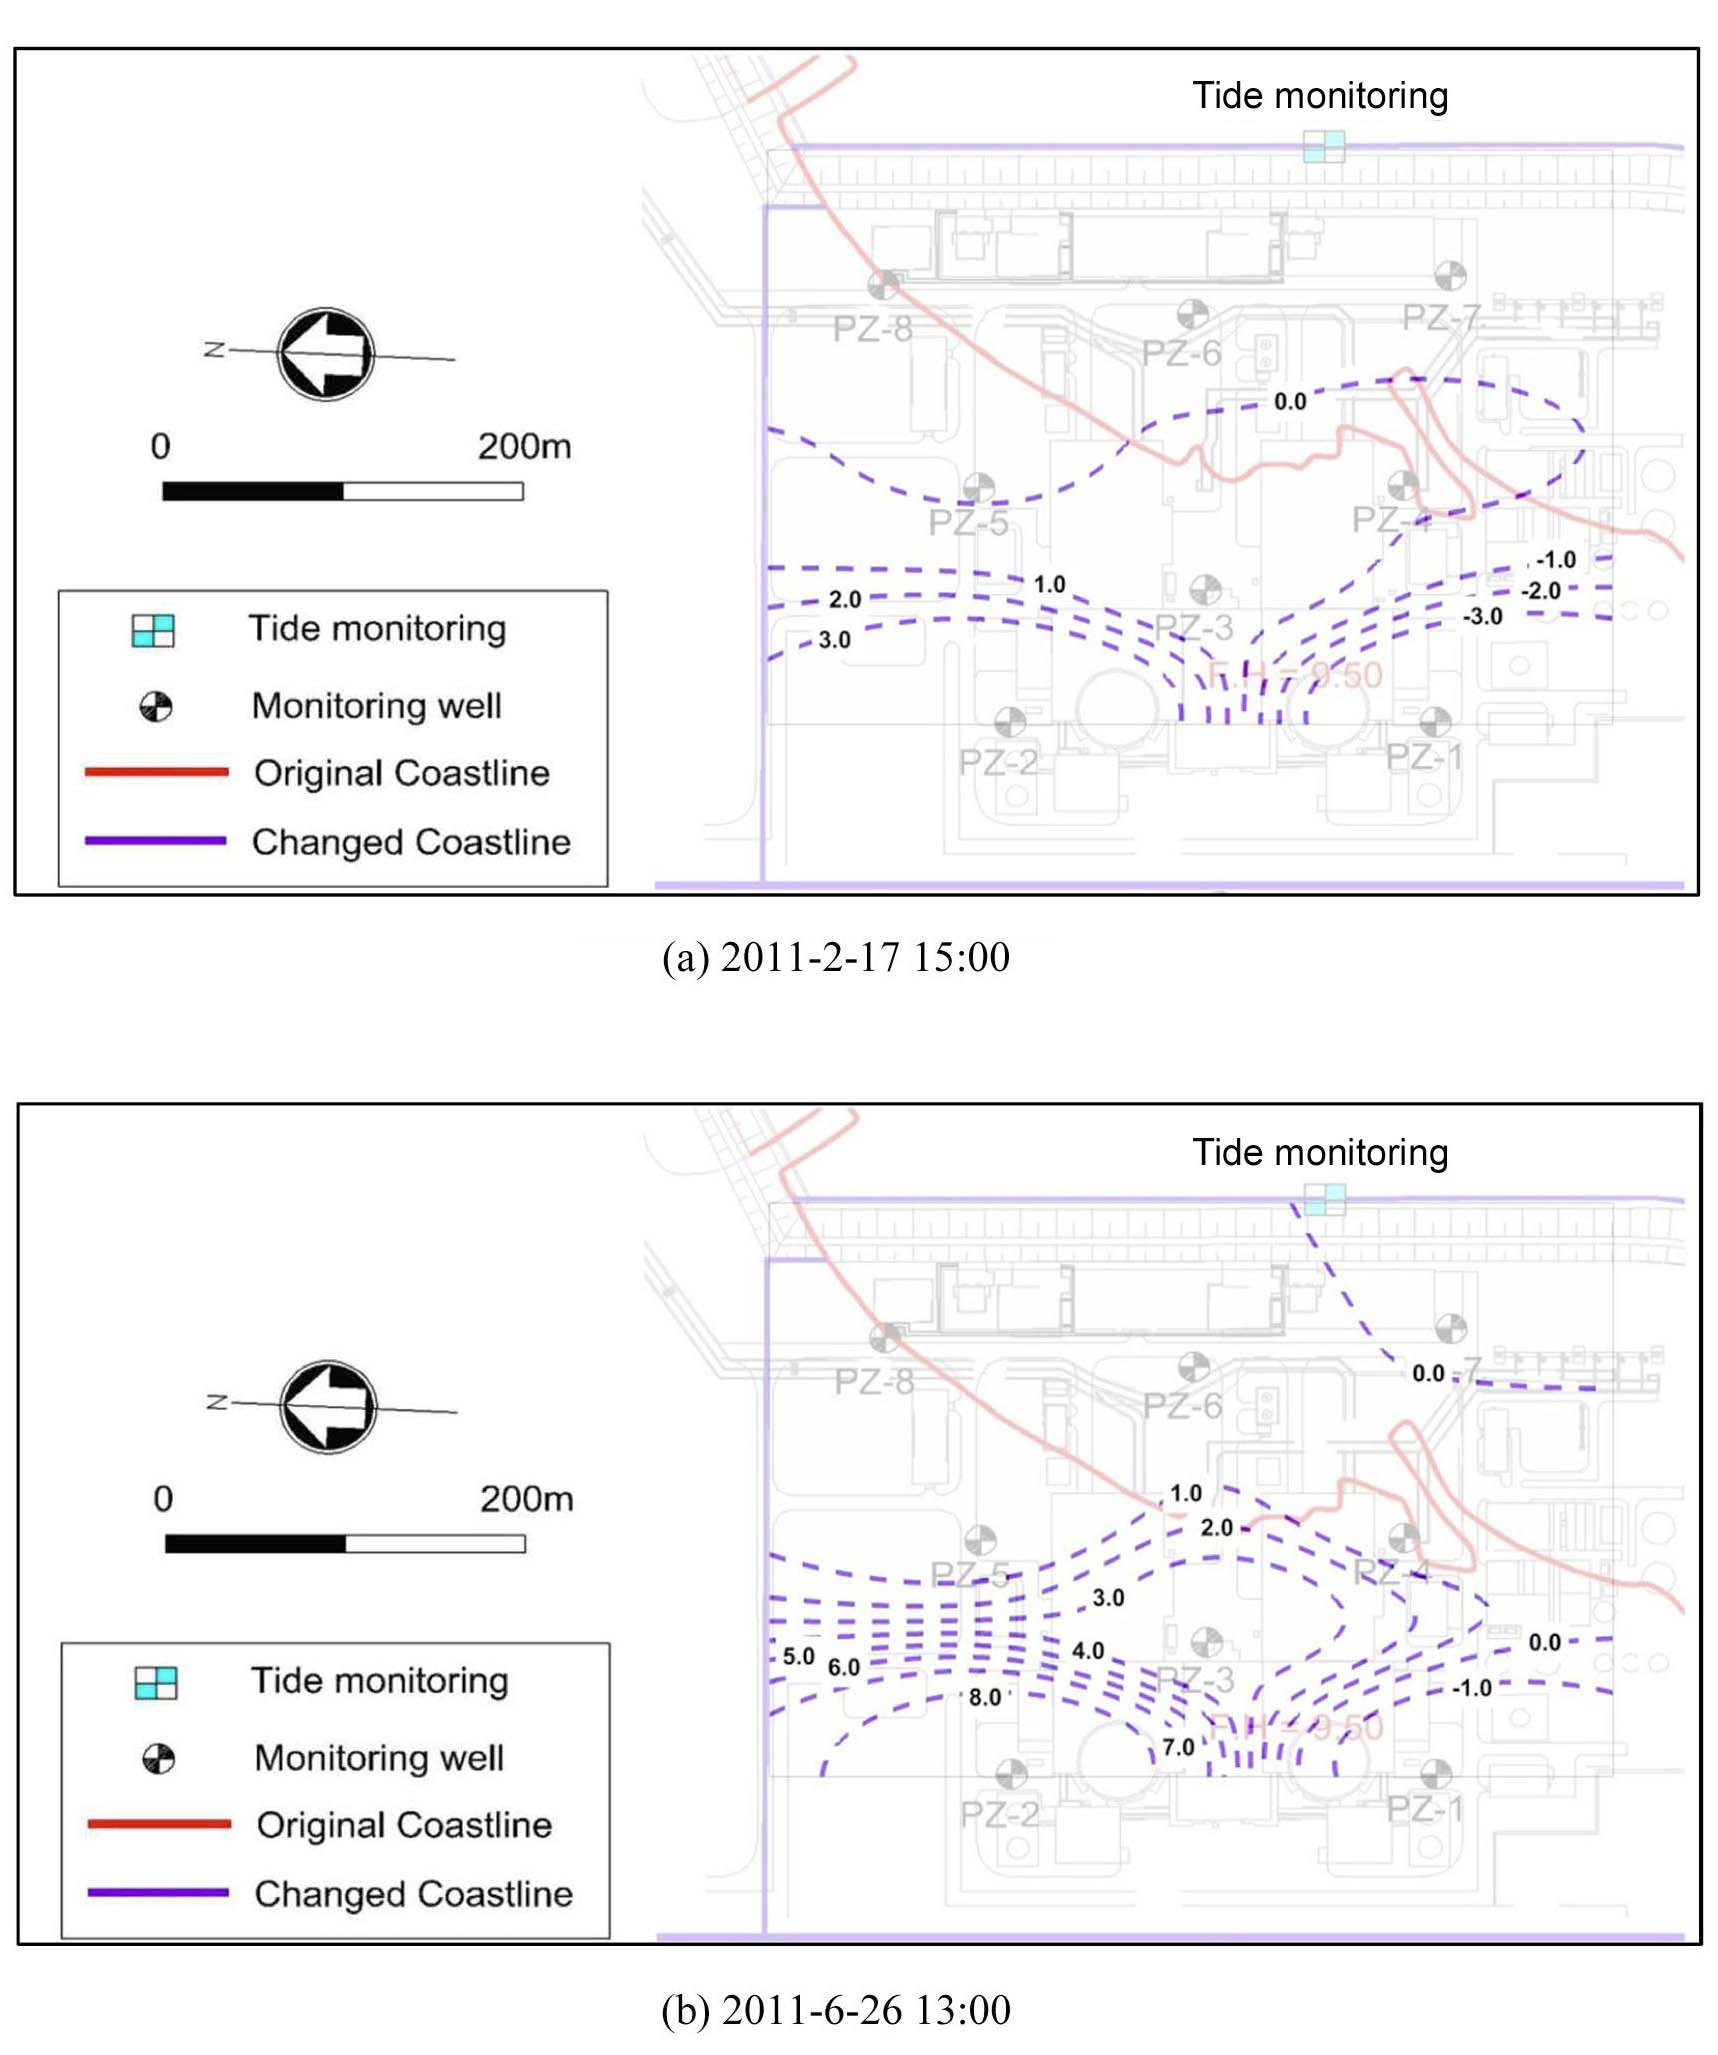
Fig. 7 shows how groundwater level distribution characteristics within the site change during the dry season (2011.2.17 15:00 KST) and the wet season (2011.6.26 13:00 KST).
The groundwater level within the site was higher in the wet season compared with the dry season, and this result accords with a report by Bjerklie et al. [23], who suggested that when recharge increases together with an increase in sea level, the groundwater level also increases. In other words, the increase in groundwater level occurs from the increase in recharge due to an increase in rainfall (total rainfall 27.5 mm from Feb 1 to Feb 17, and total rainfall 190.5 mm from June 1 to June 26) in high sea-level conditions of summer (dry season tidal level EL.-0.467 m and wet season tidal level EL.+0.010). The lower mean sea level during March and November compared with June is in agreement with the results of Lee et al. [24], who analyzed the characteristics of long-term changes in tides measured in Pusan harbor for 36 years from 1961 to 1996. They reported that the monthly mean sea level changes in an annual cycle, with the maximum value occurring during the summer season and the minimum value during the winter season.
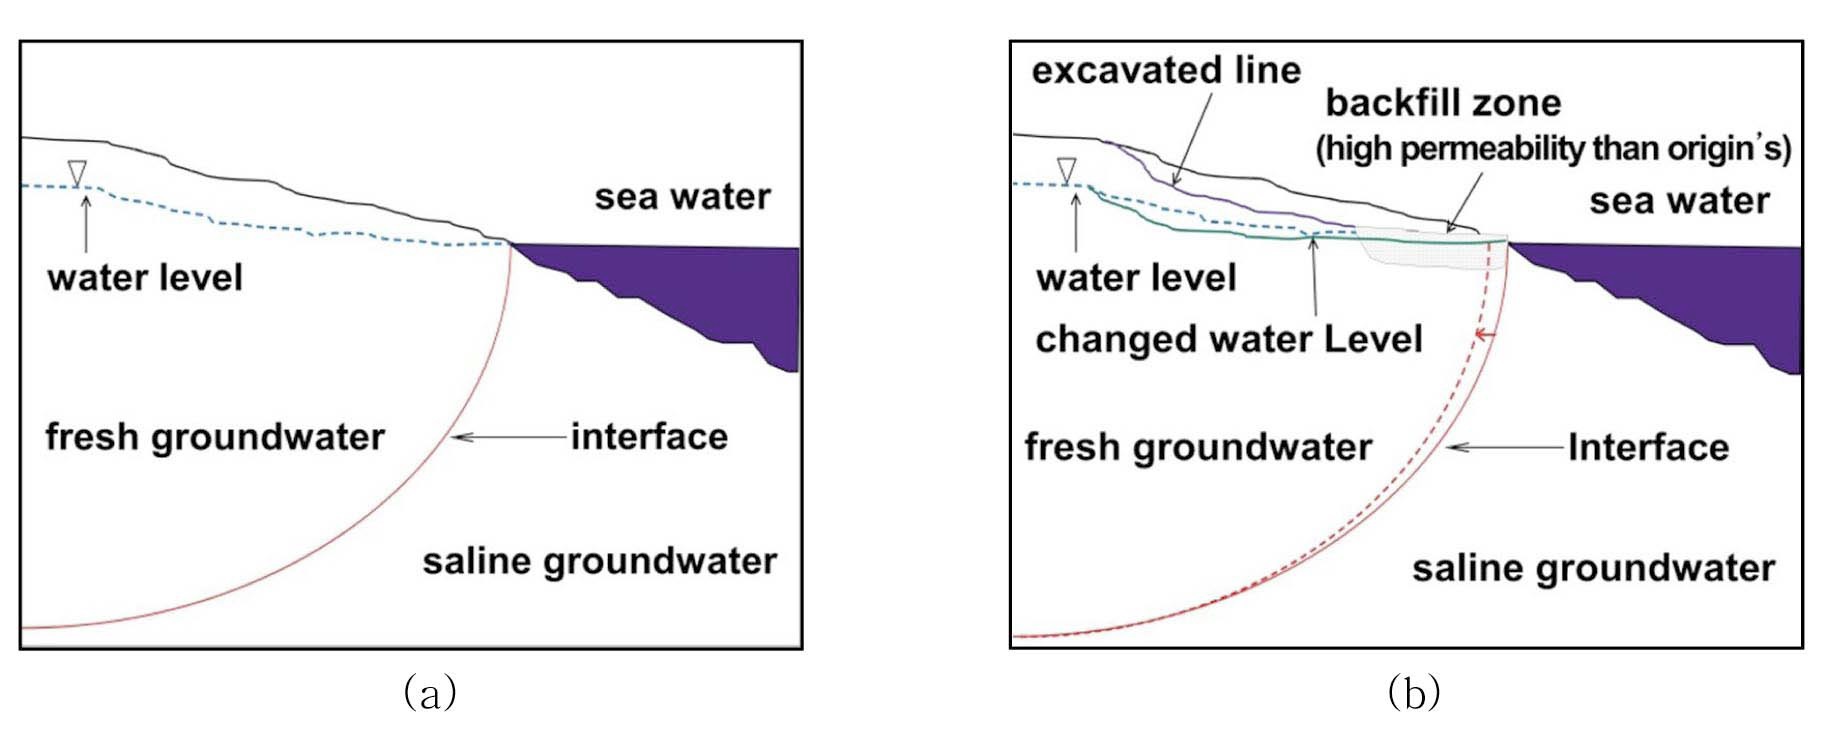
The mean groundwater level of PZ-7 (EL.-0.62 m) is lower than the mean tide (EL.-0.132 m); changes of the landform occurred during the development subsequently causes the change of the hydrogeologic profile and the groundwater table, They bring about changes in the groundwater flow system such as local lowering causes flow towards the depression. This may lead to saltwater intrusion.
So the sea-water interface in balance with fresh groundwater would move toward inland areas [25]. This results from the groundwater occurring lower in places that have been filled with a medium that has a relatively higher hydraulic conductivity compared with the original strata, as can be seen in Fig. 8 [26].
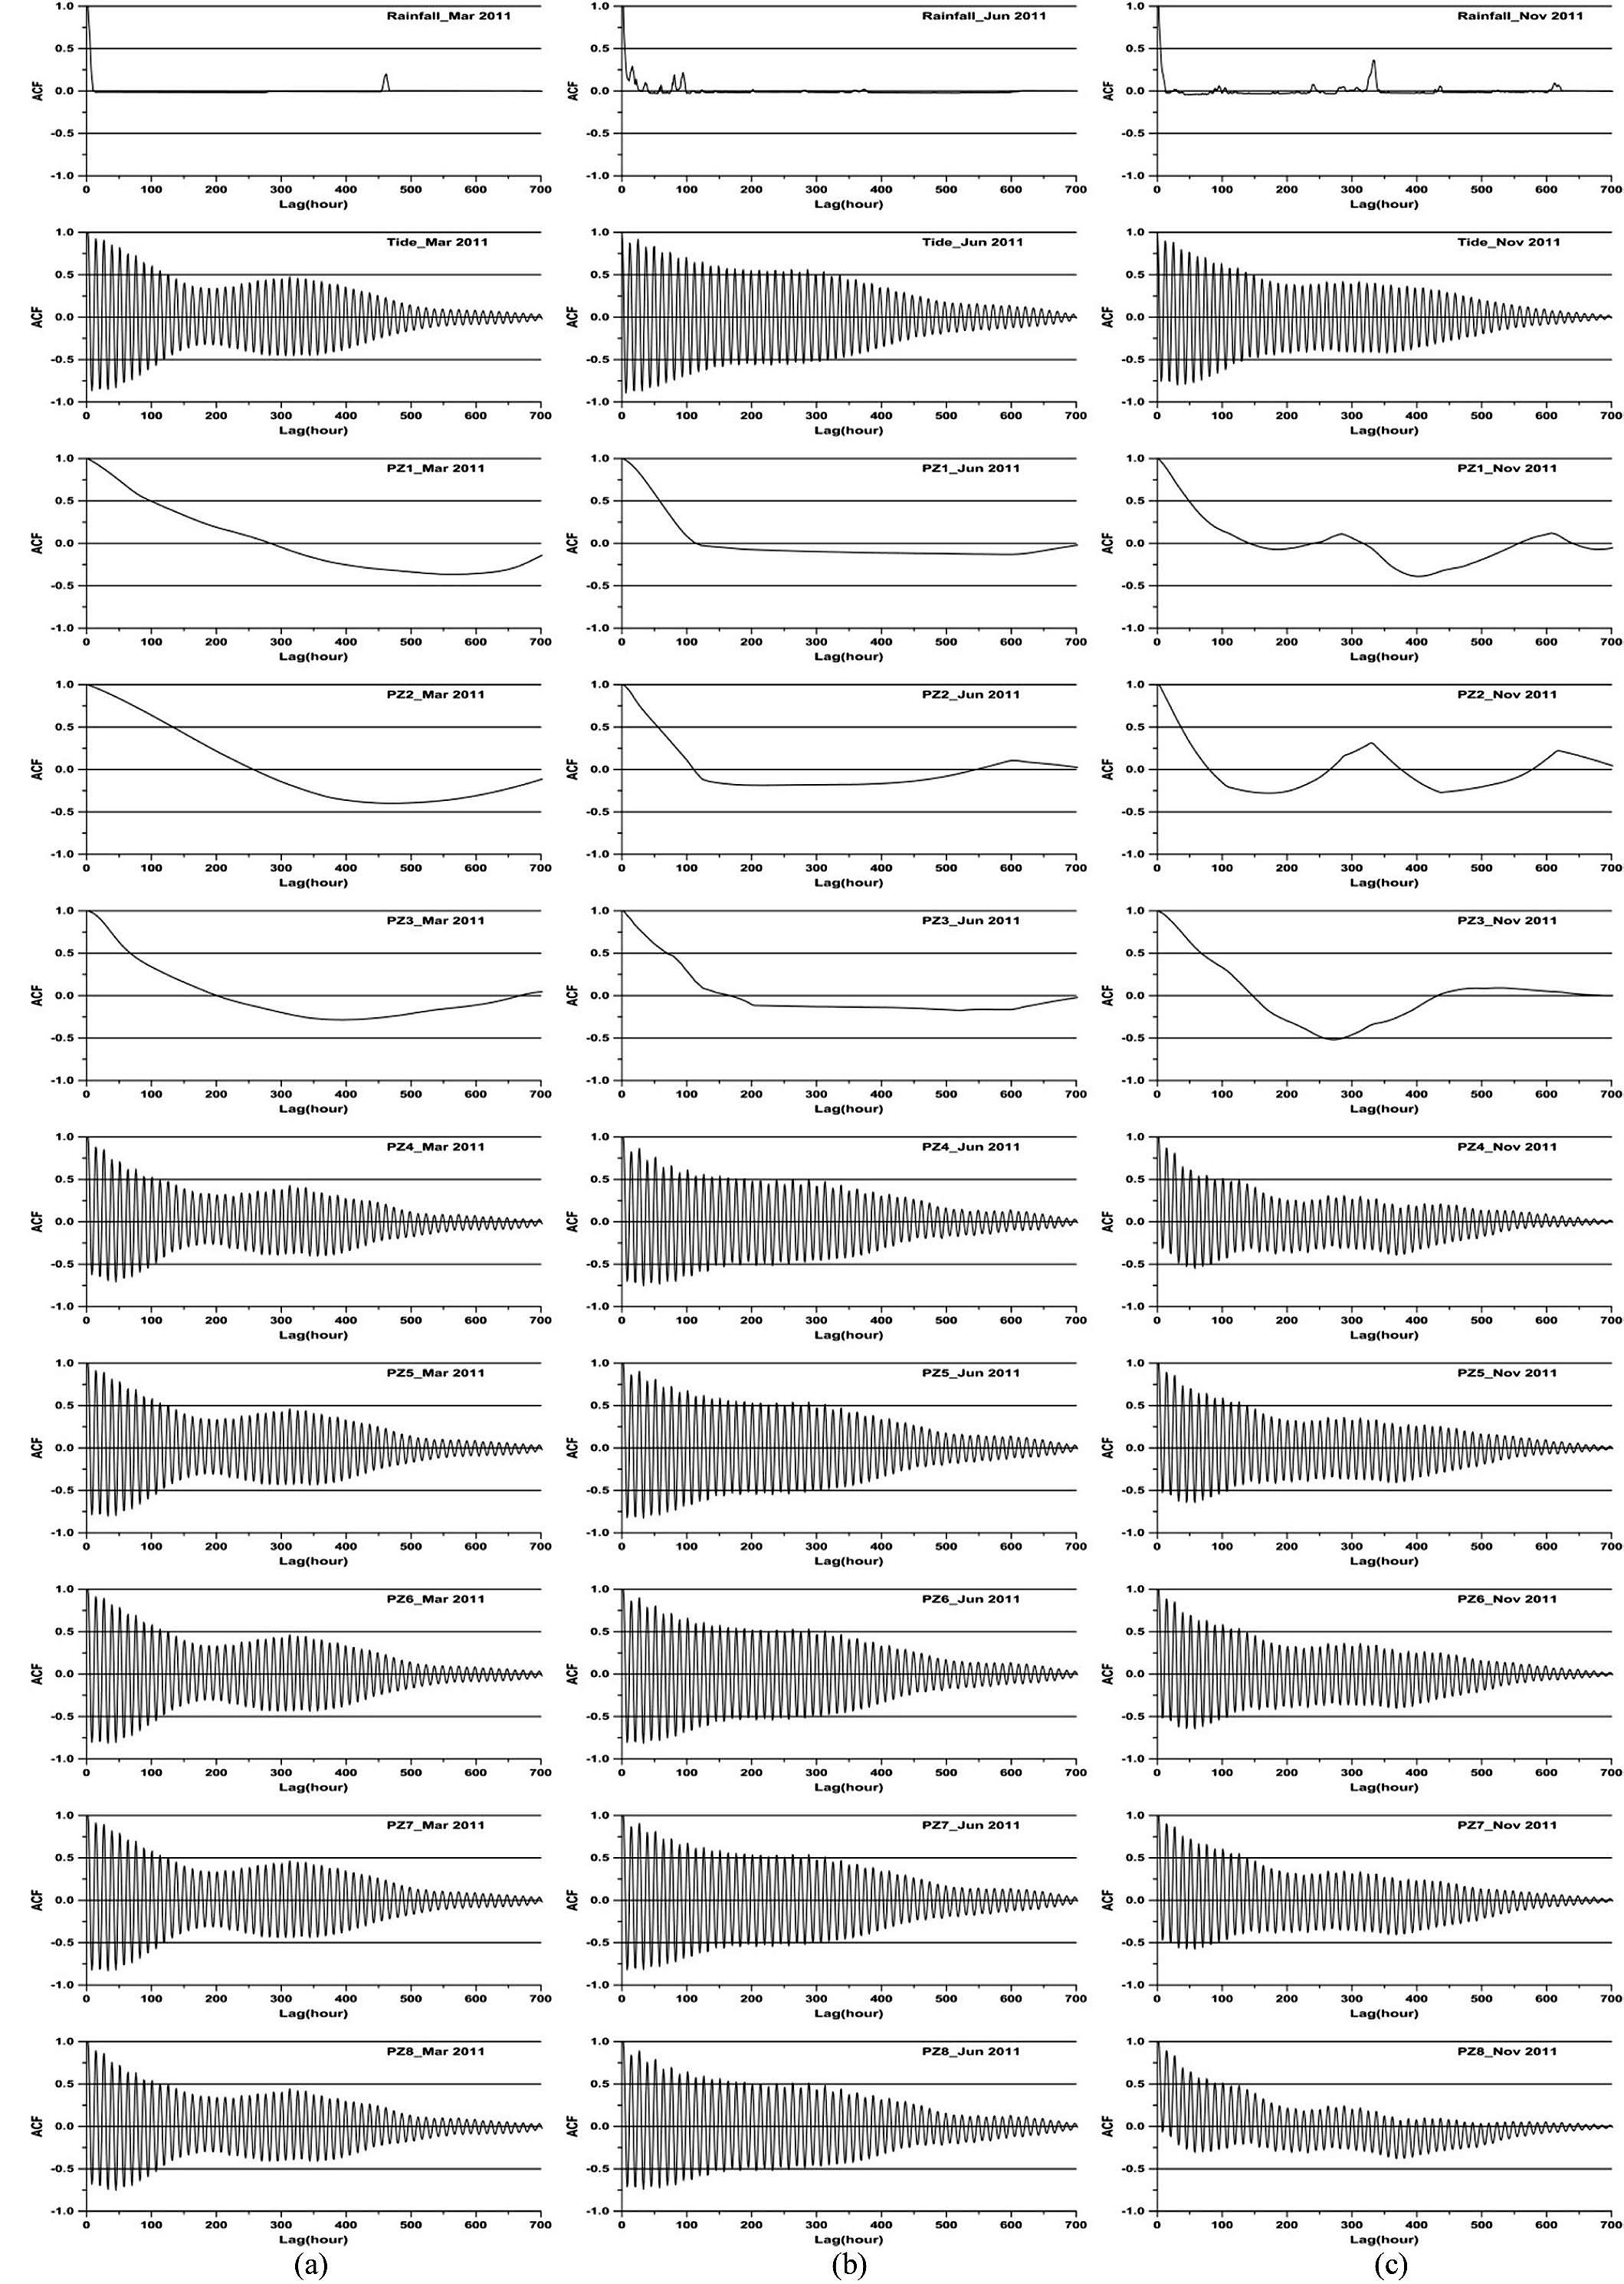
Fig. 9 shows the results of the auto-correlation analysis, which support the above qualitative interpretation regarding rainfall, tides, and groundwater levels in March, June, and November 2011.
Fig. 9. Auto-correlation function (ACF) of analysis period data for (a) March, (b) June and (c) November in 2011
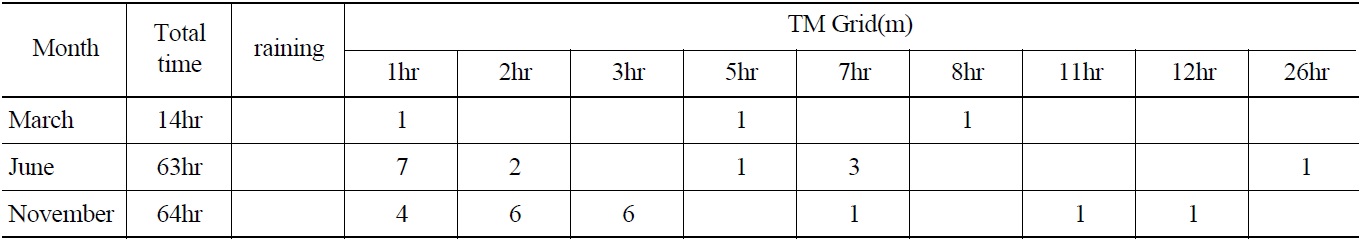
The auto-correlation analysis value for rainfall data reached 0 in a 10 hr lag time in March and November and in a 25 hr lag time in June. It was observed that rainfall data for June had stronger linearity and memory effect compared with March and November. Table 3 presents the frequency of different periods of rainfall based on a continuous measurement of hourly rainfall data during the study period. When the auto-correlation value of rainfall data for the lag time is obtained using this formula, the denominator value changes at the point where rainfall occurs. Therefore, it is considered that the difference in lag time for the auto-correlation value regarding rainfall data to reach 0 is related

Frequency of Each raining Periods and Total Raining Time for March, June and November in 2011
to the time during which rainfall is continuous.
The auto-correlation values for tides all reach 0 between 3 hr and 4 hr, and a subsequent secondary maximum value appears in a cycle with lag times of 12 hr and 13 hr, respectively. As can be seen in Fig. 9, the change in the autocorrelation form according to the analysis period is considered to result from the development of neap tides, which occur when the tidal difference is smallest and follow an approximately 14-15 day cycle. Compared to March, the tidal difference at neap tide is larger in June, and it again decreases in November. This can be confirmed through the changes in trends.
For PZ-1, 2, and 3 which are not directly influenced by tides, the auto-correlation values for groundwater level reached 0 in lag times of approximately 281 hr, 255 hr, and 198 hr in March, lag times of approximately 112 hr, 108 hr, and 164 hr in June, and lag times of approximately 139 hr, 77 hr, and 144 hr in November. On the other hand, for PZ-4, 5, 6, 7, and 8, which are directly influenced by tides, the auto-correlation values reached 0 in lag times of between 3 hr and 4 hr in March and June. However, in November, PZ-5, 6, and 7 reached 0 in lag times of between 3 hr and 4 hr, whereas PZ-4 reached 0 in a lag time of between 4 hr and 5 hr and PZ-8 in a lag time of between 5 hr and 6 hr. In addition, the secondary maximum value in these monitoring wells appeared in cycles with lag times
of 12 hr and 13 hr, respectively. Within the monitoring wells that are affected by tides, PZ-4 and PZ-8 showed different results from the other wells, so it can be presumed that a factor other than tide affected the changes in groundwater level.
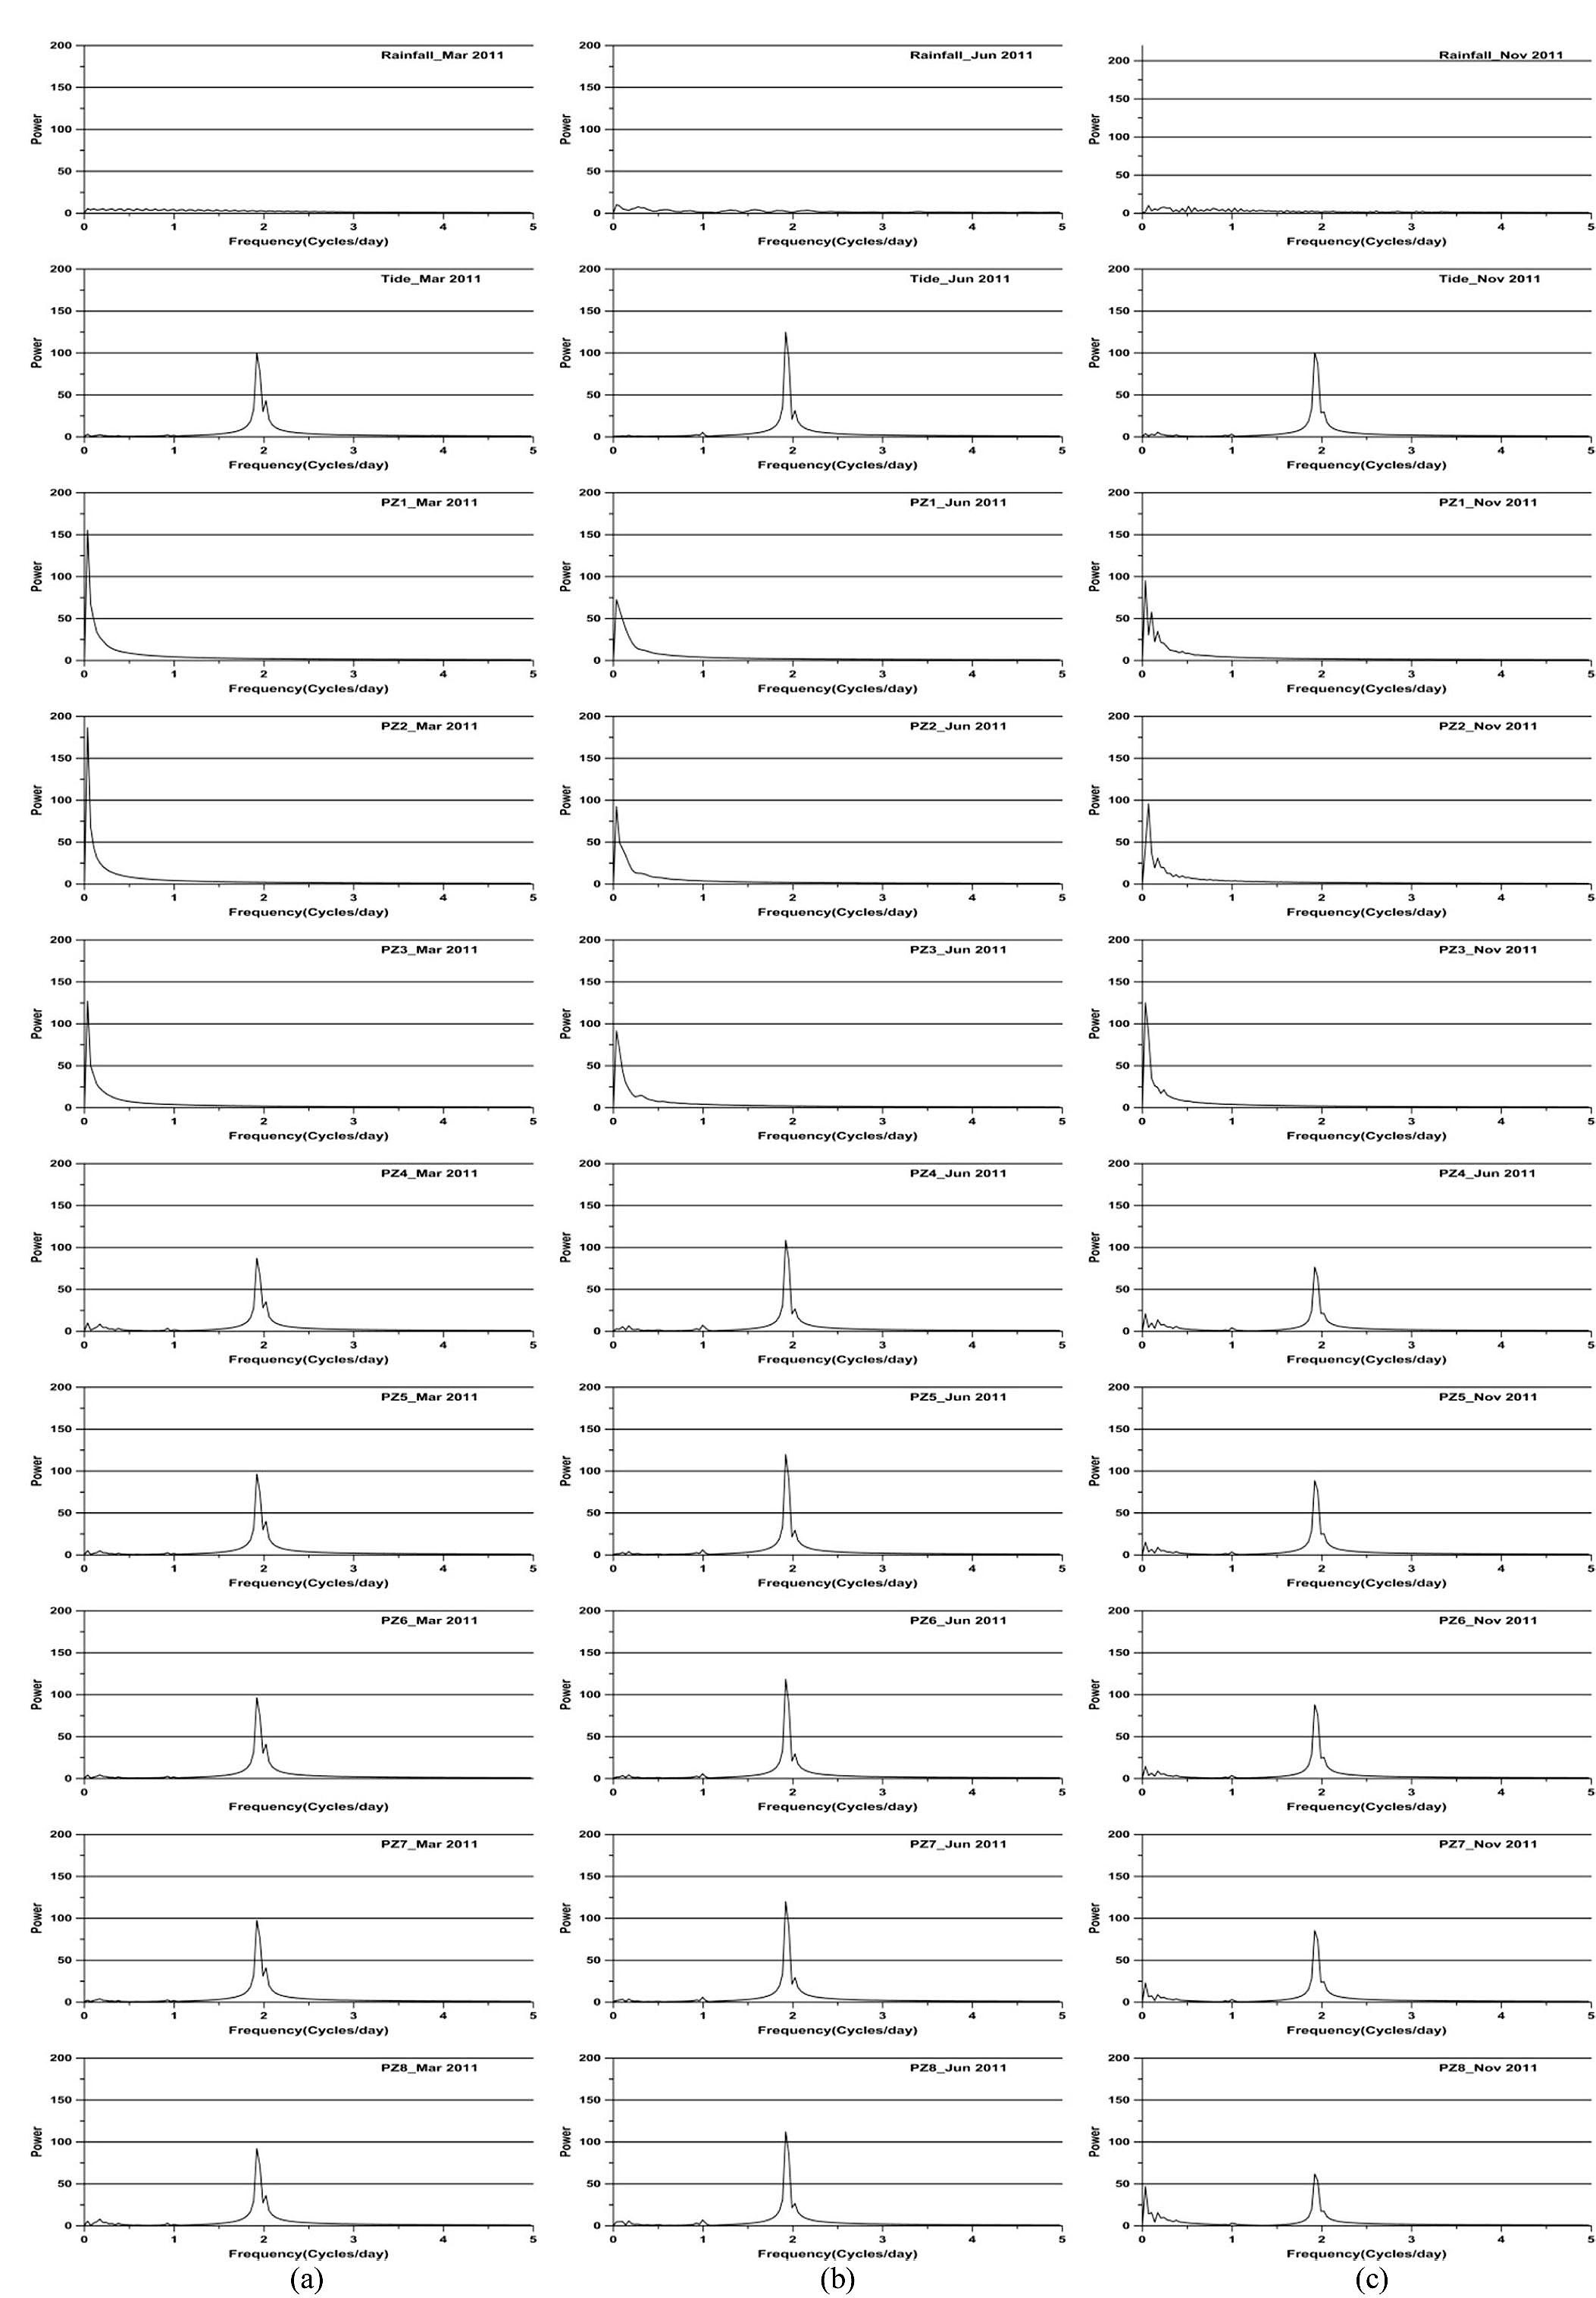
Fig. 10 shows the spectrum analysis results for rainfall, tides, and groundwater levels during the analysis period. The spectrum analysis results for rainfall show that in March and June, the power was 5.55 and 10.19, respectively, at Frequency 0.034 cycle/day, while in November the power was 10.24 at Frequency 0.068 cycle/day. No periodicity was identified regarding the analysis period.
The spectrum analysis results for tides show that in all 3 months of the analysis period, power appeared strongly at frequency 1.920 cycle/day and 2.022 cycle/day. In addition, periodicity could be observed at frequency 0.925 cycle /day in March and frequency 0.994 cycle/day in June and November. This periodicity is in agreement with the M2 component (12.421 hr) and S2 component (12.000 hr) of the semidiurnal tides, as well as the O1 component (25.819 hr) of the diurnal tides, which occurs due to the influence of the moon and sun, as suggested by Hsieh et al. [27].
According to the analyzed results of PZ-1, 2, and 3, the power for PZ-1 and 3 reach maximum values at frequency 0.034 cycle/day in each month, while for PZ-2 the power reaches a maximum value at frequency 0.034 cycle/day in March and June and 0.068 cycle/day in November, respectively. These results are considered to reflect the effect of rainfall on these monitoring wells, and PZ-2 especially seems to be more directly affected by rainfall compared with PZ-1 and 3.
The analyzed results of PZ-4, 5, 6, 7, and 8 show similar periodicity to the spectrum analysis results for tides, so they are considered to be directly affected by tides. However, the power values of PZ-4 and 8 at M2 and S2 appear to be lower than the power values of PZ-5, 6, and 7. As mentioned in the section on time series data, such results indicate that there exist artificial factors in addition to the effect of tide.
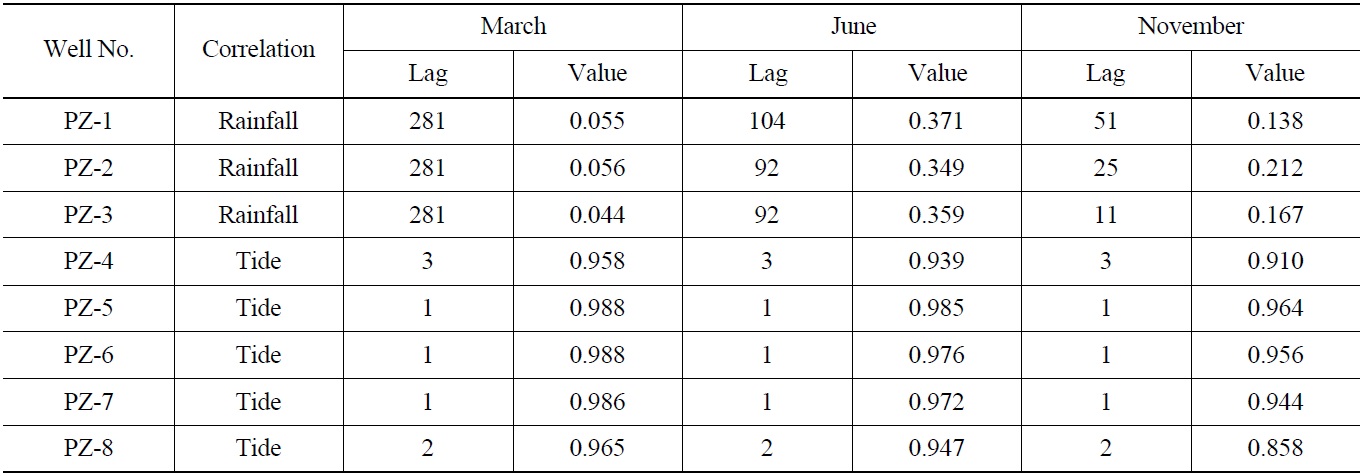
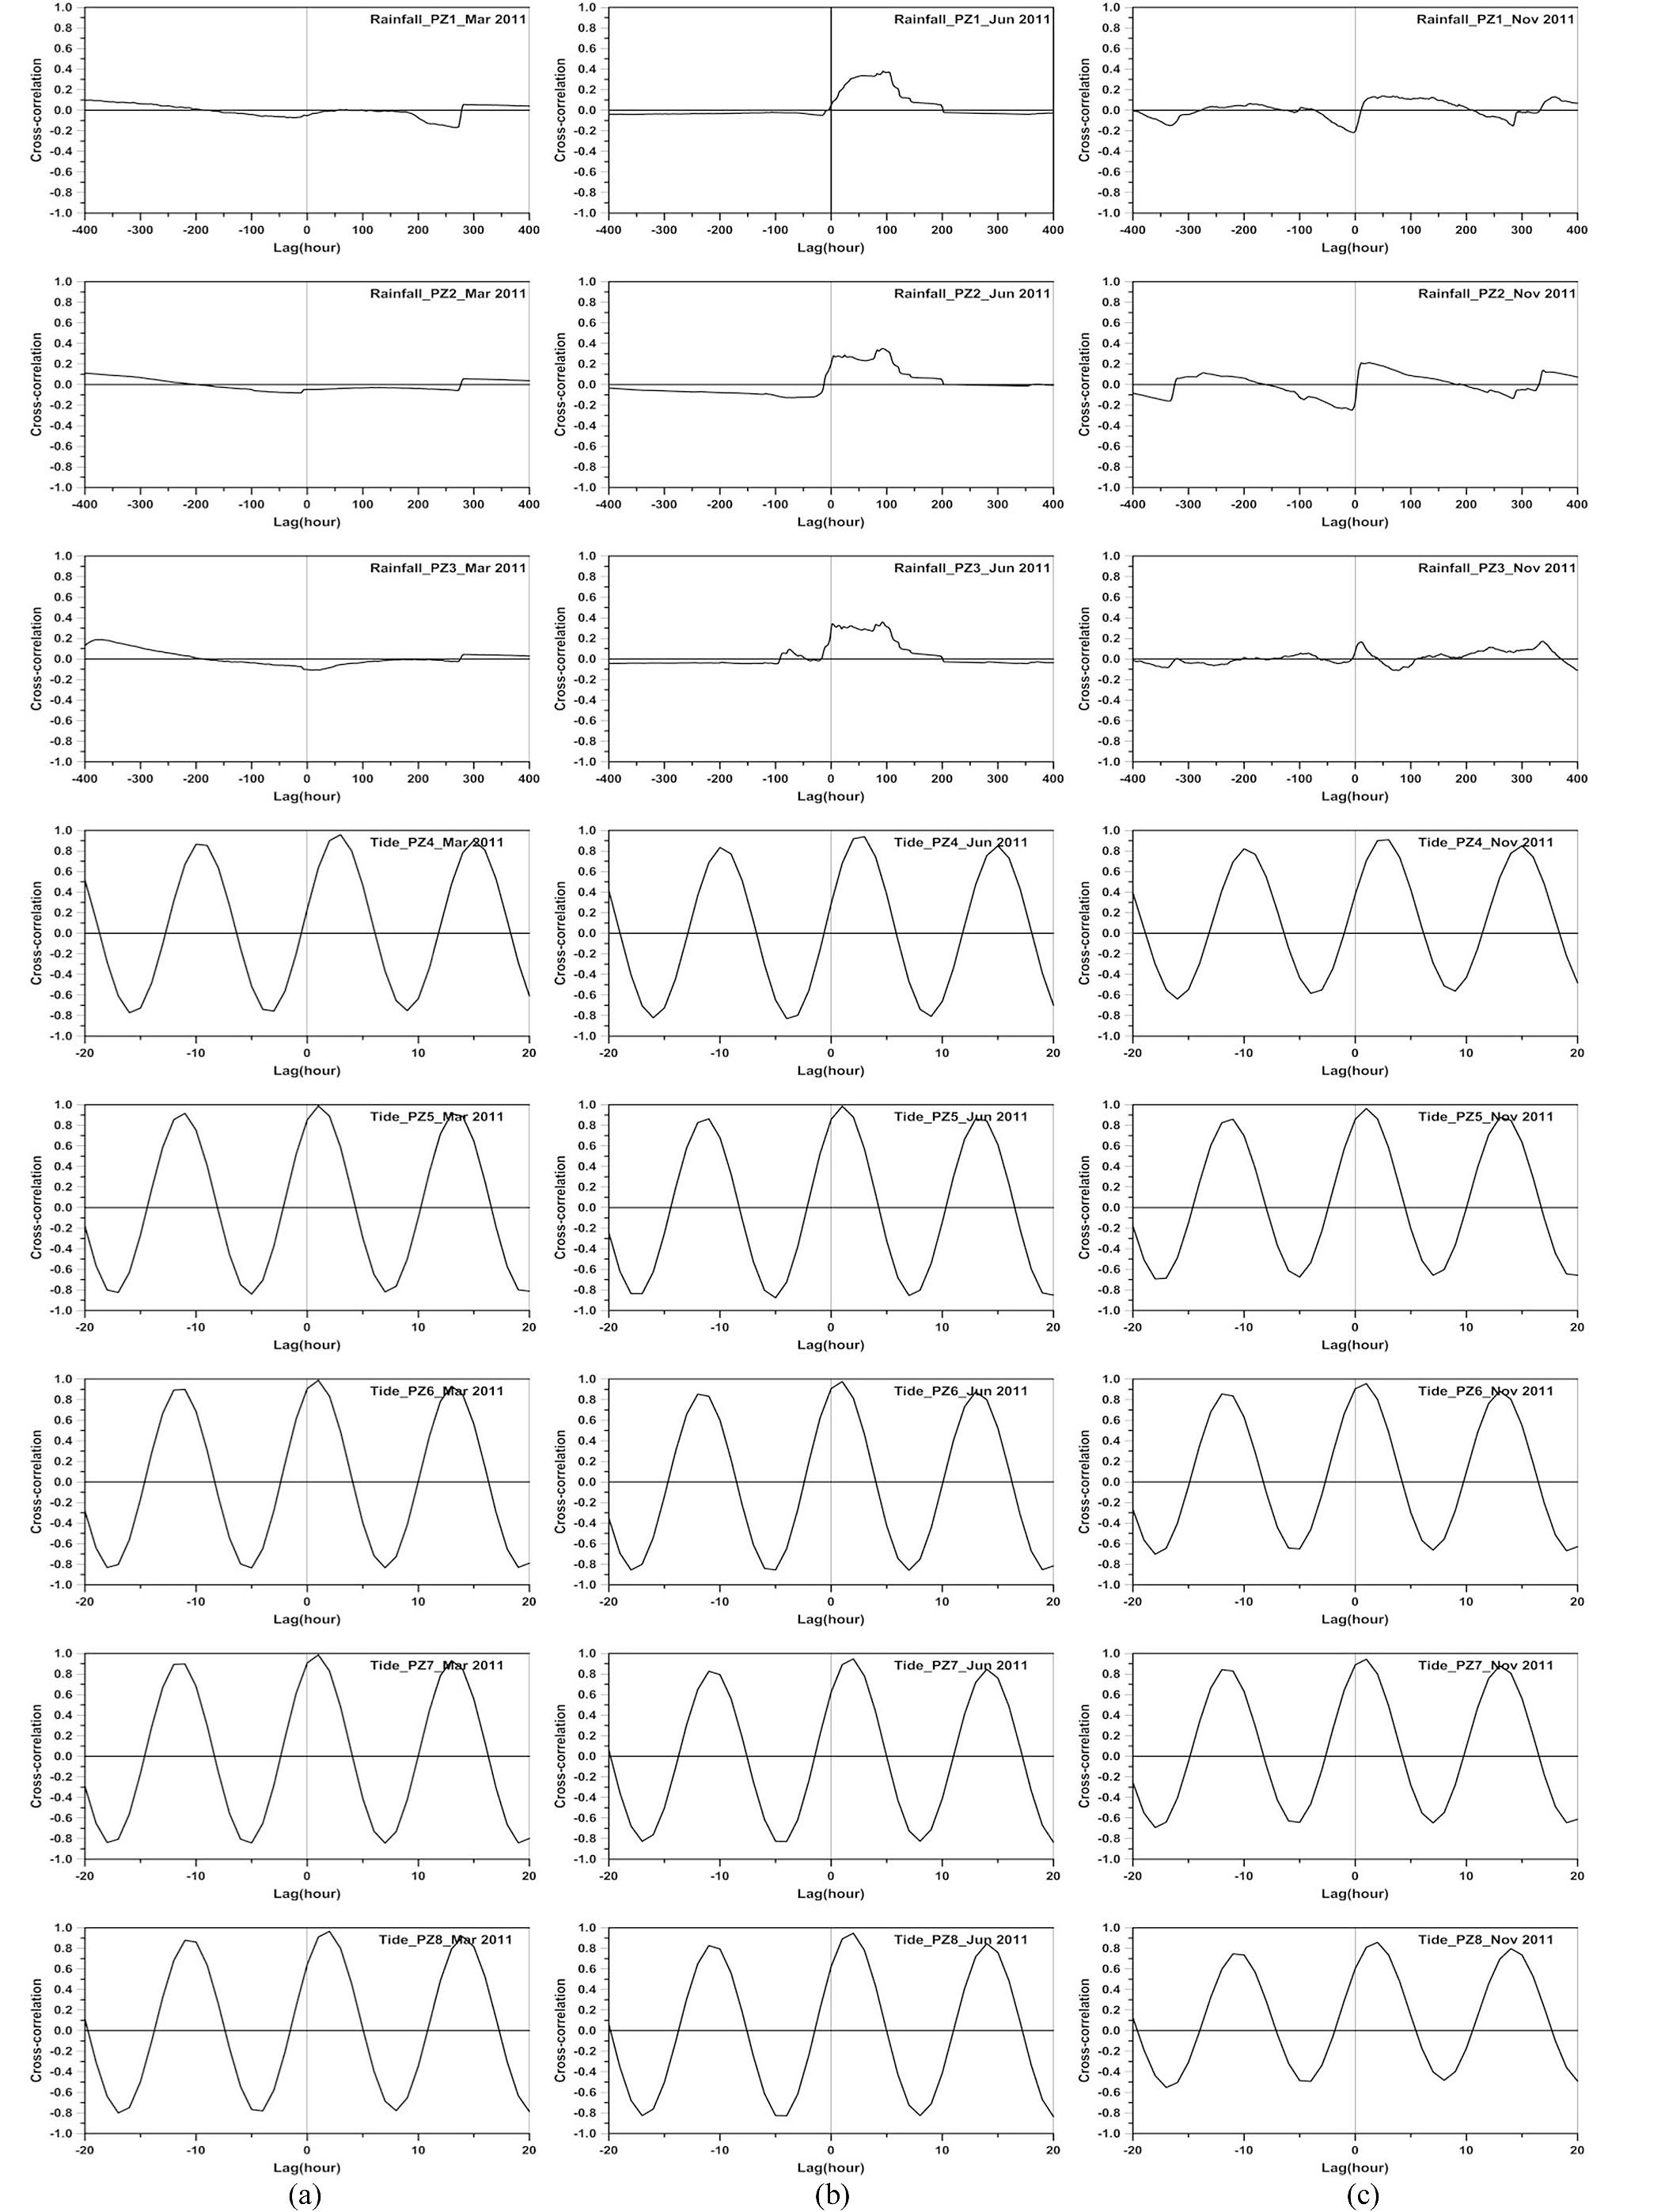
Cross-correlation between Groundwater Level and Rainfall or Tide for Each Analysis Period in 2011
4.4 Cross-correlation Analysis
On the basis of analyzing continuous measurement data and time series analysis results, the cross-correlation analysis was performed regarding rainfall (PZ-1, 2, and 3) and tides (PZ-4, 5, 6, 7, and 8) (Fig. 11). Table 4 organizes the crosscorrelation analysis results.
The cross-correlation analysis results for groundwater levels and rainfall show that in March, the maximum value appeared at a lag time of 281 hr for PZ-1, 2, and 3; in June, the lag time was 104 hr for PZ-1, while PZ-2 and 3 had a lag time of 92 hr. In November, the maximum value appeared at lag times of 51 hr, 25 hr, and 11 hr for PZ-1, 2, and 3, respectively. The shorter lag time in November compared with June in the cross-correlation analysis results is considered attributable to the increase in the groundwater level during the wet season and the subsequent decrease in the thickness of the vadose zone.
The influence of rainfall on groundwater level can be confirmed in these monitoring wells. At the same time, in contrast to PZ-2 and 3, PZ-1 had a relatively larger lag time in June and November, indicating an artificial influence such as the permanent dewatering system.
The cross-correlation analysis results for groundwater levels and tides showed that during the analysis period, PZ-4 and PZ-8 had lag times of 3hr and 2hr, respectively, while PZ-5, 6, and 7 had a lag time of 1hr. As shown in Table 1, PZ-8 is closer to the coast than are PZ-5 and 6, and even though it is located a similar distance from the coast compared to PZ-7, it shows a relatively larger lag time. This is considered to be caused by a decreased effect of tides, as subsurface structures adjacent to PZ-8 exist under the groundwater surface. PZ-4 and 5 are located similar distances from the coast, but the lag time is larger in PZ-4 than in PZ-5. The reason for this is that the backfill medium is distributed relatively more deeply and widely at the location of PZ-5 compared with PZ-4, as seen in the stratum distribution characteristics (Fig. 3).
To establish an aging management plan, which is required for the long-term operation of a nuclear power plant, it is necessary to understand the characteristics of groundwater flow within the site. To establish such an understanding, this research performed a basic statistical analysis, groundwater distribution characteristics analysis, time series analysis, and the cross-correlation analysis using the groundwater level data recorded in the monitoring wells installed within a power plant site. The influence factors regarding groundwater flow within the site were identified to establish an aging management plan appropriate for the Shin Kori Unit 1 and 2 site.
1) The analysis of changes in groundwater level showed that the site broadly can be divided into a rainfall effect area (PZ-1~3) and a tide effect area (PZ-4~8).
2) The analysis of the mean groundwater level over the entire study period and the groundwater distribution characteristics of the dry season and wet season showed that the groundwater level within the site increased in the summer season due to the high sea level and large amount of rainfall. Groundwater was lower in PZ-1 due to artificial elements, such as the effect of permanent dewatering system due to the wide distribution of backfill medium resulting from excavation. On the other hand, PZ-2 is located in an area with less influence from excavation during construction, so it is not affected by permanent dewatering system and, hence, the groundwater level is higher. In addition, PZ-7 showed a groundwater level lower than sea level due to the effects of reclamation using material of high hydraulic conductivity.
3) In the spectrum analysis results of groundwater data affected by tides (PZ-4~8), M2 component (12.421 hr) and S2 component (12.000 hr) of the semidiurnal tides, and O1 component (25.819 hr) of the diurnal tides were identified. However PZ-5~7 reached 0 in equal lag times of between 3 hr and 4 hr during the entire analysis period, but PZ-4 reached 0 in lag time of between 4 hr and 5 hr in November, and PZ-8 reached 0 in a lag time of between 5 hr and 6 hr. In the crosscorrelation analysis result of the tide and groundwater level, it can be divided into lag time 1 hr (PZ-5, 6, and 7), lag time 2 hr (PZ-8), and lag time 3 hr (PZ-4) during the entire analysis period. When the auto-correlation analysis and the cross-correlation analysis results are combined for monitoring wells affected by tide, PZ-4 has a relatively low excavation depth, so it is less affected by backfill area, while PZ-5 is affected by backfill from excavation, and PZ-8 is affected by the concrete structure that exists under the groundwater surface.
These results indicate that to establish an aging management plan for Shin Kori Unit 1 and 2, consideration should be given to artificial geographical and geological changes, such as the effect of excavation during construction (PZ-1, 2, 3, 4, 5, and 7), placement of artificial structures (PZ-3 and 8), and placement of permanent dewatering system (PZ-1). Also, the effect of changes in the local natural environment, such as tides (PZ-4, 5, 6, 7, and 8) and rainfall (PZ-1, 2, and 3), should be taken into account.