Quartz is the most abundant crust-forming mineral on earth. This mineral contributes to the formation of crystalline rocks such as granite, gneiss, and sandstone. These rocks are typically found in bedrock formations, which create a natural barrier for high-level radioactive waste (HLW) disposal. Disposal facilities are required for nuclear power plants and are usually planned for areas deeper than 300 m below the surface [1]. In these facilities, bentonite is considered to be a buffer material for both engineered and natural rock barriers. In engineered barriers, bentonite consists of approximately 50% quartz by weight. Many studies have reported on the use of Na-bentonite as the material in engineered barriers in HLW disposal facilities, due to its properties of high swelling and absorbability [2-4].
In this respect, it is important to analyze the behavior of engineered and natural barriers to ensure their safety over long periods of time and their ability to prevent highlevel radioactive waste from contaminating areas in which people live and work. At a basic level, it is meaningful to study the behavior of quartz, given that it forms part of most natural and engineered barriers under deep subsurface conditions. Many studies have found that quartz exhibits a notably slow rate of dissolution at room temperature. Therefore, to achieve rapid dissolution at room temperature, other methods should be considered, including 1) expanding the surface area of quartz to increase the reaction area and 2) applying high pressure to the contact area of crystals to increase the dissolution rate. However, dissolution of the surface of quartz is difficult to observe when using powdered quartz to maximize the surface area. Therefore, we used beads and single quartz crystals to observe and analyze the dissolution of the surface. The former can be used to maximize the surface area of quartz, and highpressure conditions can be applied to the latter. A confocal laser scanning microscope (CLSM) was subsequently used to observe the dissolution patterns on the quartz surface. The purpose of the study is to analyze the behavior of bentonite or crystalline rocks over long periods because these materials are used as buffer materials in high-level radioactive waste-disposal facilities.
2. QUARTZ DISSOLUTION UNDER HIGHALKALINITY CONDITIONS
Silicon, an element in quartz, has a stronger molecular bonding force with oxygen than with other silicon atoms. Silicon plays an important role in the formation of most crustal rocks. Quartz is a silicate mineral [5] consisting of a SiO4 tetrahedron with a silicon atom and four oxygen atoms. The crust of earth mostly consists of silicates because the Si-O bond is more stable than other bonds. Each type of silicate is classified by the number of oxygen molecules shared at the vertex of the tetrahedron. Silicates that share four oxygen atoms at the four vertices of the tetrahedron are referred to as SiO2.
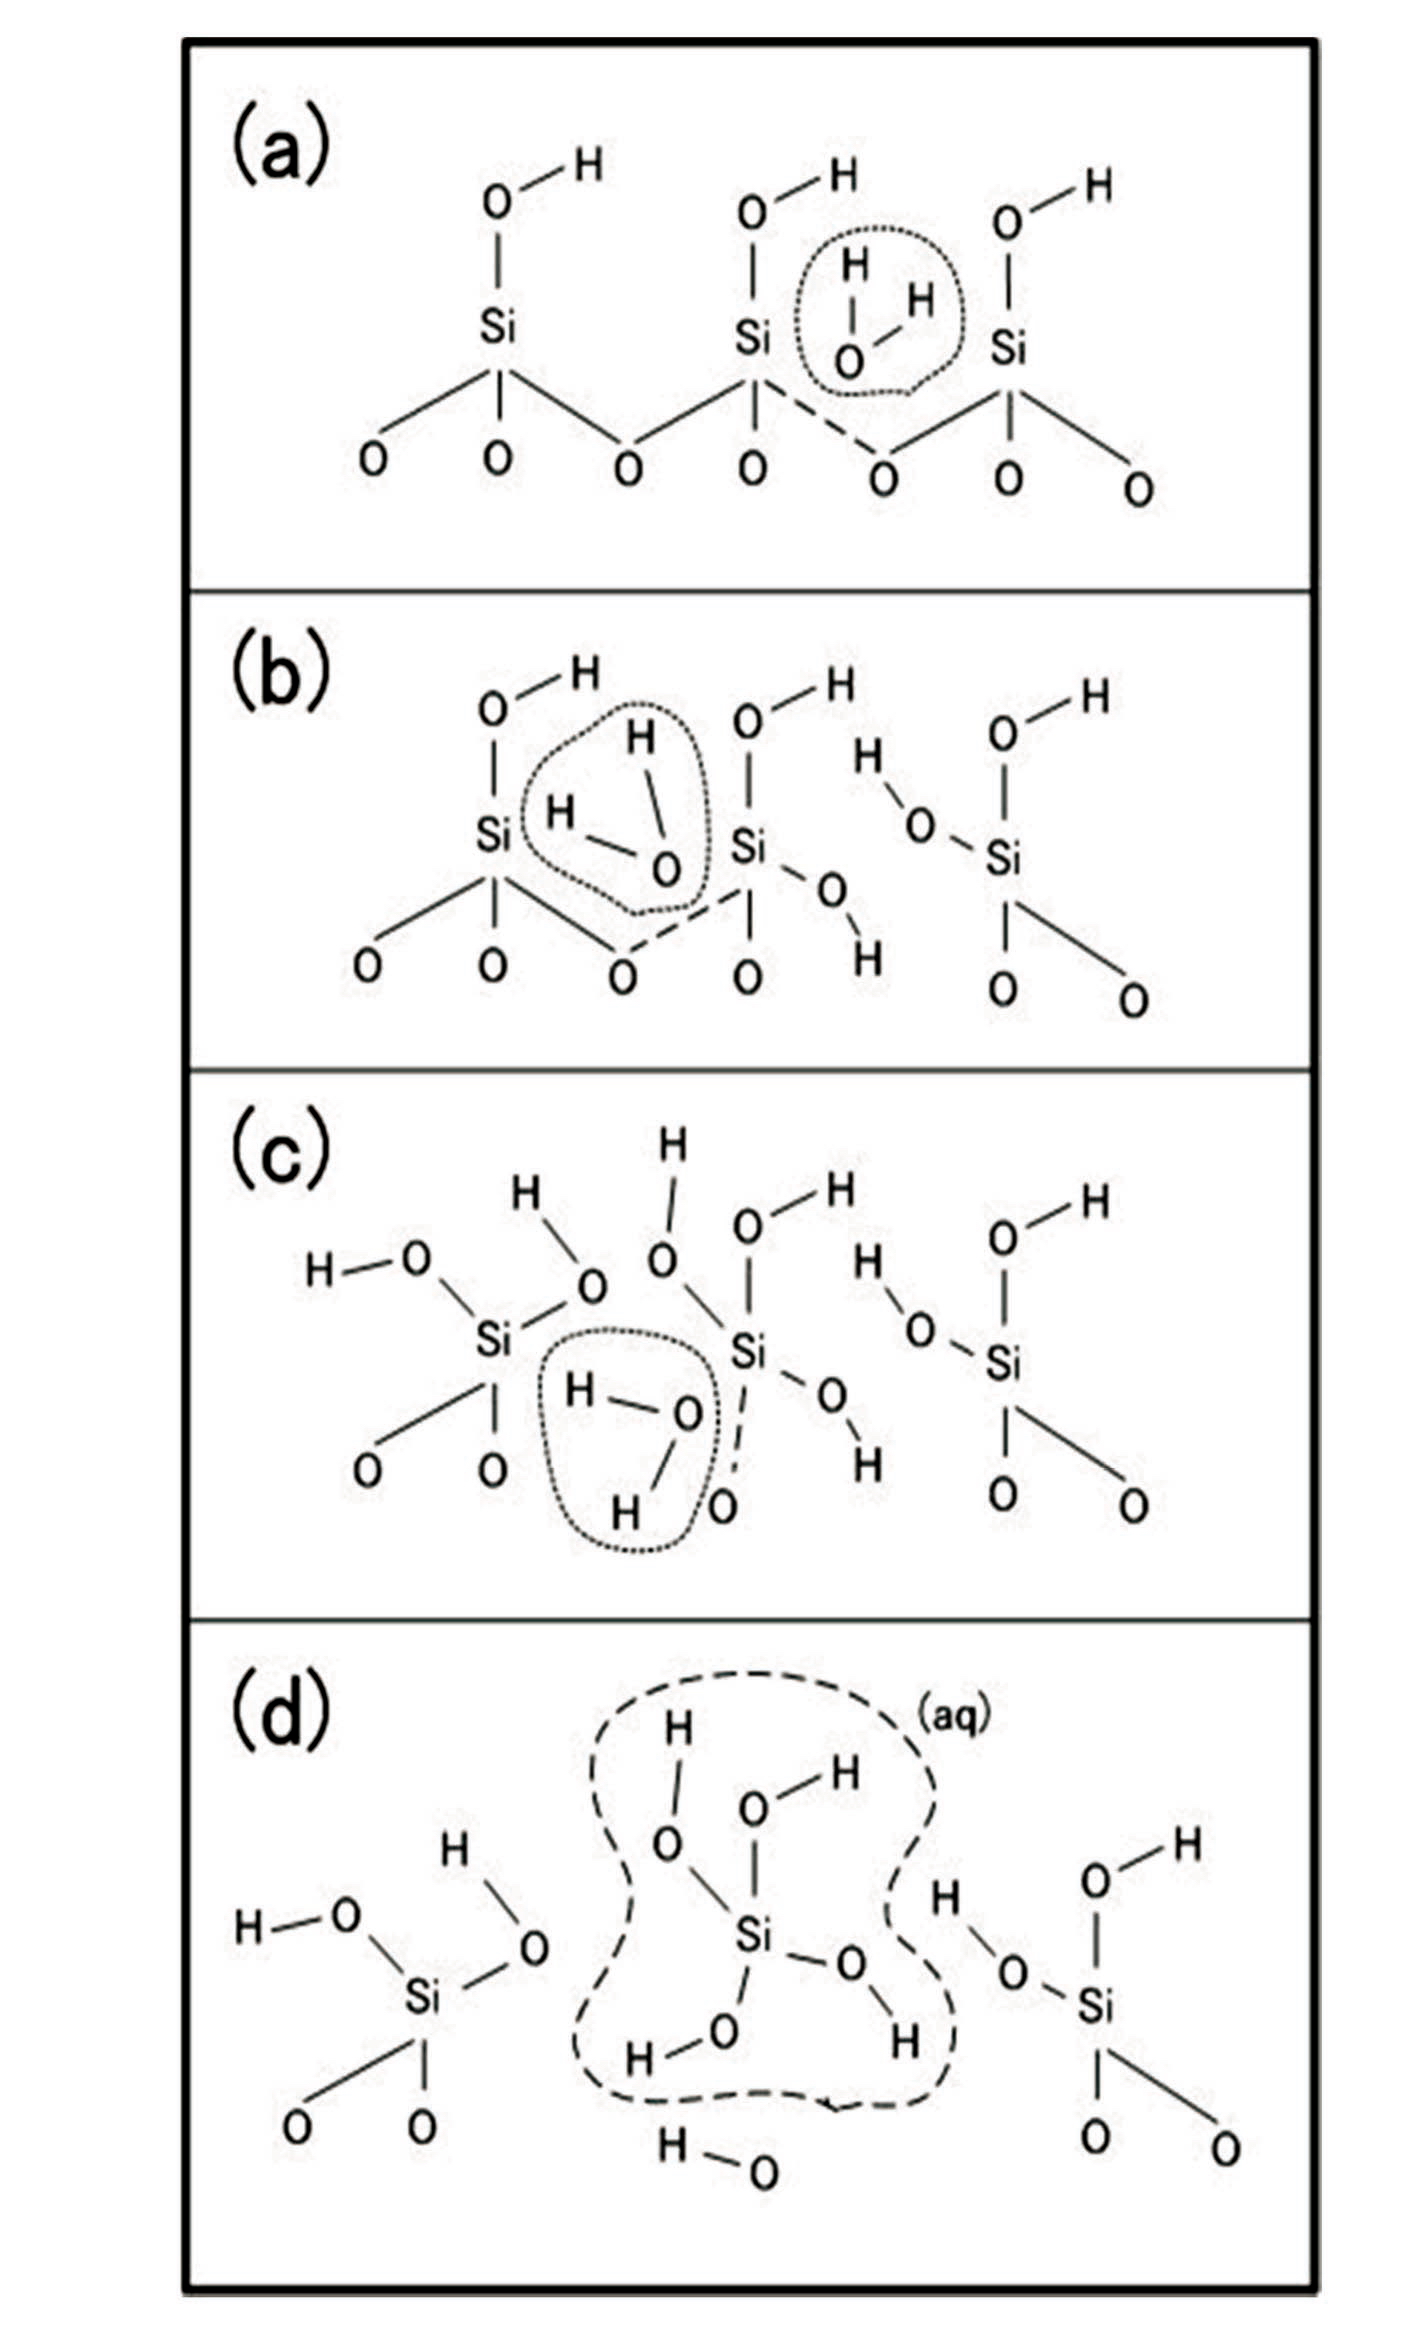
Quartz has covalent bonds at the vertices of the SiO4 tetrahedron. When the quartz reacts with H2O under watersaturated conditions, it begins to dissolve. Quartz dissolution proceeds as follows: each water molecule attaches to the surface of an oxygen atom in the SiO4 tetrahedron; as a result, a hydrogen molecule breaks the Si-O-Si bond at the vertex of the SiO4 tetrahedron; finally, dissolution occurs (Fig. 1 (a)-(c)). When this process occurs at all vertices of the tetrahedron, an H4SiO4 complex is removed from the surface (Fig. 1(d)).
3. THE QUARTZ DISSOLUTION EXPERIMENT
Minerals in porous media generally can be dissolved at room temperature under high pressure. These dissolved materials move by diffusion or advection. This process is often referred to as deformation by pressure dissolution [6-15]. Brady and Walther [8] studied the effect of pH on quartz dissolution at 25℃ and calculated the dissolution rate of quartz at various pH levels. These researchers found that the reaction between H+ on the surface of quartz and OH- in the water plays an important role in the dissolution ratio of quartz between pH of 5 and 12.
In the present study, we performed a dissolution experiment at a pH of 12.7 based on the high-alkalinity environment formed by the cement used for building underground storage facilities [1]. Two experiments were performed: the dissolution of quartz beads using samples approximately 1 mm in diameter and a cylindrical quartz dissolution experiment using a single crystal of quartz. The (001) plane of a single cylindrical crystal sample was used as a contact area for 14 days. During the experiment, the room temperature was held at 25℃, and a high-alkalinity NaOH solution was used with a pH of 12.7. After each experiment, the dissolved surface of each quartz sample was observed using the CLSM.
3.1 The Quartz Bead Dissolution Experiment
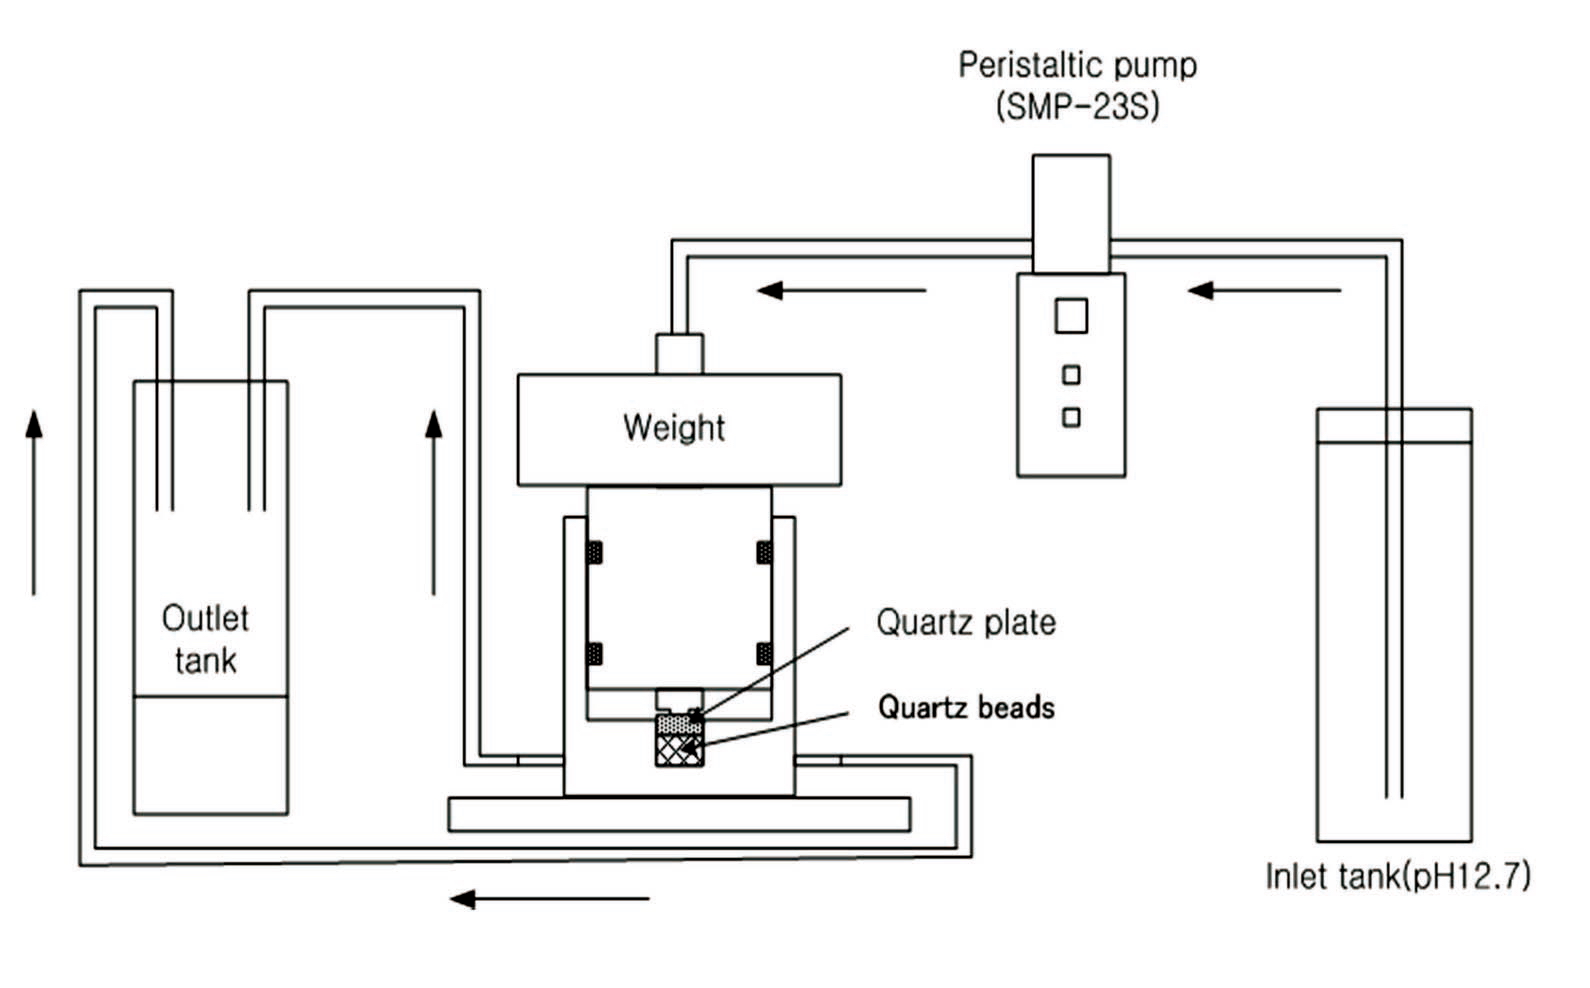
Figures 2 and 3 provide schematic diagrams of the experimental set-up. To replicate the high-alkalinity underground condition, a pH of 12.7 was maintained with
a NaOH solution. As shown in Figs. 2 and 3, approximately 8 ml/h of pH 12.7 solution was supplied to the experimental equipment using a peristaltic pump. To prevent a change in pH resulting from an interaction with carbon in the air during the experiment, the equipment was sealed completely.
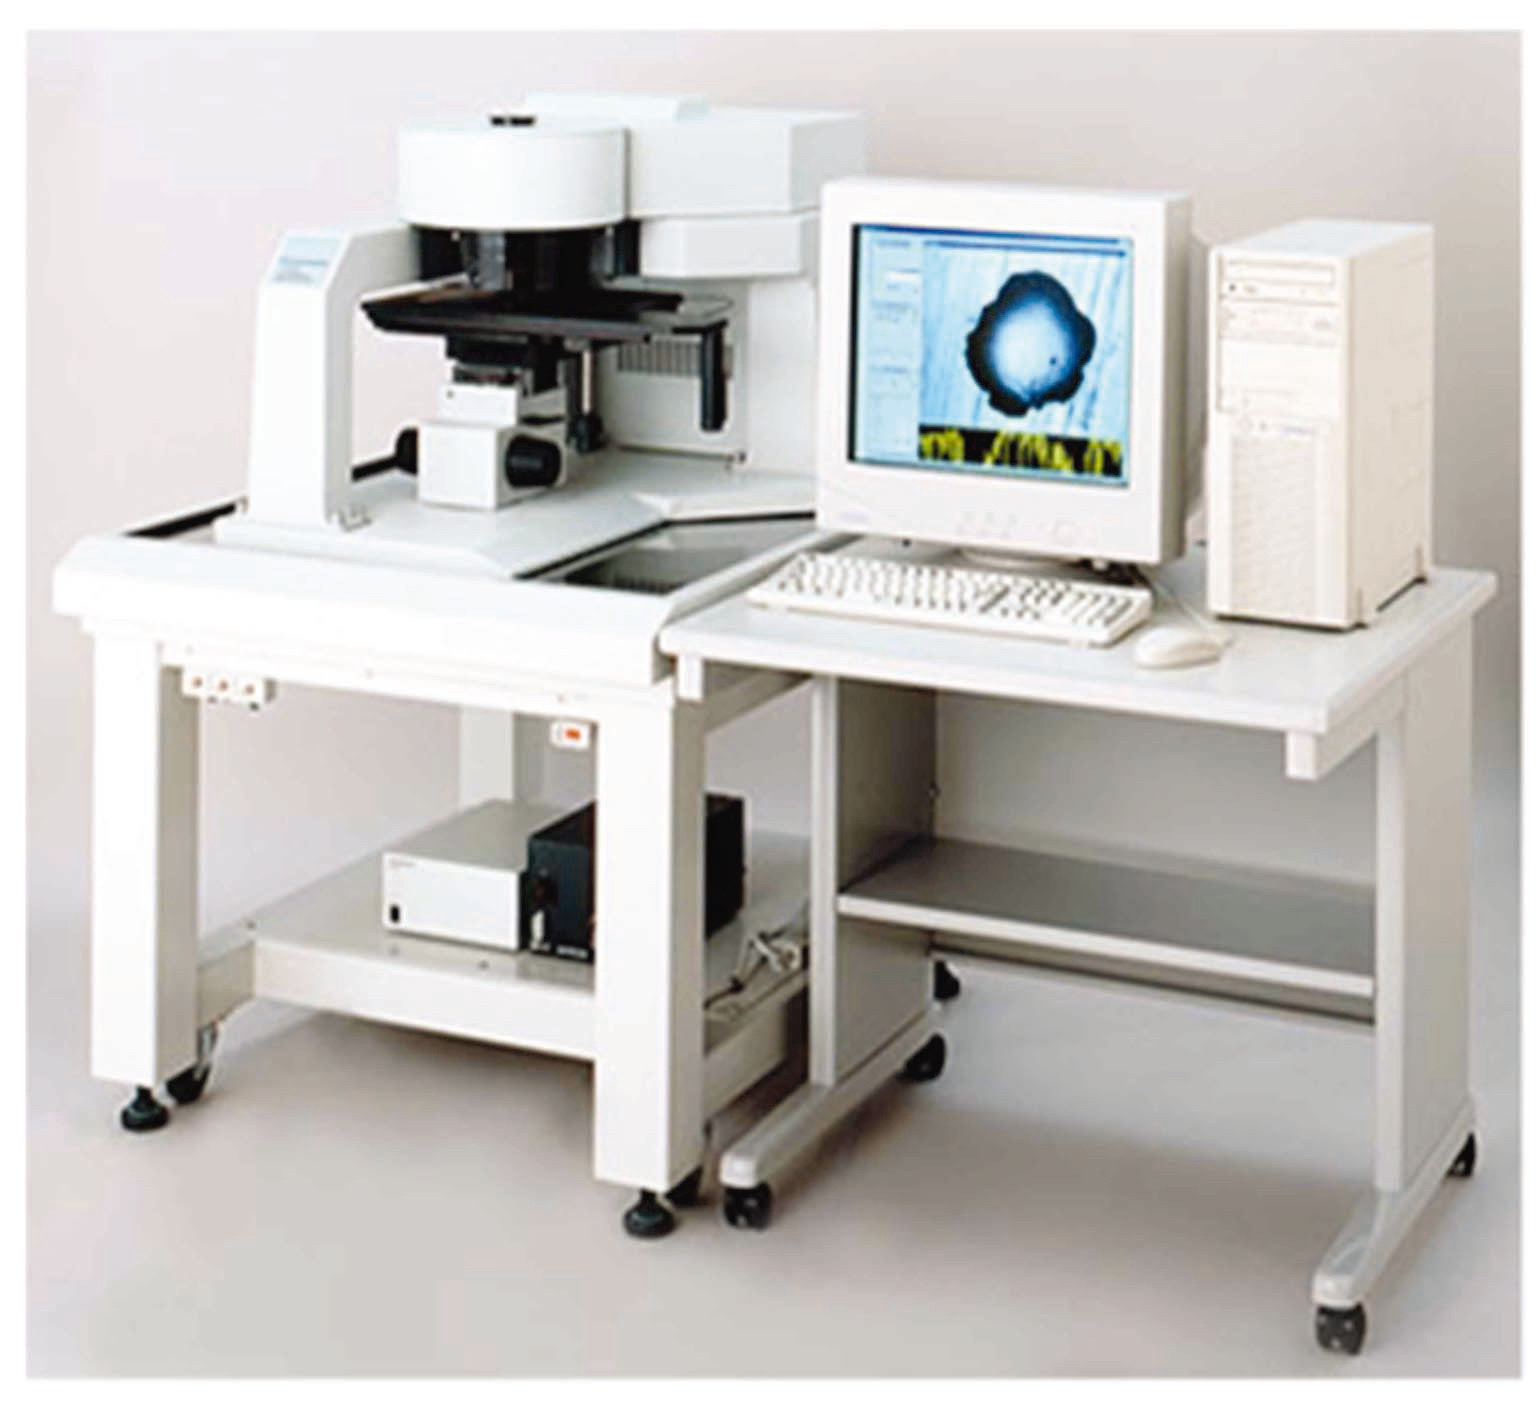
During the experiment, a pressurization load of approximately 0.08 to 0.1 MPa was maintained. The surface of the quartz plate was observed approximately 14 days into the experiment with the CLSM. The CLSM (OLS1100, Olympus) was used for two- and three-dimensional measurement of the sample surface (Fig. 4). The wavelength of the laser was 488 nm. All images were stored as digital data and used to analyze the parts of the surface that had dissolved. Where possible, the volumes and areas of the dissolved parts were calculated.
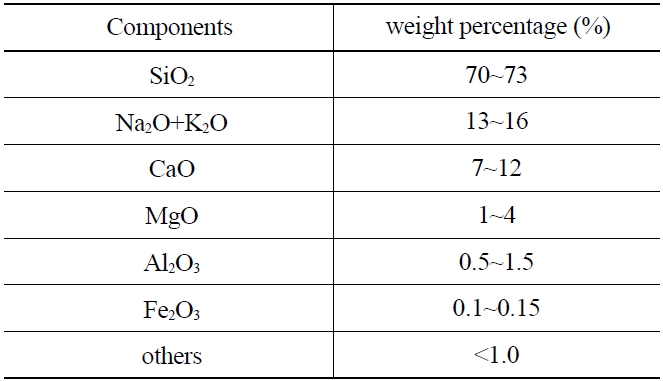
The weight ratio of quartz bead(s) used in this study is shown in Table 1. Approximately 70-73 weight percent (wt%) of the material was SiO2.
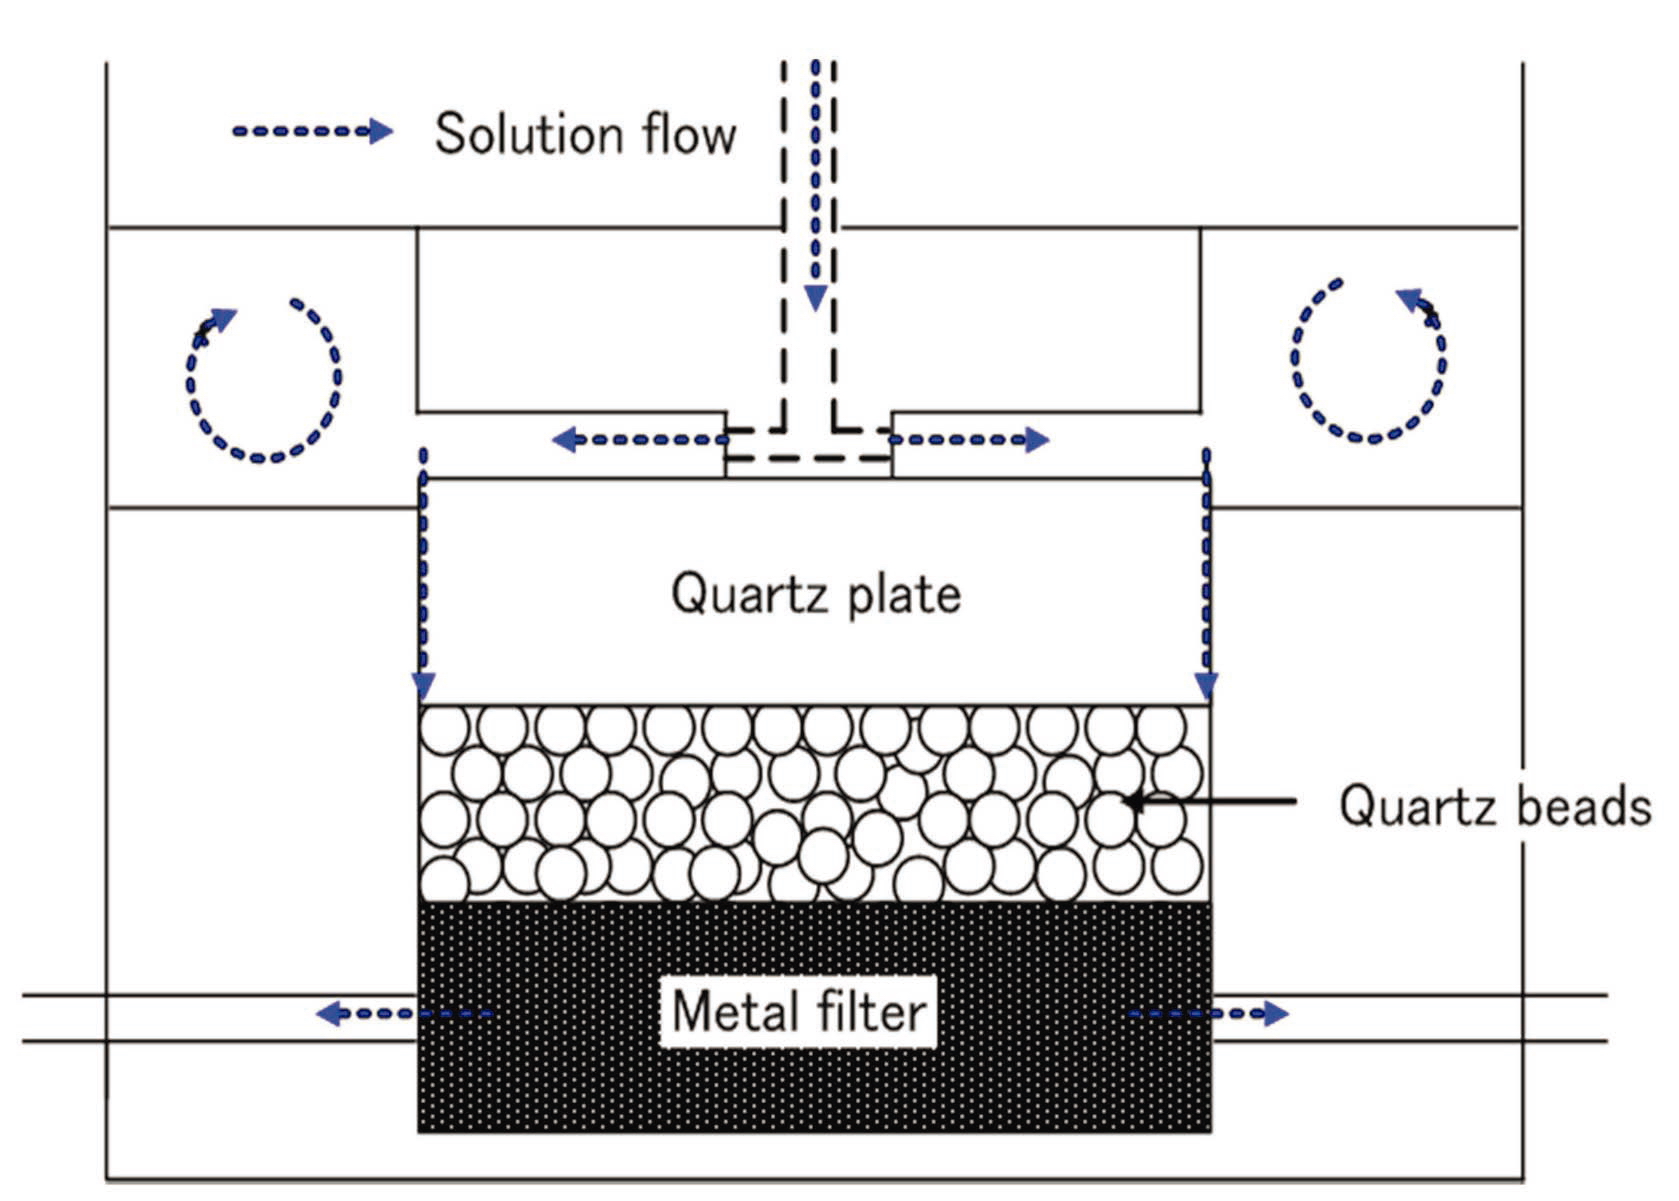
As shown in Fig. 3, quartz beads were placed in the bottom of the sample chamber, and a metal filter was installed, allowing solution to pass to the bottom. A single crystal of quartz was placed above the beads. The CLSM was used following the experiment to analyze the dissolved material between the quartz crystal and the bead.
[Table 1.] Weight Percentage of Components of Quartz Bead

Weight Percentage of Components of Quartz Bead
The overall procedure of the quartz bead dissolution experiment was as follows:
1) The quartz bead and single crystal were washed with distilled water.
2) A metal filter was installed in the experimental equipment, and the quartz bead and single crystal were placed over the filter.
3) A solution of pH 12.7 was injected into the experimental equipment using a peristaltic pump. The injected solution passed through the metal filter and gathered in the tank next to the exit.
4) A dead load of 0.08 to 0.1 MPa was placed on the upper part of the pressure regulator to apply pressure on the experimental equipment.
5) After 14 days, the experiment was completed, and the quartz crystal, bead, and the dissolution of the contact area were observed using the CLSM.
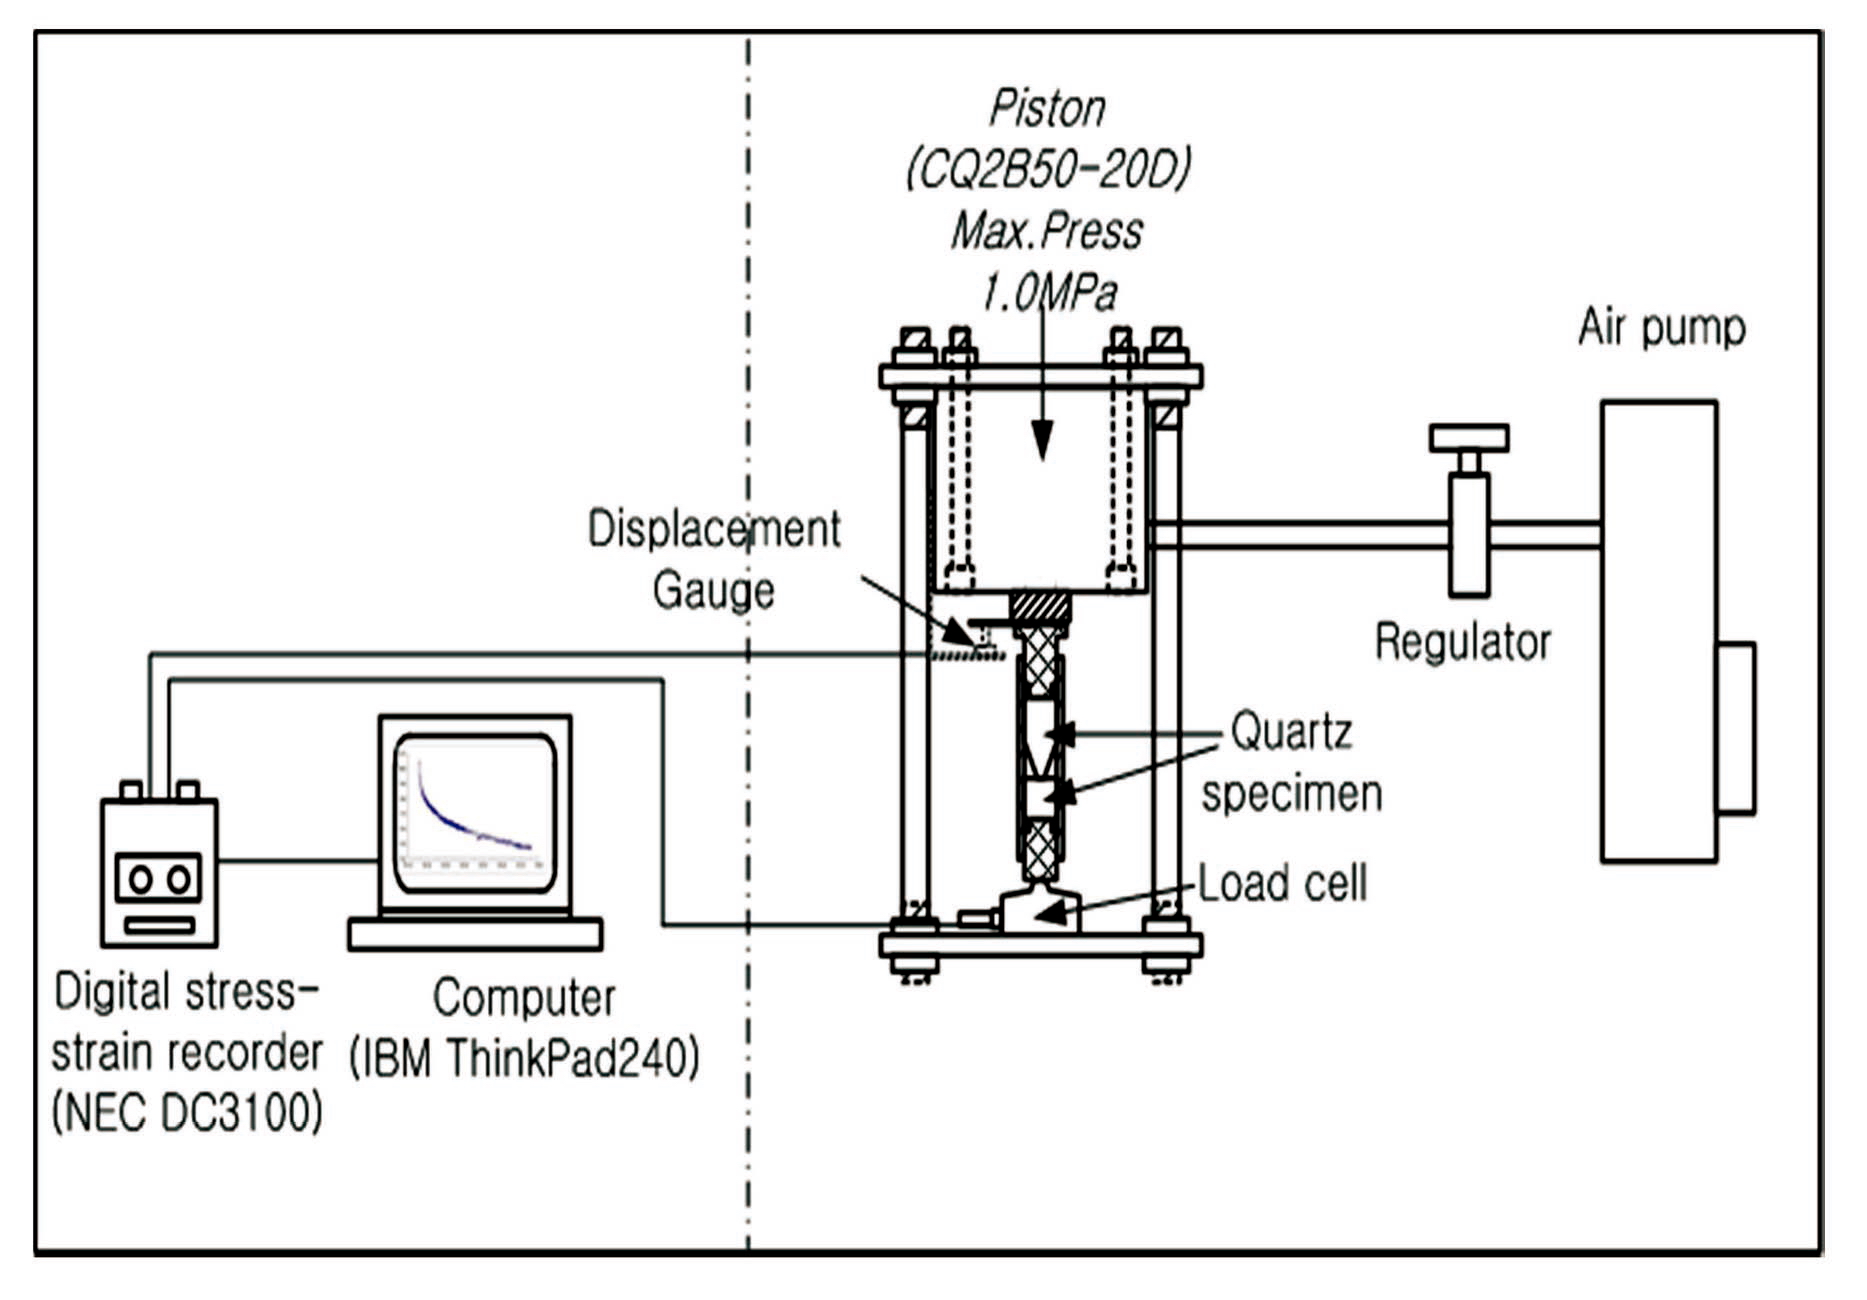
3.2 The Cylindrical Quartz Dissolution Experiment
As shown in Fig. 5, the equipment used for this experiment consisted of two parts: the loading subsystem (right of Fig. 5) and the data acquisition subsystem (left of Fig. 5). The quartz bead dissolution experiment was designed to apply high pressure to the sample, whereas the cylindrical quartz dissolution experiment was designed to maintain pressure using an air pump containing a regulator. This regulator was able to maintain a specific pressure during the experiment by operating an air pump automatically if the pressure was at or below a specific value. This experiment was controlled such that a stress of approximately 200 MPa could be applied to the experimental equipment using a pressure piston. The pH of the solution was adjusted to 12.7 with an NaOH solution. The experiment was run for approximately 14 days. The samples used in this experiment were observed using the CLSM.
As shown in Fig. 6, the single cylindrical quartz sample was 5 mm in height and 10 mm in diameter at the bottom and 20 mm in height and 10 mm in diameter at the top. The contact area near the top was 1 mm to maintain high pressure, despite a low external pressure, allowing easier observation of the quartz dissolution that occurred at the contact area.
4.1 The Quartz Bead Dissolution Experiment
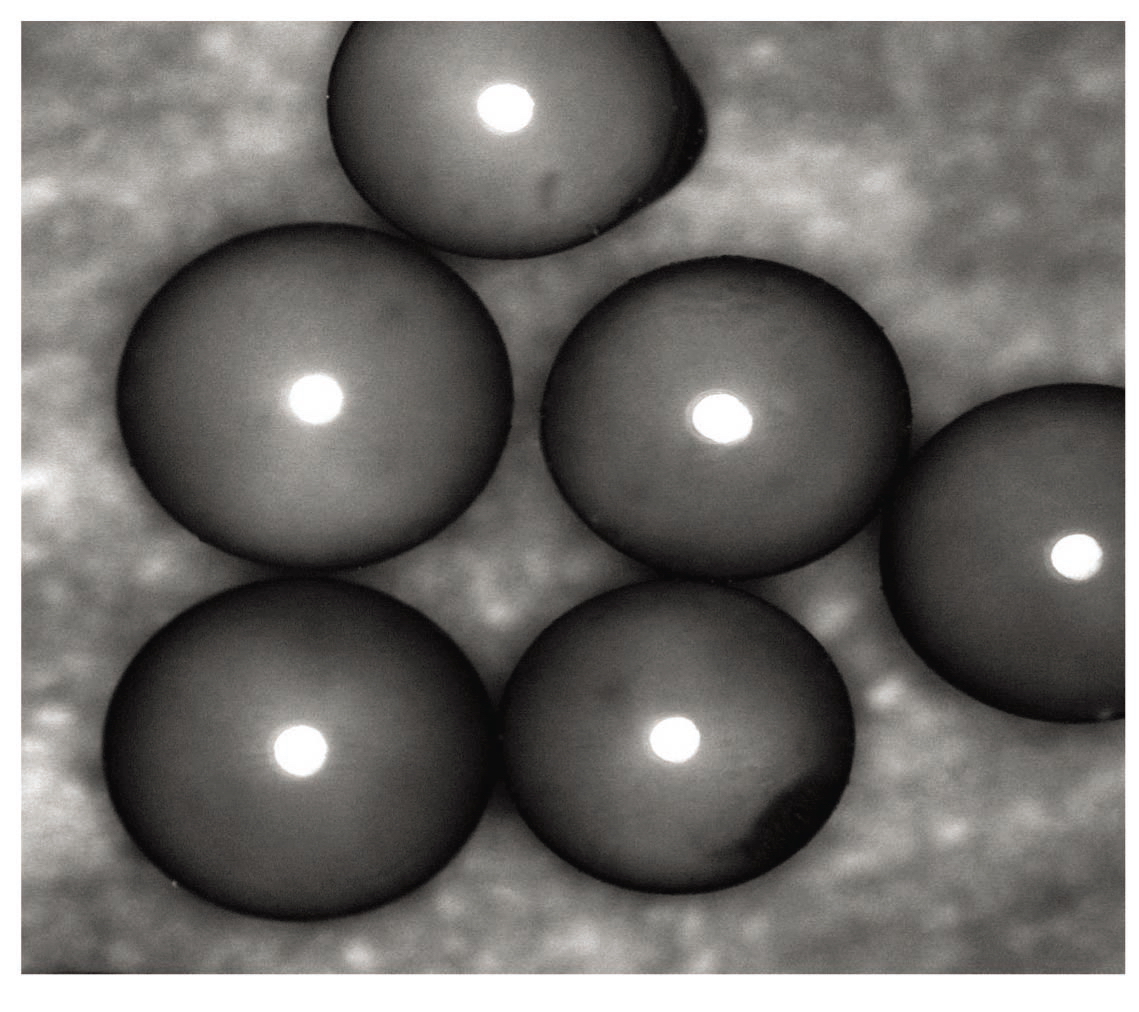
After the experiment, the surface conditions of the quartz bead sample and the single crystal sample were observed using a CLSM. As mentioned above, a CLSM can be used to observe micro-scale deformation. A CLSM was used here to analyze the finely dissolved surface on the contact area of the minerals. Figure 7 shows a twodimensional image of the quartz bead sample used in this
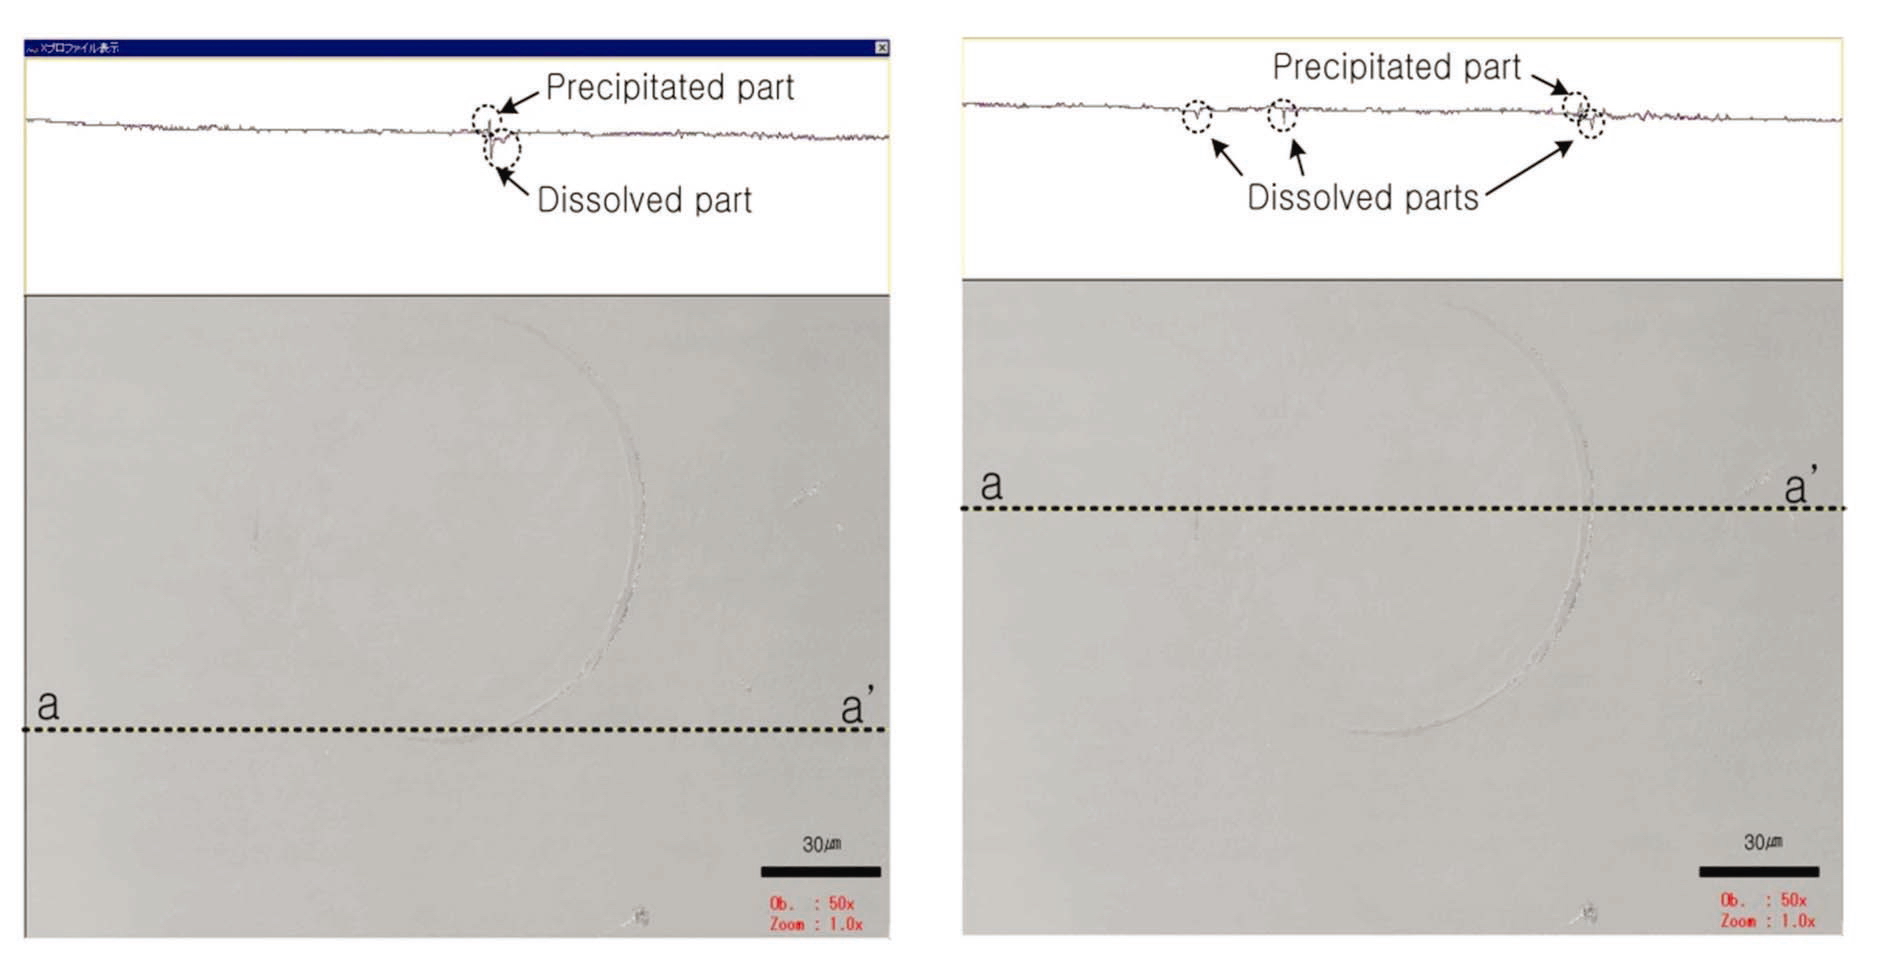
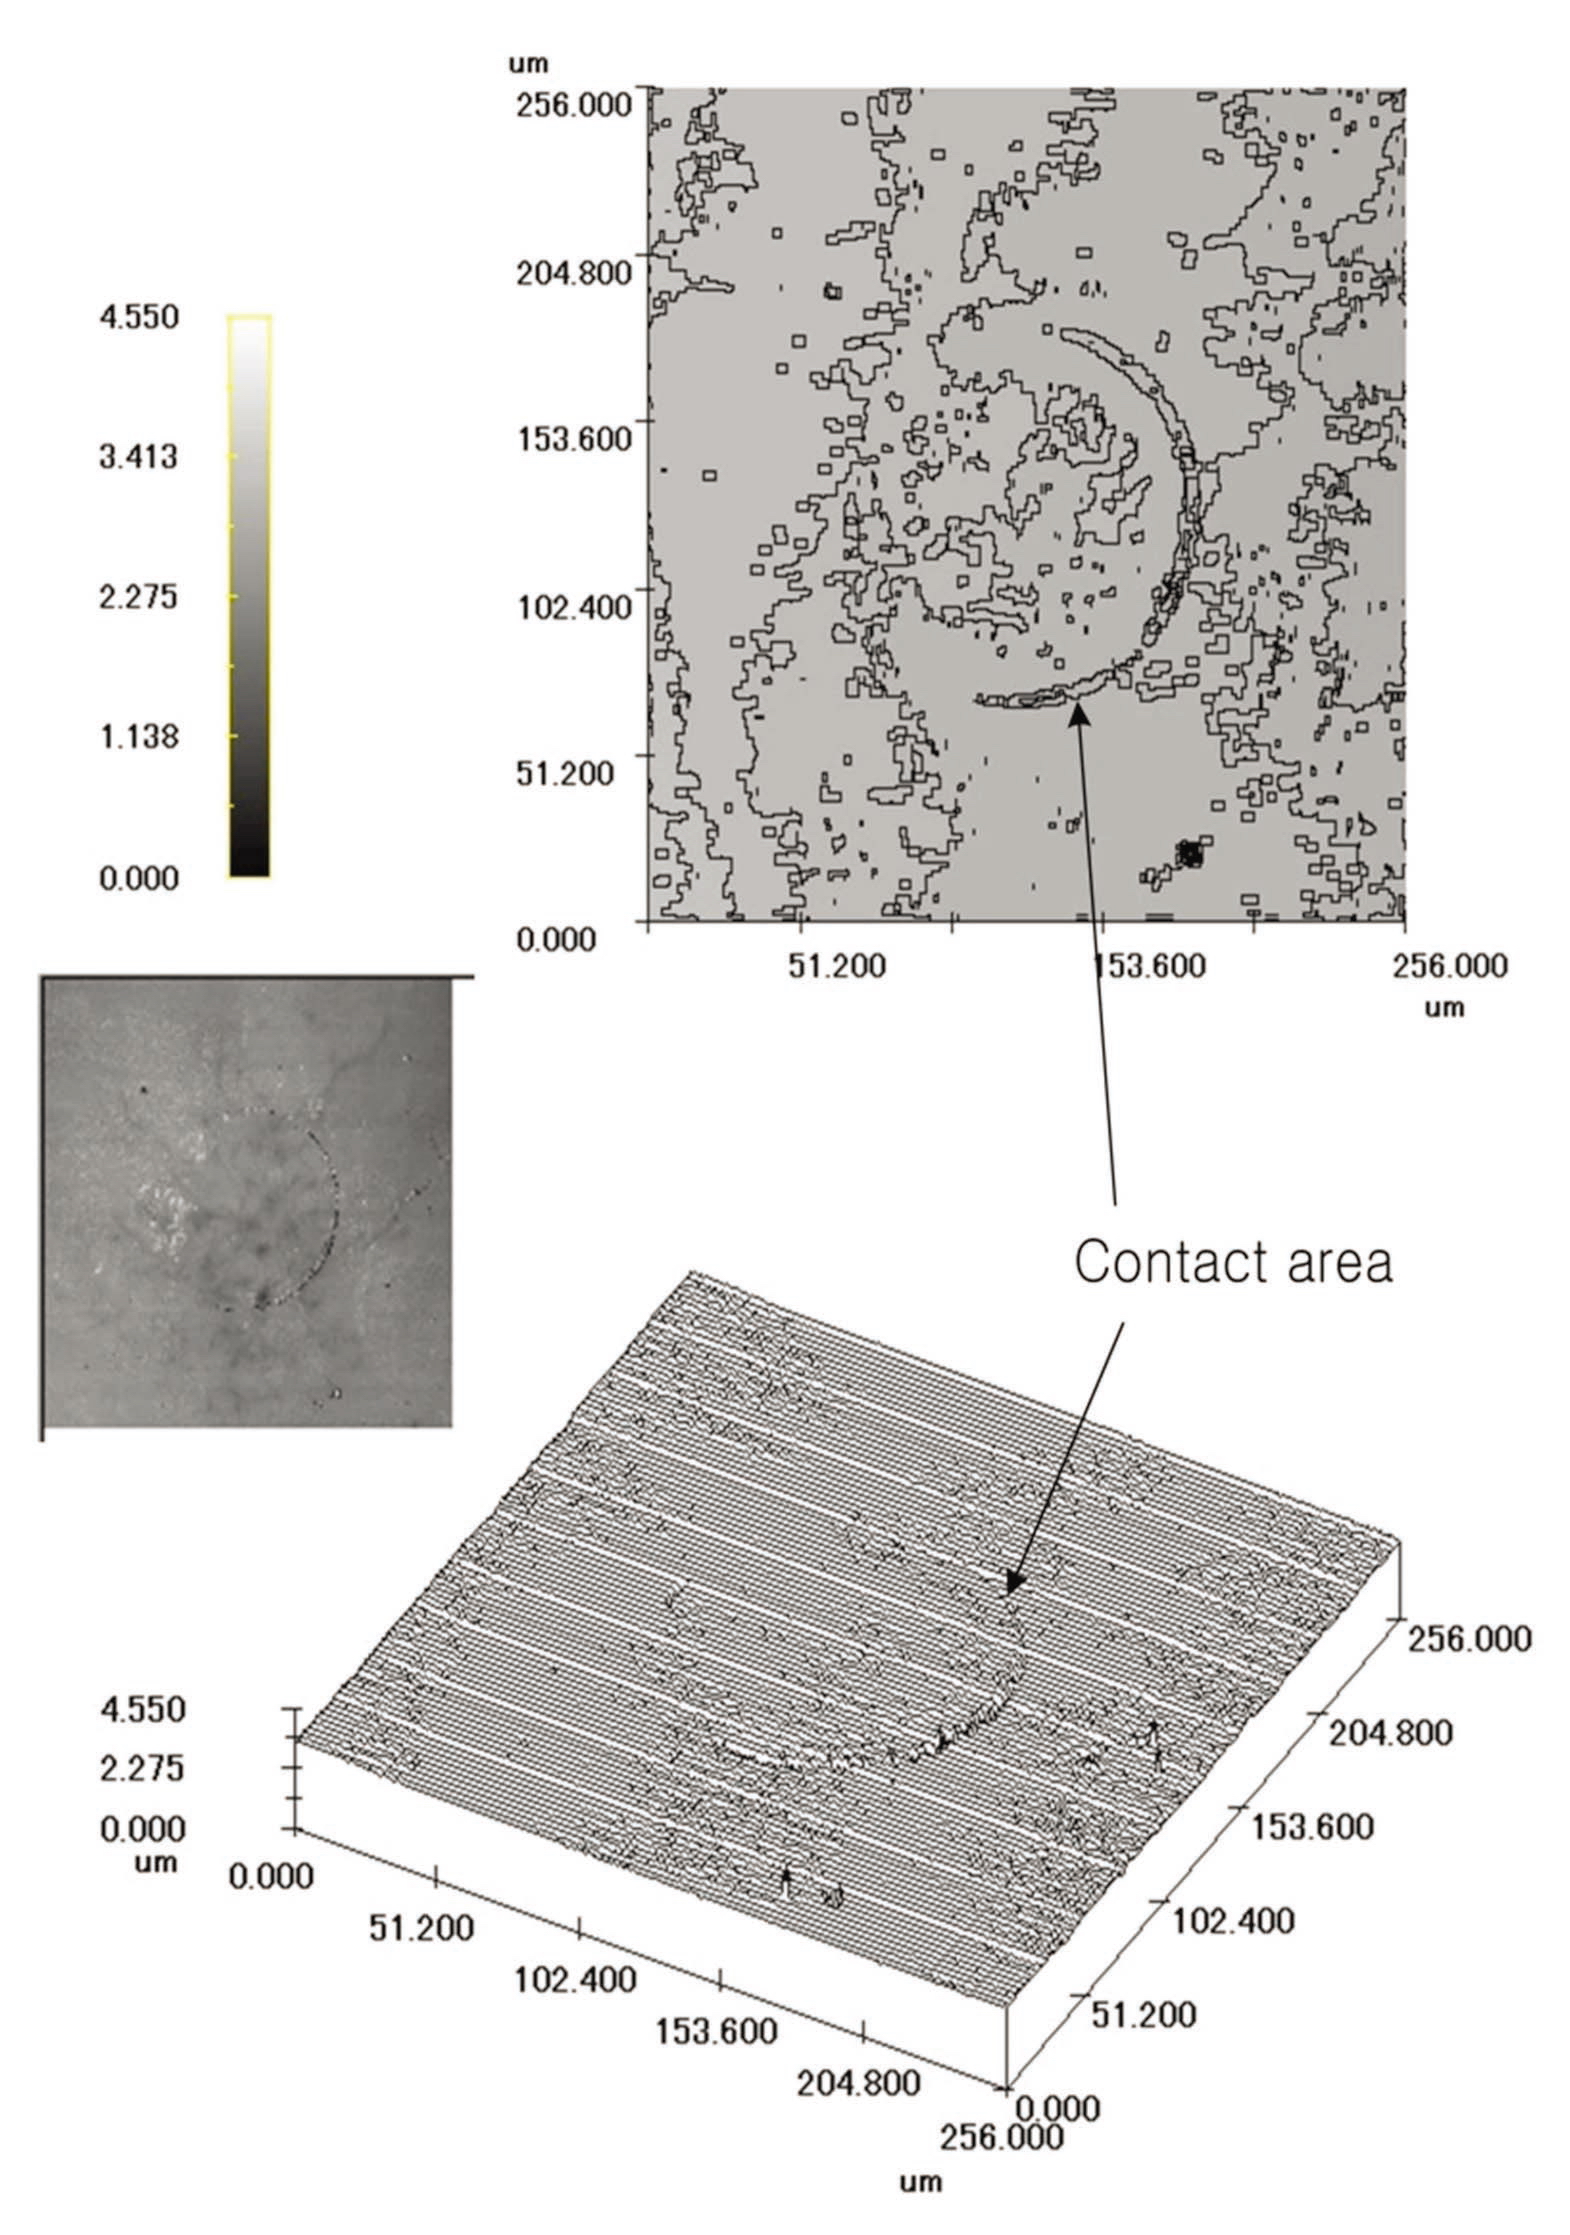
study. It was difficult to find the contact area by rotating the quartz bead sample used in this experiment. As a result, it is quite difficult to observe the surficial dissolution of the bead sample. Therefore, the single quartz crystal was used to observe the dissolution that occurred at the contact between the quartz bead and the single crystal. Figure 8 shows a CLSM photograph of the surface area of the single crystal sample. The dissolution of the quartz can be clearly observed in the surface of the single crystal.
The dissolution of the contact area (boundary zone) can be clearly observed. Based on the 30-㎛ scale bar in Fig. 8, the contact area is approximately 7,853 ㎛2, and the diameter is approximately 100 ㎛. The small rectangle in the upper part of the figure indicates the cross-section ofct area, and the dissolved area extends several ㎛ in depth.
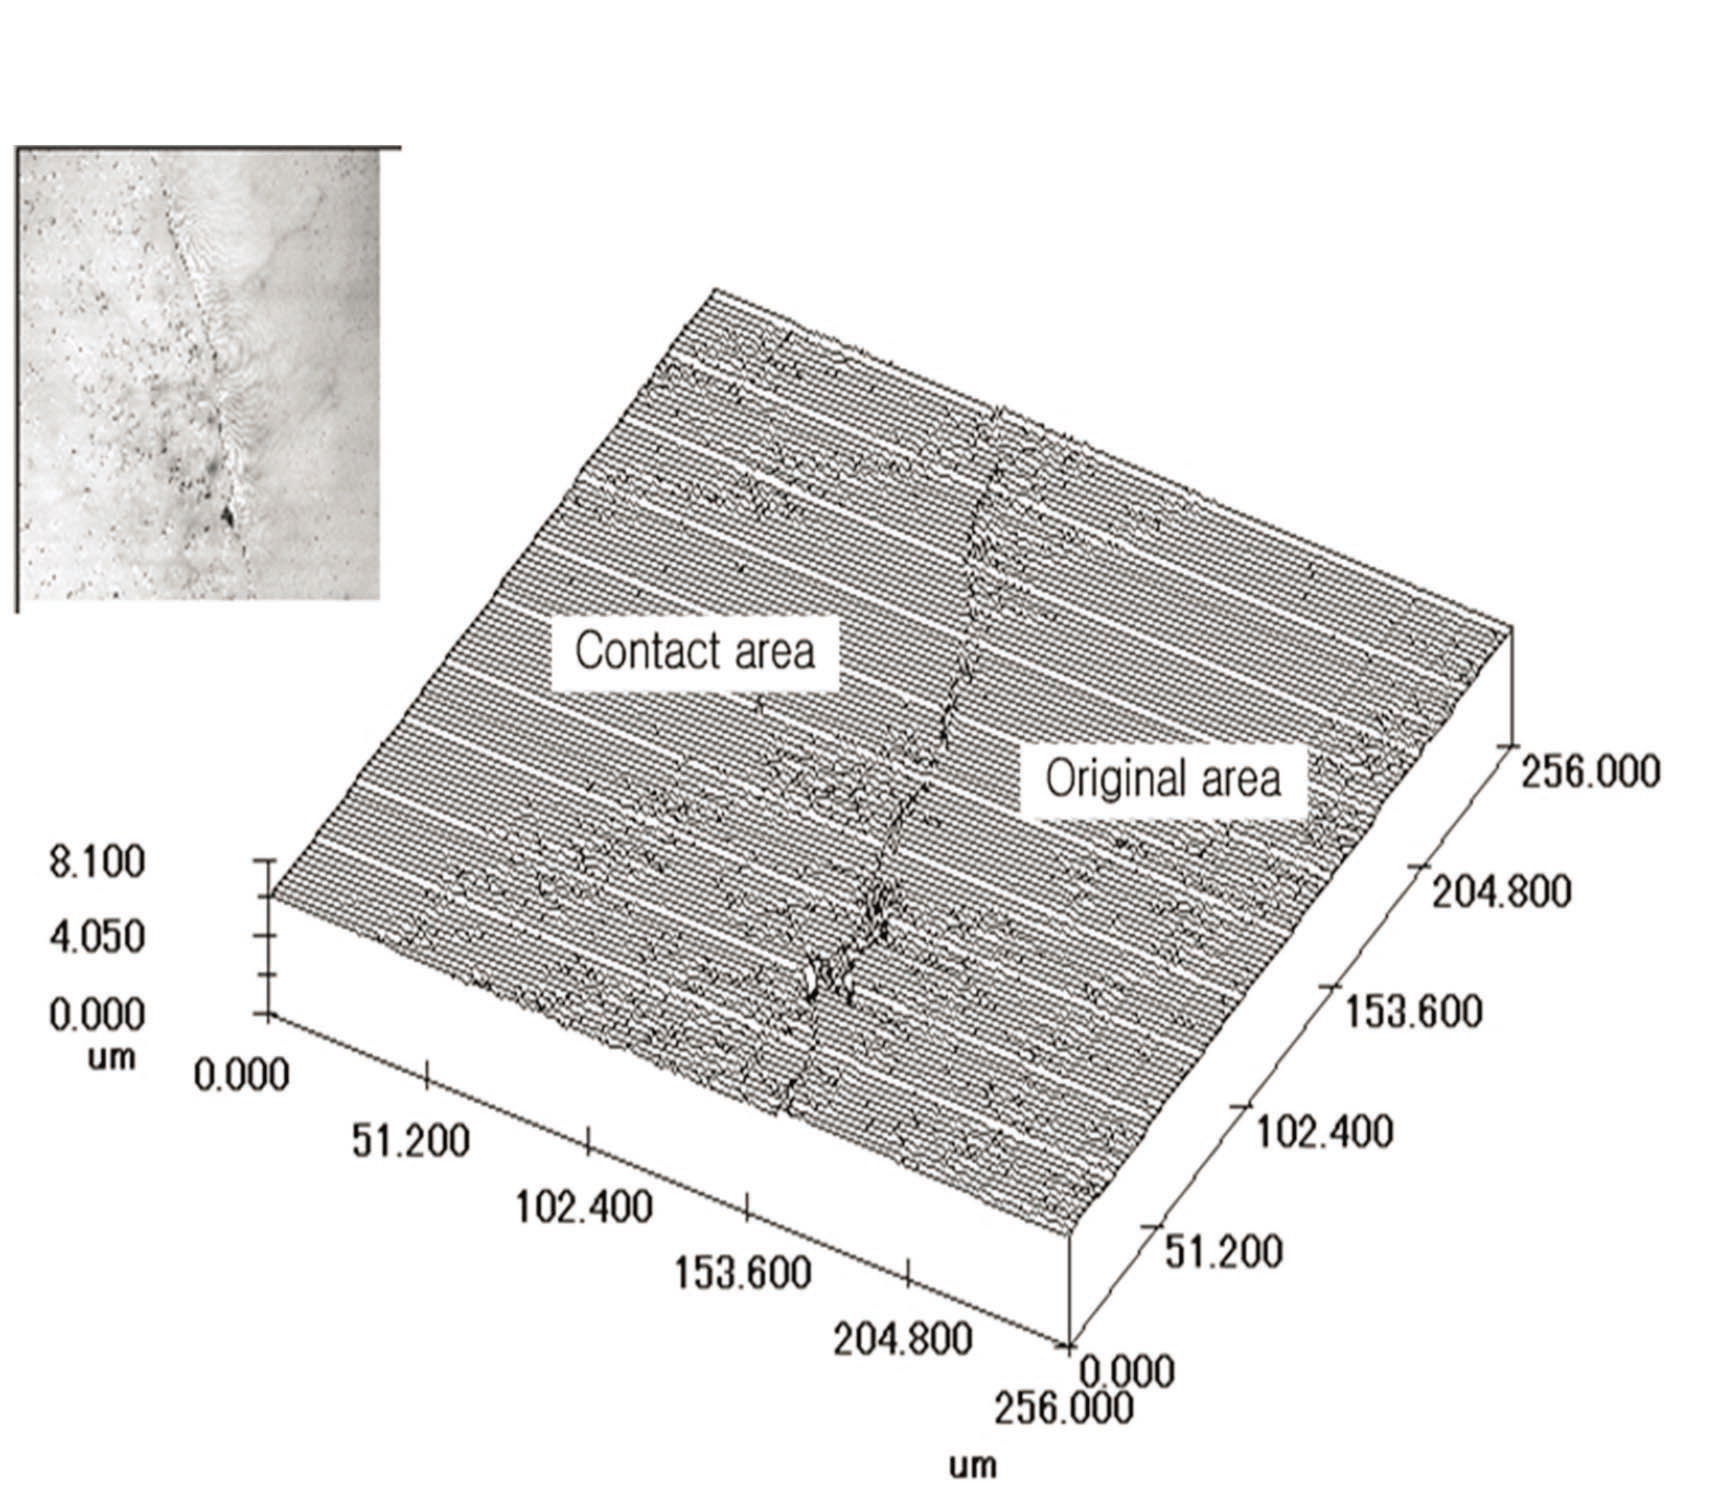
The dissolution of the contact area was analyzed based on this cross-section. Mineral dissolution is clearly shown along the boundary of the contact area. The upper portion shows a change in height between the valley and the neighboring protrusion formed by mineral dissolution near the dissolved surface. The dissolved material is believed to have been transported by diffusion or advection, and it precipitated in the area of least stress. Thus, dissolution occurred at the contact with the mineral, and the material moved via diffusion and advection. This behavior also accounts for the precipitation of material being moved to the area of least stress. Two- and three-dimensional images of the surface were created with digital data of the contact area obtained from the CLSM, as shown in Fig. 9. The dissolution feature at the contact area can be easily observed in these images.
Considering that the bead dissolution experiment was performed under low-stress and high-alkalinity conditions, quartz exhibited notably stable characteristics when no pressure was added, but the surface became unstable and was easily dissolved upon the application of a small stress and an increase in pH. Thus, it is helpful to analyze the physiochemical interaction of rocks that contain large
amounts of quartz, which frequently occurs around engineered facilities built on the earth’s surface or deep underground. Because quartz dissolution caused by changes in pH can be observed at low pressures and at room temperature, this behavior may be useful in accounting for the interaction of quartz by rainfall or subsurface water.
4.2 The Cylindrical Quartz Dissolution Experiment
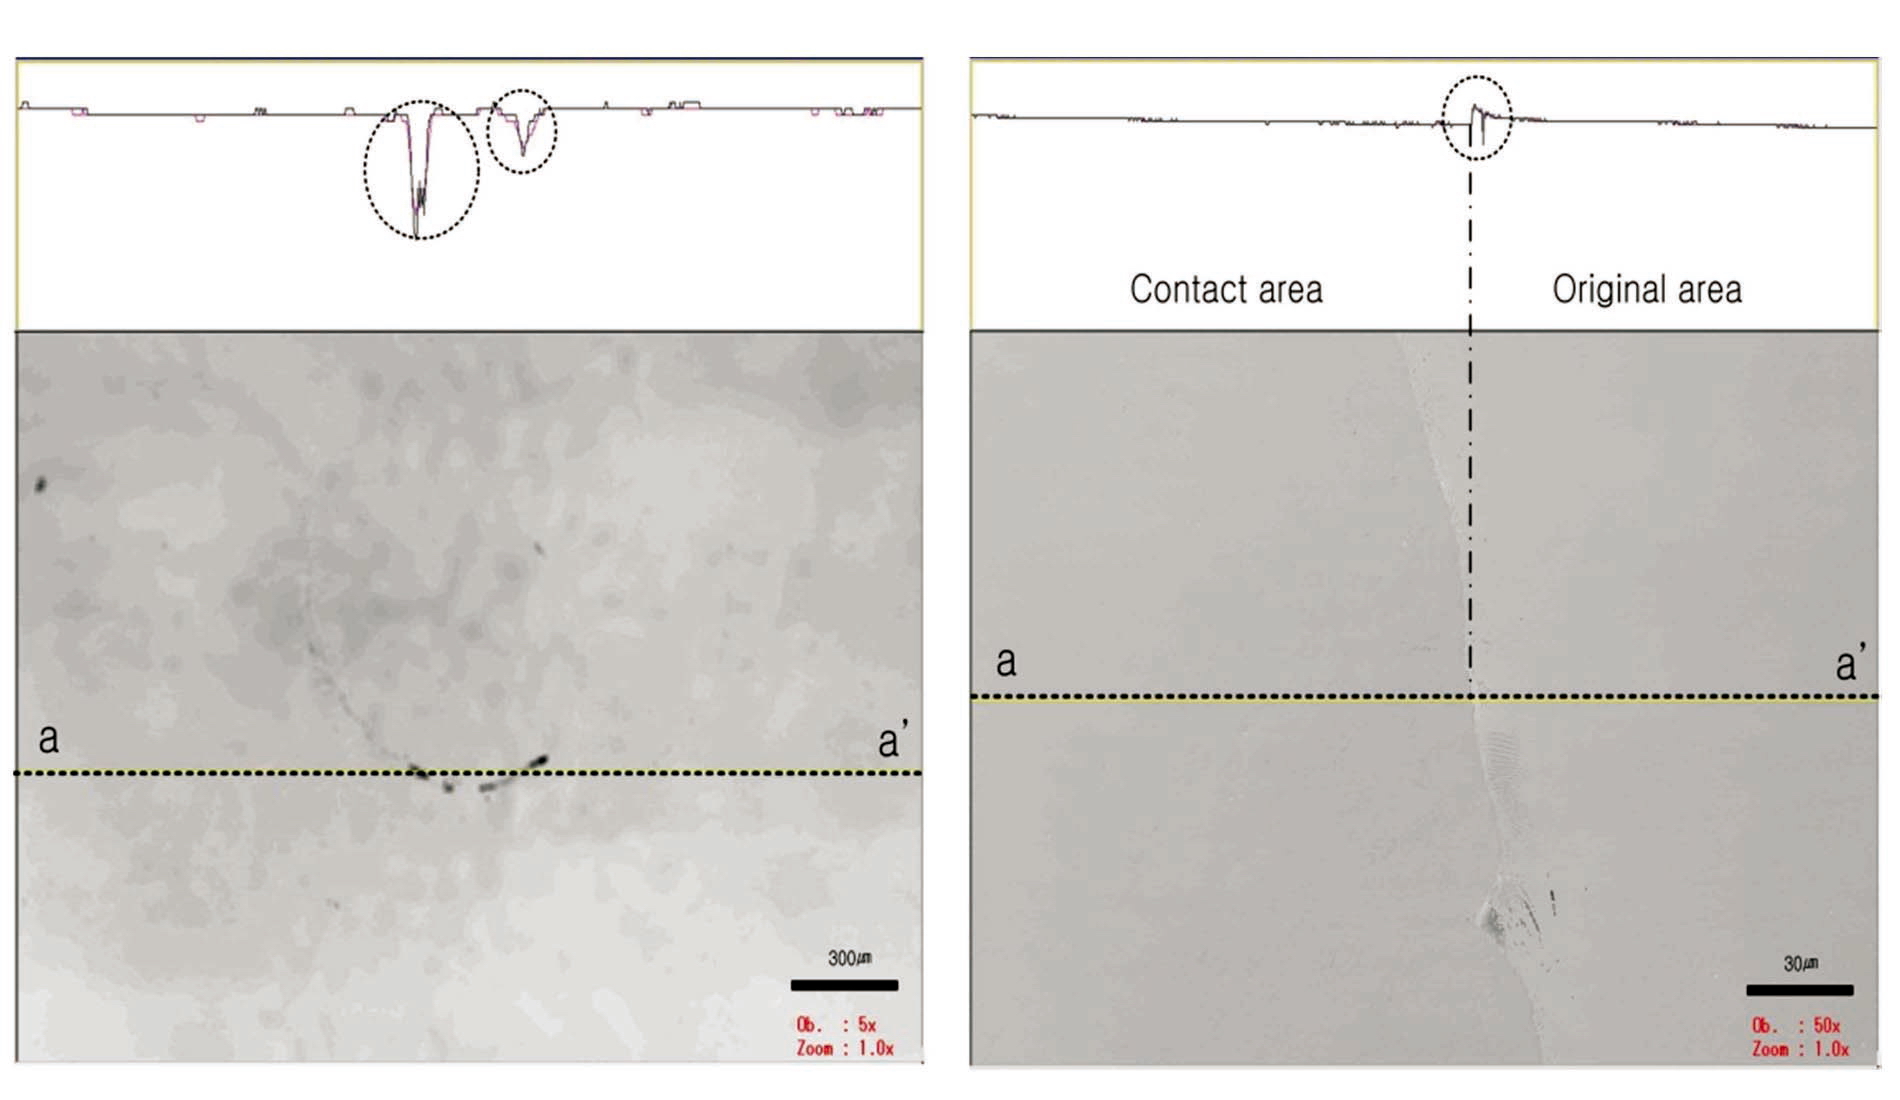
In this study, the single quartz crystal maintained the (001) plane as the contact area for experimental consistency and the stress applied to the contact area was high over a very small area (1 mm in diameter). The stress applied to the contact area was approximately 200 MPa. As in the bead experiment, a CLSM was used to observe the contact area of the sample following the experiment. Figure 10 shows the dissolved surface.
As shown in Fig. 10, the dissolution feature on the contact area is notably similar to that of the bead dissolution experiment. In particular, the left of Fig. 10 indicates that the depth of the dissolved surface of the mineral reaches almost hundreds of ㎛ in the experiment under high-pressure conditions. Among the dissolution models proposed by others, the dissolved surface shown in this study was very similar to that of the island-channel model. In this model, the solution follows an existing micro-scale flaw or crack on the surface of quartz, thereby accelerating dissolution. The applied high pressure condenses at the front of the fine crack, and the crack rapidly expands.
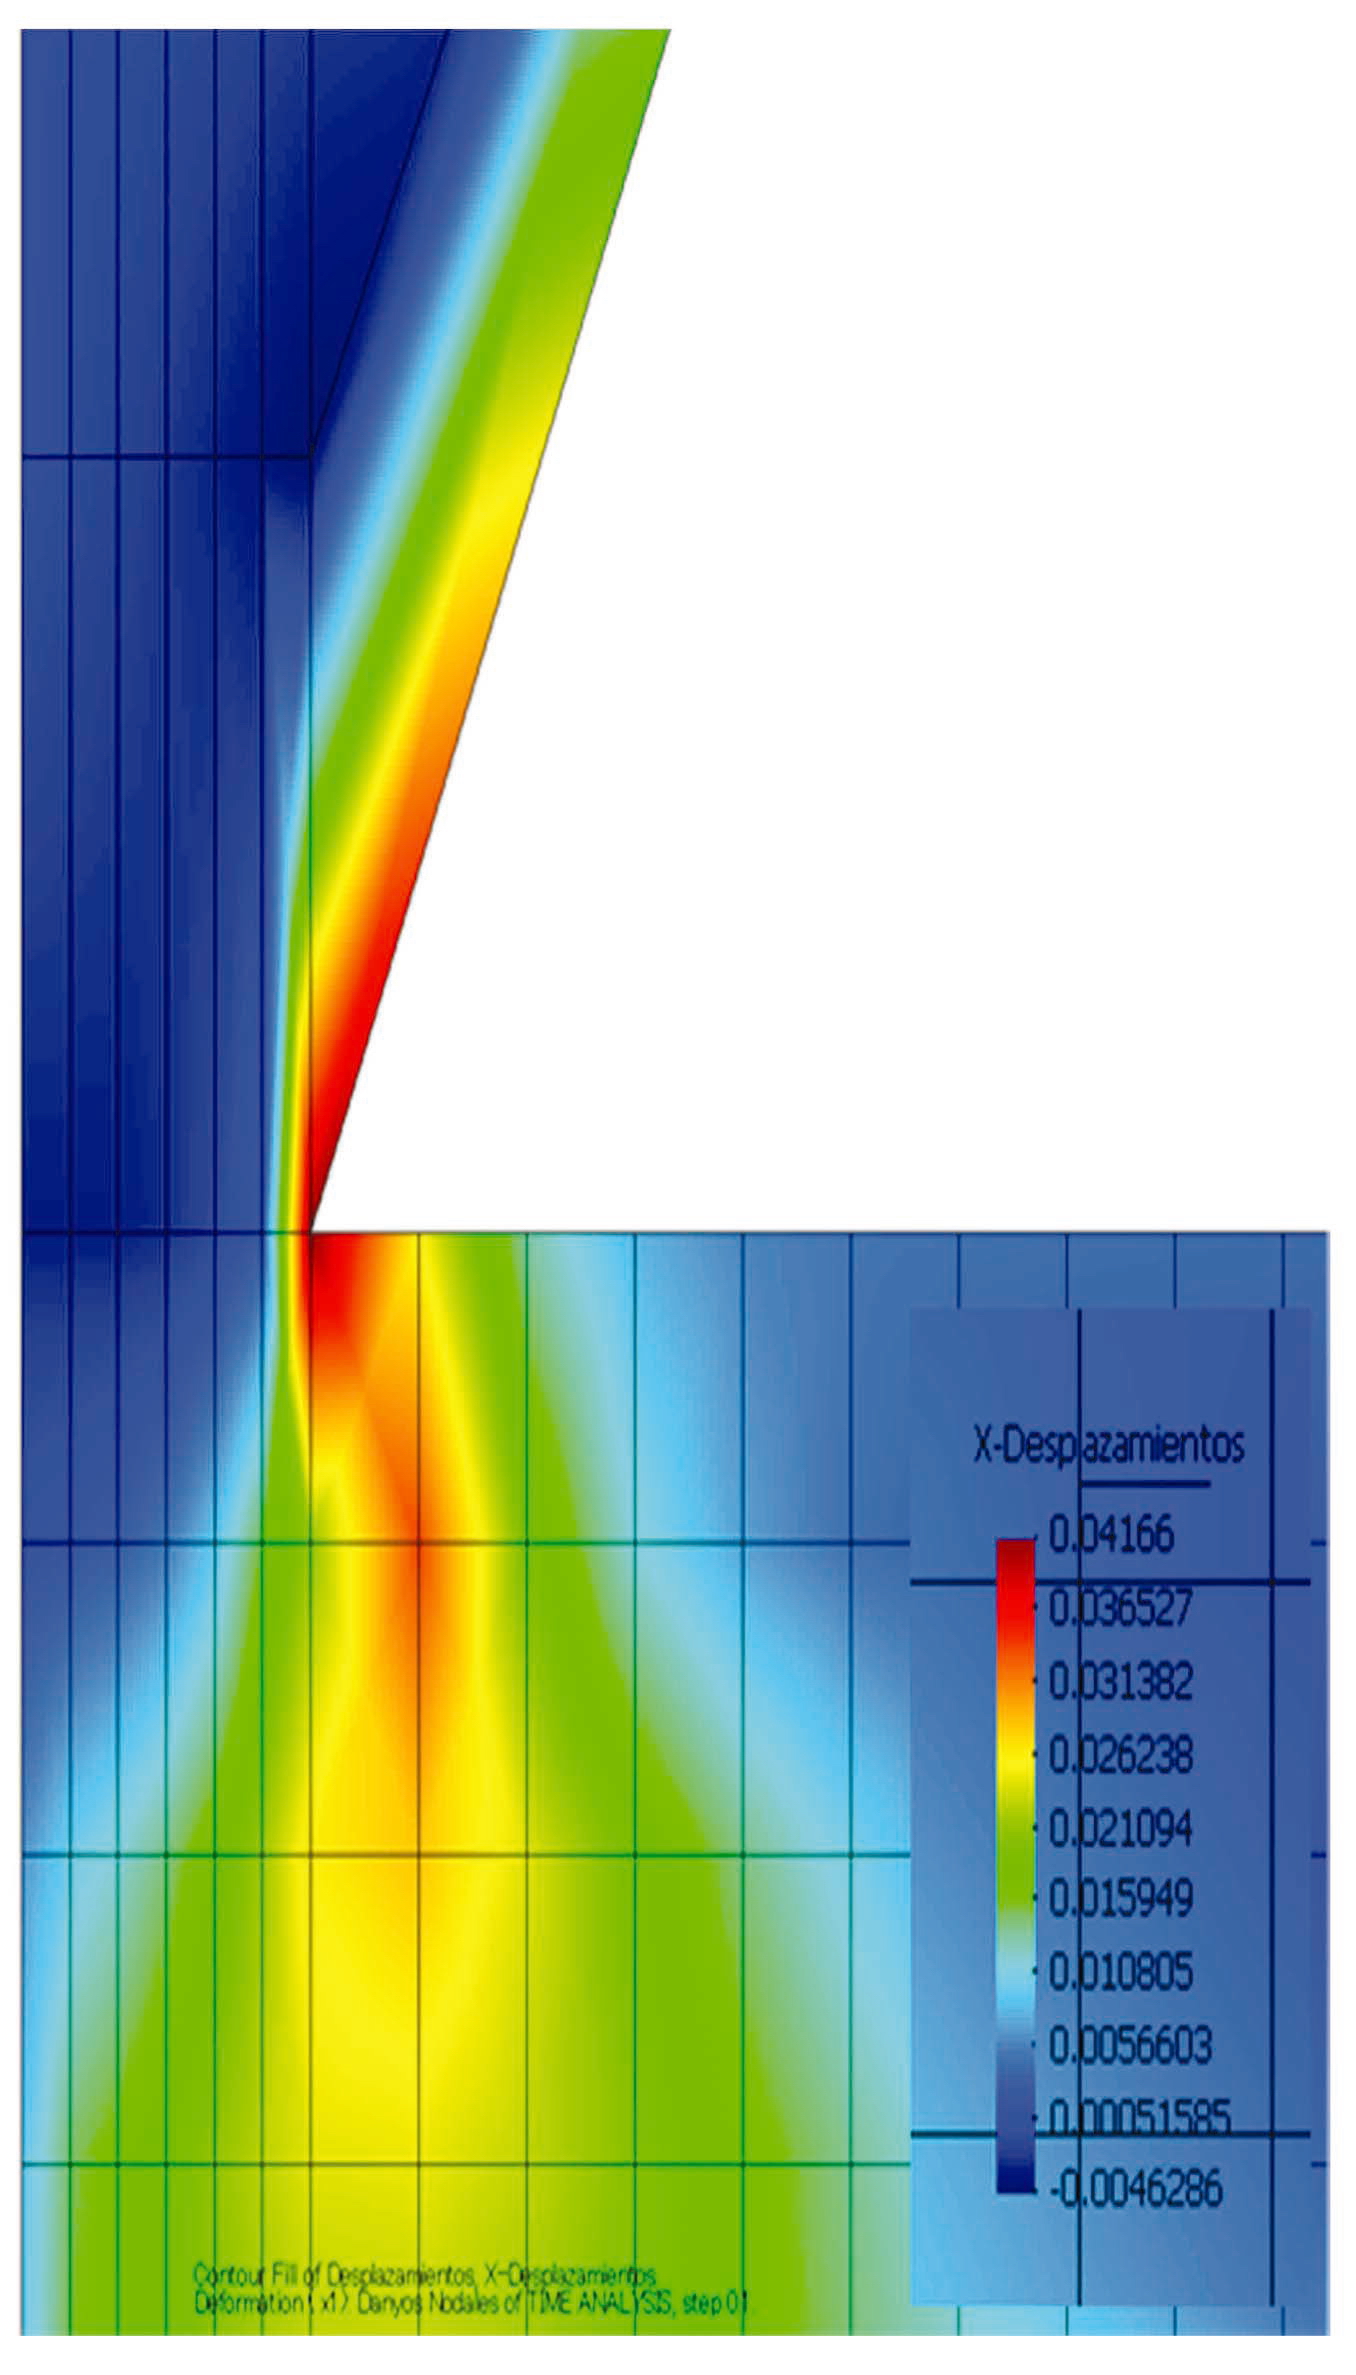
In this study, precipitation was also observed on the contact area. Figure 11 shows a three dimensional image of the expanded contact area, which indicates that there was a marked difference in dissolution between the contact and the non-contact areas based on the boundary area. The sharp difference between the two sides is thought to be caused by the intensification of stress due to high stress applied in this experiment. The concentration of stress might affect the deformation of the single crystal itself, rather than other areas. This stress concentration might accelerate the extension of an existing fine crack. In this study, numerical analysis using a finite element method (FEM) was performed to identify the stress concentration and deformation of the contact area under high stress.
The basic equation of the FEM that solves the axisymmetric problem is expressed as

Hookes’ law (
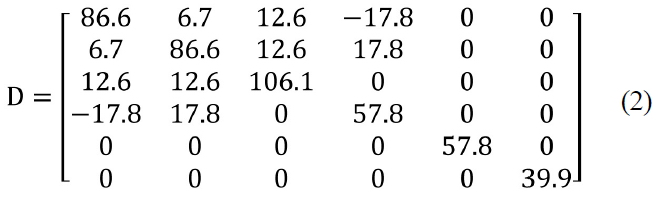
In the case of isotropic material, Seo (1999) suggested an experimental value for D:
The weak form of the axi-symmetric problem is expressed by equation 3, which is used to model the distribution of deformation at the contact area of the crystal:
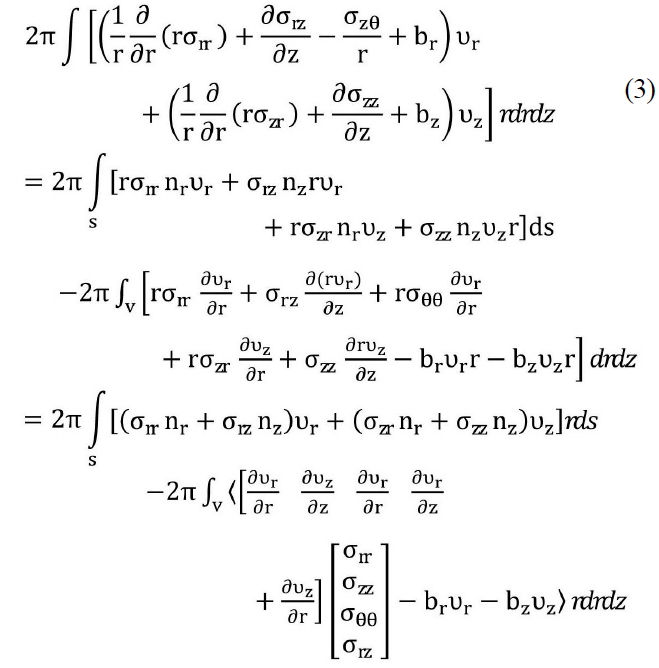
In this equation, r, z, and θ are elements of the coordinate system. The first term of the right-hand side of equation (3) is expressed as equation (4):
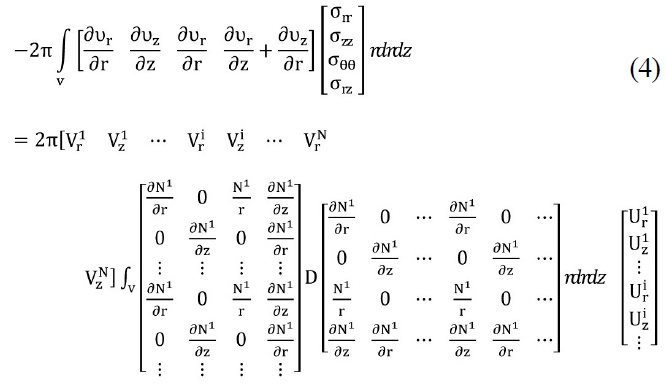
In this equation, the term 2π∫ <?>
The FEM analysis performed using the above equations are shown in Fig. 12. The result shows that displacement occurred by compression in the contact area, which was greatly affected, along with the contact area. As a result, the displacement in the contact area identified using the CLSM is considered to be compression displacement via compressive stress. This process accelerates dissolution, as well as the deformation of a single crystal of quartz.
This study aims to analyze the behavior of bentonite or neighboring crystalline rocks over long periods because these materials are used as buffer materials in high-level radioactive waste-disposal facilities. We analyzed the behavior of quartz dissolution under high-alkalinity conditions and under pressure because quartz is the largest component of bentonite and crystalline rocks. The results of this study suggest that quartz is generally very safe under normal conditions but becomes unstable in a high-pressure and high-alkalinity environment. The dissolution of quartz beads occurred under low pressure, indicating that quartz is notably unstable at room temperature under high-alkalinity conditions. According to the surface of the quartz observed using the CLSM, dissolution and precipitation occurred simultaneously at the contact area, showing a clear difference from the behavior of the non-contact area. In the dissolution experiment using a cylindrical quartz sample, dissolution occurred at high pressure, room temperature, and at a specific pH. As a result, the contact area showed a high dissolution rate compared to the non-contact area. As shown by numerical analysis, a high compressive stress field acted upon the neighboring contact area, which showed a rapid dissolution rate compared to other areas of the sample.
As shown in this study, rocks at deep subsurface facilities are exposed to a weathering environment under reducing conditions, due to the high-alkalinity environment produced by the cement used during construction. The crystal structure of quartz, a large component of the rock, becomes highly unstable under stress and high-alkalinity conditions. The large amount of subsurface water transports alkaline ions and actively causes the dissolution of minerals.