For the quantitative detection of algal toxin, microcystin, a chemiluminescence immunochromatographic assay method was developed. The developed system consists of four parts, chemiluminescence assay strip (nitrocellulose membrane), horse radish peroxidase labeled microcystin monoclonal antibodies, chemiluminescence substrate (luminol and hydrogen peroxide), and luminometer. The performance of the chemiluminescence immunochromatographic assay system was compared with high performance liquid chromatography (HPLC) detection. The detection limit of chemiluminescence immunochromatographic assay system is several orders of magnitude lower than with HPLC. The chemiluminescence immunochromatography and HPLC results correlated very well with the correlation coefficient (r2) of 0.979.
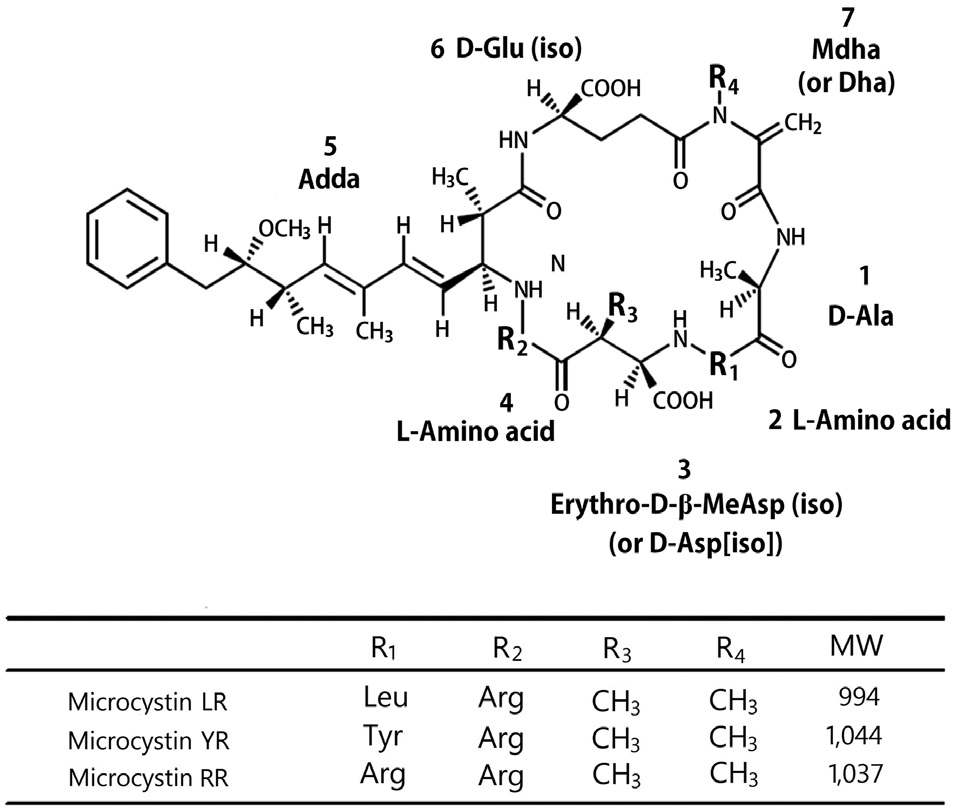
Currently, algal bloom is occurring more frequently than during the past year because of an effect of global warming and intense eutrophication of fresh water. Among the algal toxins, microcystin is well known as a hepatotoxin, and it can threaten the liver in fish, birds, and mammals. Their basic structure is a cyclic peptide and their structural variations give rise to more than 80 types of microcystins known today (Jochimsen et al. 1998). The most extensively studied form is microcystin- LR that contains L-leucine and L-arginine in the two main variant positions (Fig. 1) (Campbell et al. 1994, McElhiney and Lawton 2005). Microcystin is a rapid disorganization of the hepatic architecture, leading to massive intrahepatic hemorrhage, often followed by death of the animals by hypovolemic shock or hepatic insufficiency (Falconer et al. 1981, Eriksson et al. 1990). Especially, microcystin LR was known for “fast death factor” (Azevedo et al. 2002). Moreover, the provisional guideline of drinking water was determined at levels below 1 μg L-1 of microcystin LR by the World Health Organization (WHO) in 1998.
Since microcystins are a potent hepatotoxin in humans and animals, the development of sensitive and reliable detection methods becomes of great importance. Efforts have been aimed at developing more sensitive screening methods to replace the nonspecific mouse bioassay, traditionally used for the identification of toxic strains of
Thus far, several physicochemical techniques such as high performance liquid chromatography (HPLC) (Lawton et al. 1994, Meriluoto 1997, Spoof et al. 2001, Pyo and Moon 2005), tandem mass spectrometry (LC/MS/ MS) (Mayumi et al. 2006, Pyo and Yoo 2007), and matrixassisted laser desorption/ionisation-time of flight mass spectrometry (MALDI-TOF MS) (Agrawal et al. 2006) have
been used for the detection of algal toxin, and microcystin in water, but this approach relies on the availability of toxin standards for quantitative analysis and is therefore only applicable to known toxins. It is also a relatively slow technique and requires expensive equipment and appropriate training.
To overcome the above problems, many biological methods based on antigen-antibody reaction were developed. Using polyclonal antibodies, the sensitivity limit was first nanogram per milliliter (Chu et al. 1990), and later on it was 17 pg mL-1 (Sheng et al. 2006). The use of monoclonal antibodies that selectively recognized microcystin could enhance the detection limit up to 10 fmol mL-1 (Khreich et al. 2009). Recently, the colorimetric immunochromatographic assay method (Zhang et al. 2011) using gold nanoparticles and the fluorescent strip assay method (Khreich et al. 2010) using a monoclonal antibody of microcystin were developed.
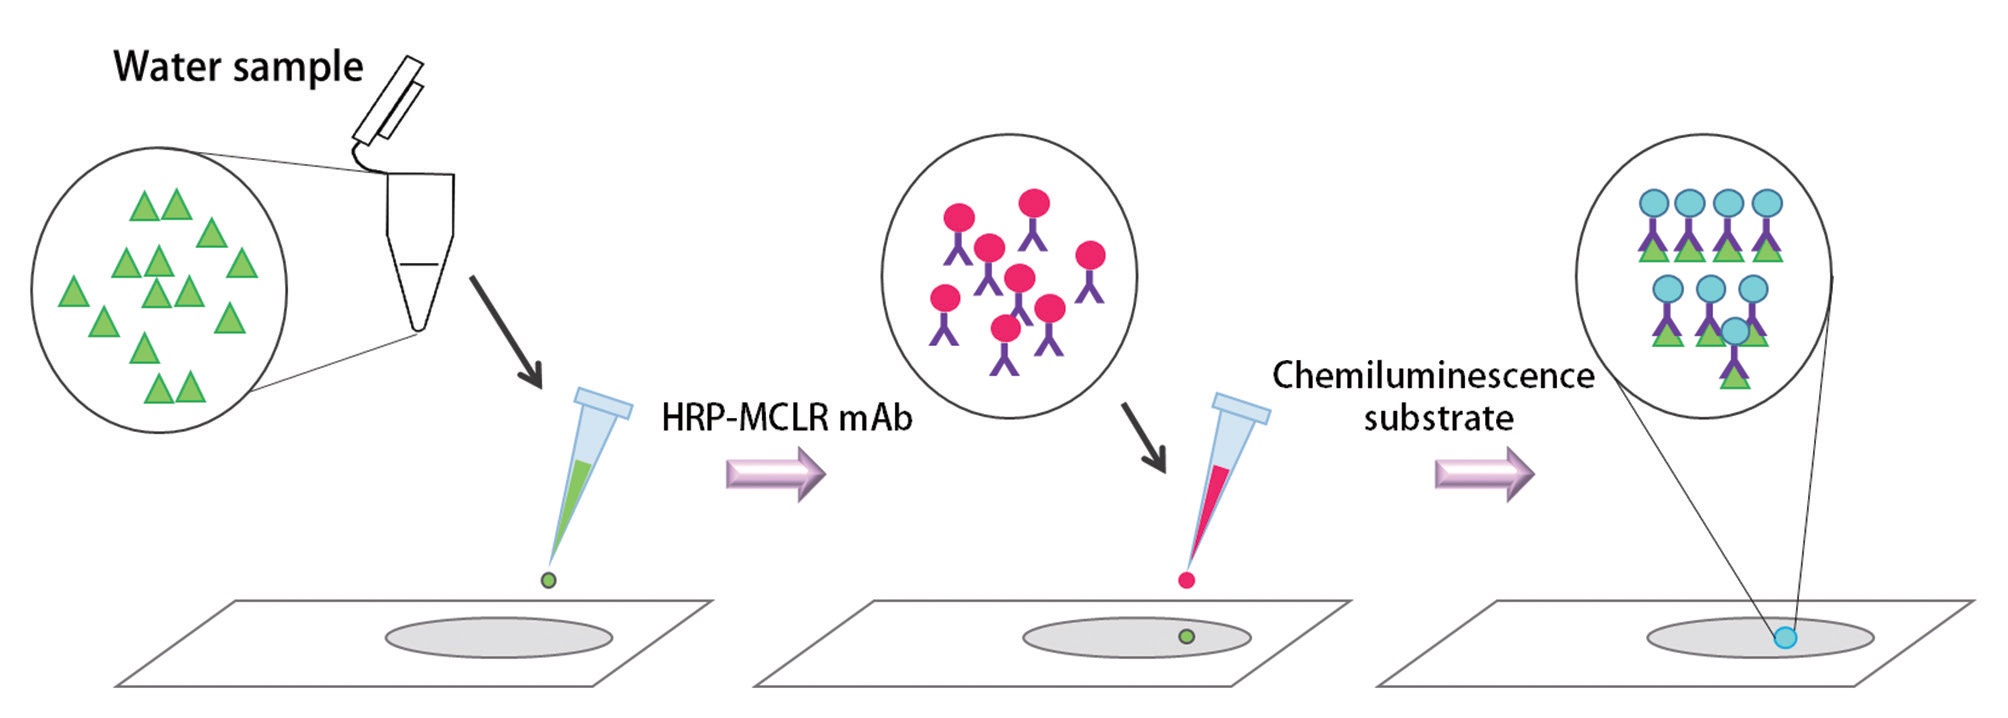
In this study, we used a new chemiluminescence immunochromatographic assay system using microcystin monoclonal antibodies. In this assay system, an unknown sample containing microcystin is dispensed on a detection spot in the chemiluminescence assay strip. Then, the horse radish peroxidase (HRP) labeled microcystin monoclonal antibodies and chemiluminescence substrate (luminol and hydrogen peroxide) is dispensed. The intensity of chemiluminescence on the detection zone is scanned in to the luminometer, converted into an area value and the concentration of microcystin in the unknown sample is calculated from the standard curve or the equation of the standard curve.
This paper deals with the comparison of analytical performance between the chemiluminescence immunochromatographic method and the HPLC detection.
HRP, luminol (5-amino-2,3-dihydro-1,4-phthalazine-dione), hydrogen peroxide, sodium hydroxide, glutaraldehyde, bovine serum albumin (BSA), keyhole limpet hemocyanin (KLH), and 1-ethyl-3,3?-dimethyl-aminopropyl carbodiimide (EDAC) were purchased from Sigma (St. Louis, MO, USA). Protein G was purchased from Kem-En-Tec (Copenhagen, Denmark). C18 cartridges were purchased from Baker J. Microcystin monoclonal antibody and luminometer were supplied from Boditech Co. (Chuncheon, Korea). Microcystin was extracted from
Microcystin was extracted from
The concentrating apparatus consist of two parts, namely, C18 cartridges (500 mg of octadecylsilane was packed to capacityin the plastic syringe) and a peristaltic pump which provides constant flow rate of water sample during its passage through the C18 cartridge. The flow rate was kept on 2.5 mL min-1 by using a peristaltic pump in the whole system. The C18 cartridge was properly rinsed by passing 10-15 mL of methanol and conditioned. In order to load microcystins to the reversed phase C18 cartridge, the pH of the water sample was adjusted at 7.0 microin consideration of its structure characteristic. After the concentration step, an HPLC analysis of microcystins was performed with UV detection.
>
Production of monoclonal antibodies against microcystin
To produce monoclonal antibodies against microcystin, microcystin was conjugated to BSA or KLH in the presence of 1-ethyl-3,3?-dimethyl-aminopropyl-carbodiimide (EDAC). Hybridomas producing microcystin monoclonal antibody were prepared by a standard method (Ngom et al. 2010) for immunization and cell fusion. Six-week-old mice were immunized with microcystin-KLH. The initial injection used 0.2 mL of the conjugate solution and 0.2 mL of a complete Freund’s adjuvant. Booster injections used the conjugate solution and the incomplete Freund’s adjuvant. The monoclonal antibody was produced in BALB/c mice by the hybridoma cell line, SP2/O-Ag14.
Two weeks after fusion, the hybridomas were screened for the production of anti-microcystin antibodies by an indirect enzyme-linked immunosorbent assay (ELISA) in which the microcystin-protein conjugates were coated onto plates. Hybridomas were estimated as positive for the generation of specific antibodies in case they were positive for microcystin-BSA, microcystin-KLH. The positive hybridomas were cloned several times using a limiting dilution method. Each of the established hybridoma cells producing the antibody was grown in the medium, supplemented with hydroxy tryptamine. Large quantities of antibodies were prepared from the serum-free cultured supernatants of hybridomas by membrane ultrafiltration, ammonium sulfate precipitation, with a final purification using a protein G column.
>
Preparation of HRP labeled microcystin monoclonal antibodies
The glutaraldehyde cross-link method was used to label HRP to the microcystin monoclonal antibodies. Microcystin monoclonal antibodies were added into phosphate buffered saline (PBS; pH 7.2), and the final volume was adjusted to 1 mL. After stirring for 3 min at room temperature in the absence of light, 80 μL of the 1% glutaraldehyde solution in PBS was added and incubated for 3 h. To stop the activation process, 108 μL of 1 M Tris buffer solution (pH 7.2) was added on the activated HRP labeled microcystin monoclonal antibodies and incubated for 1 h at room temperature. After incubation, dialysis was used to remove free HRP and microcystin monoclonal antibodies.
To estimate the epitope of the monoclonal antibodies produced in this study, microcystin LR, RR, and YR were subjected to indirect competitive ELISA experiments. Microcystin RR and microcystin YR as well as microcystin LR showed a fairly good binding ability against our monoclonal antibody (Pyo et al. 2003). This result suggests that the epitope recognized by our monoclonal antibody is located around the Adda portion in the structure of microcystins. Our result matches well with other works describing the production of microcystin monoclonal antibody (Young et al. 2006, Sheng et al. 2007).
>
Chemiluminescence immunochromatographic strip and cartridg
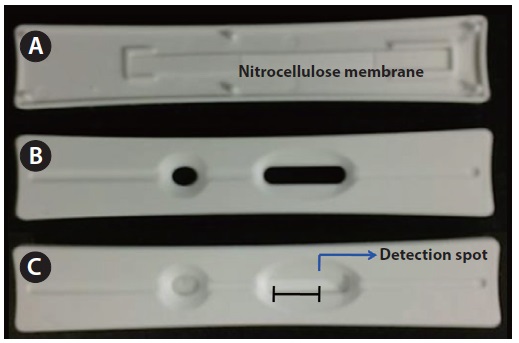
The assay strip was fabricated in-house to fit into the holder of a chemiluminescence scanner. It consists of the following: a nitrocellulose membrane, a sample pad, an absorption pad, and a backing card (Fig. 2). The nitrocellulose membrane, the sample pad, and the absorption pad are located on the adhesive side of the backing of the polystyrene card. The chemiluminescence detection zone was located on the nitrocellulose membrane (Millipore HF 180; Millipore, Billerica, CA, USA), and the bottom side of membrane was coated with a thin plastic film. The detection spot was located 10 mm to the left from the right end of the oval window.
Using an automatic dispenser, we dispensed the microcystin sample solution onto the nitrocellulose membrane with a 1 mm width and 1 μL of volume. Before placing it on the nitrocellulose membrane, the sample pad was completely soaked in PBS containing 0.05% Tween 20 and vacuum-dried at 25℃ for 40 min. Then, the membrane was dispensed again, with 1 μL of HRP labeled microcystin monoclonal antibodies. The membrane was dried again at 25℃ for 40 min. After drying, the assembled strip on a polystyrene card was placed into a plastic housing (15 × 90 mm), which was designed to fit to the holder of the luminometer. The width of the oval window of the plastic housing for the scanning of the detection zone was 15 mm. On the detection spot, 1 μL of chemiluminescence substrate was added and the emitted photons were measured. Chemiluminescence substrate was prepared with 2.6 mM luminol-H2O2 solution.
A 2 L water sample should be tested during the pretreatment procedure prior to the two different kinds of analysis. First of all, the pH of the water samples was adjusted
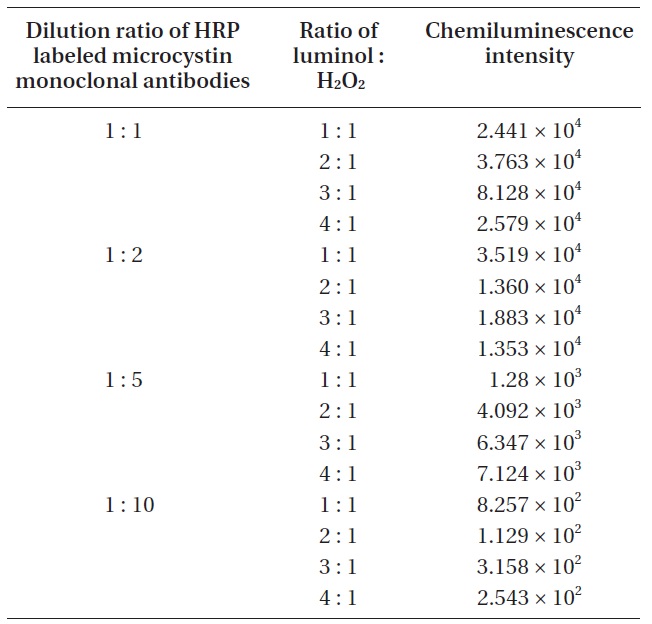
Chemiluminescence intensity as a function of mixed ratio of luminol : H2O2 and dilution ratio of HRP labeled microcystin monoclonal antibodies

Chemiluminescence intensity as a function of dilution ratio of HRP labeled microcystin monoclonal antibodies
at 7. Then the water sample was filtered of impurities to keep the flow rate of the water sample using a 0.45 μm pore size membrane.
For the improvement of the sensitivity in chemiluminescence detection, it is essential to find the optimum ratio of luminol and chemiluminescence substrate. To find the optimum ratio of luminol and chemiluminescence substrate, four different ratios (luminol : H2O2 = 1 : 1, 2 : 1, 3 : 1, 4 : 1) were tried. At the same time, four different diluted HRP labeled microcystin monoclonal antibodies (1 : 1, 1 : 2, 1 : 5, 1 : 10) were used for each luminol/hydrogen peroxide ratio. An aliquot of 1 μL microcystin (1.1 ng mL-1) was spotted on the detection spot of the nitrocellulose membrane, and a HRP labeled microcystin monoclonal antibodies of a given concentration was applied on the same spot. The chemiluminescence produced on the detection spot was measured. Results were shown in Table 1.
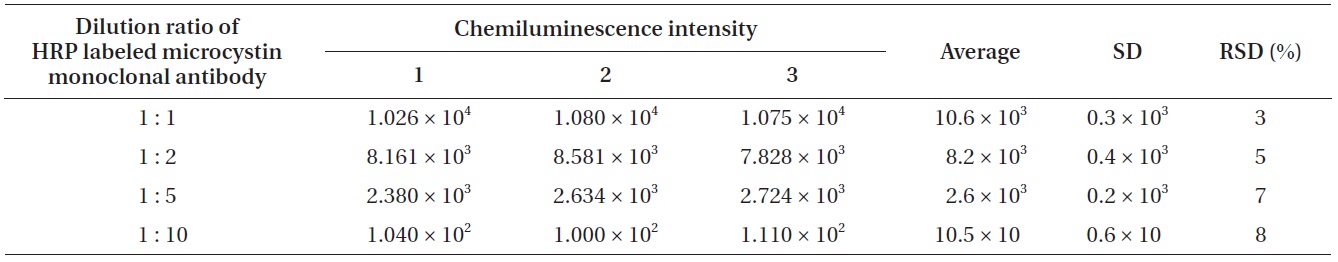
In order to clarify the relationship between the chemiluminescence intensity and the concentration of HRP labeled microcystin monoclonal antibodies, the concentration of chemiluminescence substrate was kept constant and four different diluted HRP labeled microcystin monoclonal antibodies were used. Four different diluted HRP labeled microcystin monoclonal antibodies (1 : 1, 1 : 2, 1 : 5, 1 : 10) were prepared by diluting them with 0.01 M Tris buffer (pH 6.5). 1 : 2 means the mixed solution of 1 volume of HRP labeled microcystin monoclonal antibodies and 2 volume of 0.01 M Tris buffer (pH 6.5). Table 2 shows the relationship between the chemiluminescence intensity and the concentration of HRP labeled microcystin monoclonal antibodies.
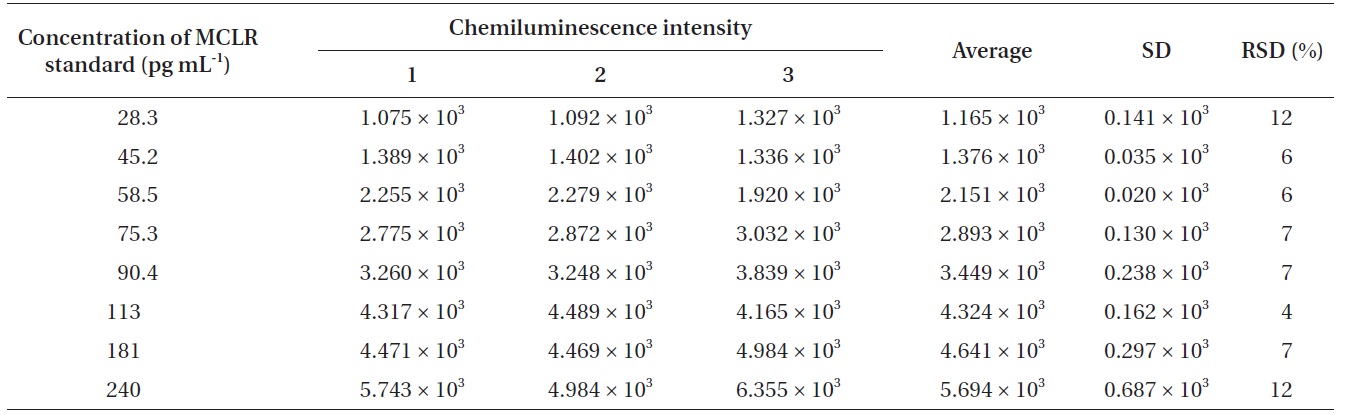
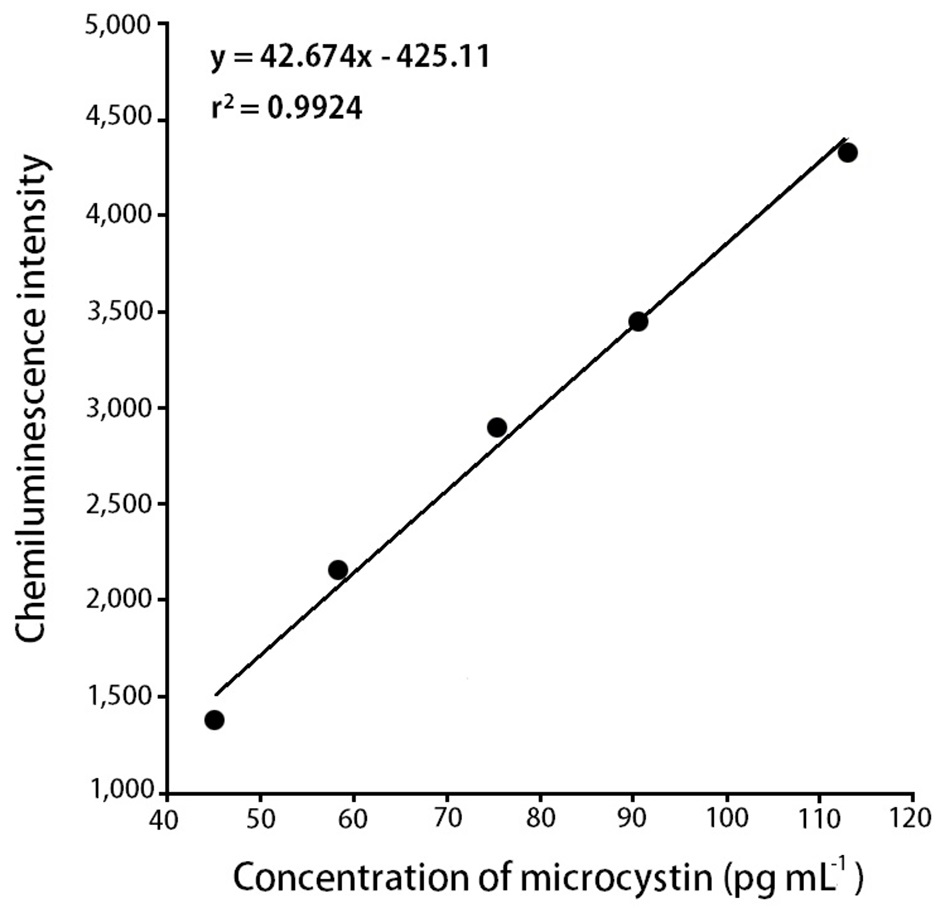
To find out the relationship between chemiluminescence intensity and the concentration of microcystin in water samples, we measured chemiluminescence intensity with the eight different concentrations of microcystin standards (28.3, 45.2, 58.5, 75.3, 90.4, 113, 181, and 240 pg mL-1). Microcystin standards were prepared by diluting with 0.01 M Tris buffer (pH 6.5). With 28.3 pg mL-1 of microcystin solution, the measured chemiluminescence intensity was 1.165 × 10³, and with 240 pg mL-1 of the microcystin solution, the measured chemiluminescence intensity was 5.694 × 10³. The results were summarized in Table 3.
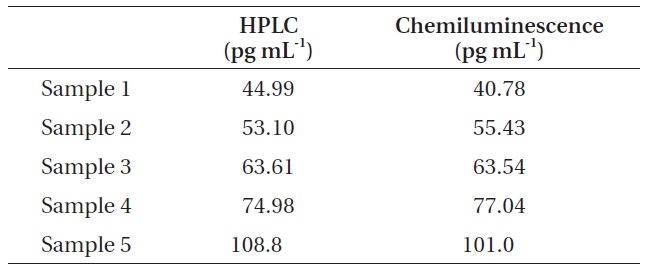
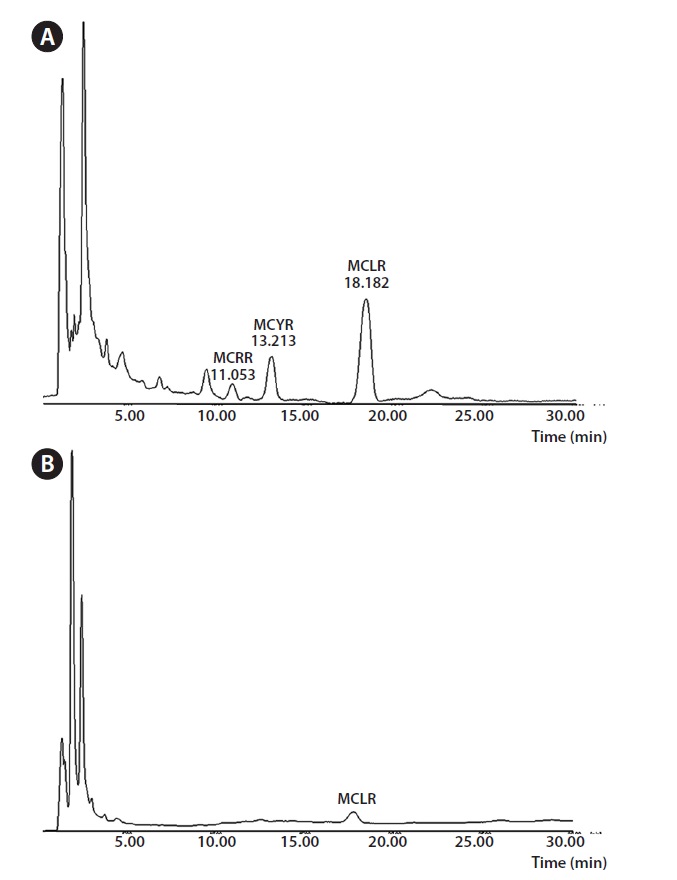
For the comparison of chemiluminescence immunochromatography and HPLC, we measured the concentrations of microcystin in five real water samples using two different analytical methods, i.e., HPLC and chemiluminescence immunochromatography. For sample 1, the concentration of microcystin was measured at 44.99 pg mL-1 by HPLC and 40.78 pg mL-1 by chemiluminescence immunochromatography. For sample 1, the concentration of microcystin was measured at 44.99 pg mL-1 by HPLC and 40.78 pg mL-1 by chemiluminescence immunochromatography. For sample 2, the concentration of microcystin was measured at 53.10 pg mL-1L-1 by HPLC and 55.43 pg mL-1 by chemiluminescence immunochromatography. For sample 3, the concentration of microcystin was measured at 63.61 pg mL-1 by HPLC and 63.54 pg mL-1 by chemiluminescence immunochromatography. For sample 4, the concentration of microcystin was measured at 74.98 pg mL-1 by HPLC and 77.04 pg mL-1 by chemiluminescence immunochromatography. For sample 5, the concentration of microcystin was measured at 108.8 pg mL-1 by HPLC and 101.0 pg mL-1 by chemiluminescence immunochromatography. All these results were shown in Table 4. Fig. 3 shows the typical HPLC chromatograms of highly concentrated microcystin standards
[Table 3.] Chemiluminescence intensity against different concentration of MCLR standard

Chemiluminescence intensity against different concentration of MCLR standard
and a real unknown sample containing microcystin LR.
In our chemiluminescence assay system, the unknown sample containing microcystin is dispensed on a detection spot in the chemiluminescence assay strip. Then, the HRP labeled microcystin monoclonal antibodies and
chemiluminescence substrate was dispensed on the same spot. The chemiluminescence substrate consisted of 2.6 mM luminol solution and the 3% H2O2 solution. H2O2 in the chemiluminescence substrate was reacting with HRP and as a result, an oxidized form of HRP was produced. Then luminol was added on the oxidized form of the HRP, and through these reactions, chemiluminescence took place on the strip (Fig. 4). The intensity of chemiluminescence light on the detection spot which is linearly correlated with the concentration microcystin in the sample was scanned in to the luminometer. Chemiluminescence light intensity was then converted into an area value and the concentration of microcystin in the unknown sample was calculated from the standard curve or the equation of the standard curve.
For effective chemiluminescence detection, it is essential to find the optimum ratio of luminol and chemiluminescence substrate. According to the results (Table 1) of the experiments to find the optimum ratio of luminol and chemiluminescence substrate, a 3 : 1 ratio seems to be the optimum luminol/hydrogen peroxide ratio for the sensitive chemiluminescence detection. From the 1 : 1 to 3 : 1 ratio, we could observe that a higher luminol ratio resulted in an increase in the chemiluminescence intensity. However, in the case of a 4 : 1 ratio, a severe decrease in the chemiluminescence intensity was observed because of a too low composition of hydrogen peroxide. The role of hydrogen peroxide is to produce an oxidized HRP. The oxidized HRP can return the excited state (3-APA*) to the ground state (3-APA) of luminol, resulting in releasing energy in the form of light. Consequently, a decrease of the oxidized HRP compound owing to retarded oxidation should cause the decrease in chemiluminescence intensity.
According to the results (Table 2) of the experiments to find the relationship between the chemiluminescence intensity and the concentration of HRP labeled microcystin monoclonal antibodies, a 1 : 1 solution showed the largest chemiluminescence intensity while a 1 : 10 solution showed the smallest. Increasing the HRP labeled microcystin monoclonal antibodies concentration resulted in the increased chemiluminescence intensity.
For the precise measurement of the concentration of microcystin in water samples, it is important to find out the relationship between the chemiluminescence

Comparison of HPLC method and chemiluminescence immunochromatographic method for the analysis of microcystin in water sample

Major advantages and disadvantages of chemiluminescence immunochromatographic assay method
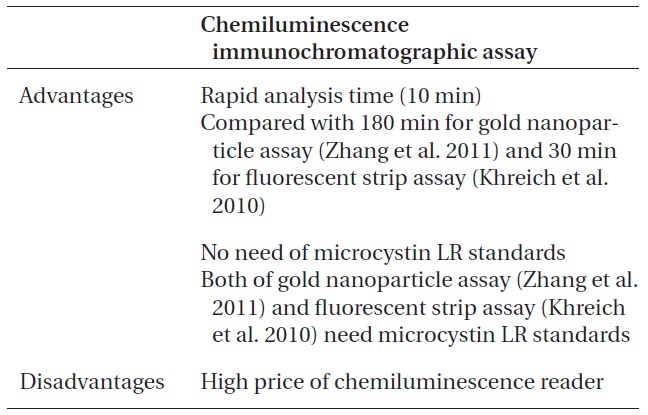
intensity and the concentration of microcystin in water samples. According to the results (Table 3), we could observe a linear relationship between the chemiluminescence intensity and the concentration of microcystin in the water samples. The chemiluminescence intensity increased linearly by increasing the concentration of microcystin in the water samples. The standard curve, i.e., the chemiluminescence signals against different concentrations of microcystin-LR-biotin conjugate was obtained (Fig. 5). From these experiments, we could observe that the linear dynamic range of the chemiluminescence immunochromatographic assay system was 45-115 pg mL-1, and the minimum detection level of the system would be about 45 pg mL-1. Although the polyclonal antibody assay (Sheng et al. 2006) lowered the detection limit up to 17 pg mL-1, the use of polycolonal antibody resulted in poor reproducibility. On the other hand, monoclonal antibodybased assay (Khreich et al. 2009) insisted on a detection limit of 10 fmol mL-1, however, in their experiments, microcystin LR of 30 pg mL-1 and 50 pg mL-1 was added to water sample, and then analyzed as 24.7 pg mL-1 and 42.0 pg mL-1 which are not accurate at all. The major advantages and disadvantages of our chemiluminescence immunochromatographic assay method were tabulated in Table 5.
Finally, we measured the concentrations of microcystin in five real water samples using HPLC and chemiluminescence immunochromatography. In the case of HPLC analysis, a C18 solid phase extraction cartridge was necessary in order to concentrate the microcystins effectively in water samples. Although the concentration of microcystin in real samples was extremely low, the chemiluminescence immunochromatographic method and HPLC results correlated very well with correlation coefficient (r2) of 0.979. Therefore, the strip chemiluminescence assay system developed in this work can be used effectively for the trace analysis of microcystin in a water sample.
In this work, we compared the chemiluminescence immunochromatographic assay and HPLC for the quantitative analysis of microcystin, and both results correlated very well. The chemiluminescence immunochromatographic assay system developed can be successfully applied on the detection of low concentration of microcystin in water samples. The detection sensitivity of the chemiluminescence immunochromatography using monoclonal antibodies was high enough to utilize for the measurement of microcystin content in water. The linear dynamic range of the chemiluminescence immunochromatographic assay system was 45-115 pg mL-1, and the minimum detection level of the system would be about 45 pg mL-1. The method is based on high specific monoclonal antibody against microcystin and designed to ease to use without any pretreatment.