This paper presents the experimental investigation of a biplane micro air vehicle. The effects of geometric parameters, gap, stagger, and decalage angle are investigated at low Reynolds number (~150,000) in a low-speed wind tunnel. A rigid flat plate with an aspect ratio of one and square planform shape is used to evaluate all three geometric parameters. The side dimension of the single flat plate is 0.15 m. The goal is to find an optimal biplane configuration that should exceed monoplane performance by generating high lift and flying as slow as possible, in order to capture high-quality visual recordings. This configuration will directly help to fly at a lower velocity and to make tighter turns that are advantageous in restricted environments. The results show that the aerodynamic performance of the biplane MAV is significantly enhanced through the combination of gap and stagger effects. A performance comparison demonstrates the superiority of the optimal biplane configuration compared to a monoplane in cruise and glide phases. Moreover, no significant compromise is found for the range, endurance, and climb performance.
The concept of the biplane configuration can be traced back to the first revolutionary powered flight at Kitty Hawk, North Carolina, on December 17, 1903. General biplane theory was extensively investigated in the early 1920s, and is commonly known as Munk theory [1]. Several experimental studies were conducted to evaluate the effect of various geometric configurations [2-4]. The subsequent research in structural and materials engineering resulted in high-aspectratio monoplane configurations, and research on biplane configurations was abandoned.
Micro Air Vehicles (MAVs) have gained significant attention from the defense industry in recent years because of their versatility in multi-faceted mission profiles. Conceptually, MAV systems should be capable of immediate deployment, and are operated through a palm-sized ground control station by a single operator. Typical flight scenarios such as closefield battle support, post-attack near-area surveillance, and navigation in small environments like caves and tunnels can only be accomplished by MAVs. MAVs are strictly defined by their dimensional size, which precludes the use of highaspect- ratio configurations as a solution. No system has yet achieved full operational status.
One of the problems found with fixed-wing MAVs is the difficulty in capturing high-quality visual data during flight. This is because monoplane MAVs are required to fly at relatively high speed in order to produce significant lift with limited wing area. This compromises the quality of data captured and reduces the effectiveness during missions. A possible solution is the biplane configuration. The advantages of biplane configurations in terms of aerodynamic efficiency for dimensionally constrained configurations are well known. This configuration can increase the aerodynamic performance of an MAV by contributing the desired lift at significantly low speed compared to a monoplane MAV.
The MAV flight envelope is within a low Reynoldsnumber regime, which poses another problem. The effects of Reynolds number play a dominant role in the aerodynamics of MAVs and small UAVs. As the Reynolds number decreases, the overall performance of a lifting body decreases. Phenomena such as separation bubbles (which can be as large as 20?30% of the chord) can significantly affect the lift and drag characteristics. Flow around an MAV is viscous and involves laminar, transitional, and turbulent boundary layers. This regime is known for its complexity, where flow phenomena such as laminar separation bubbles and wing-tip vortices may occur. At small angles of attack, a closed separation bubble is formed near the leading edge of the lifting surfaces. The sensitivity of aerodynamic data also increases significantly at low Reynolds number.
Traub [5] has studied the feasibility of a biplane deltawing configuration as a potential aerodynamically superior platform for MAV applications. Experimental investigations were carried out with 75-degree delta wings, and the effects of stagger were evaluated. Prandtl lifting theory and Polhamus leading-edge suction [6] were combined to develop a theoretical estimation technique, and experimental validation was carried out for the theoretical model. The stagger effects were found to be less pronounced than gap effects. However, the applicability of the theoretical model to other planform shapes such as elliptical, rectangular, Zimmerman, or inverse Zimmerman shapes has not yet seen demonstrated.
Moschetta and Thipyopas [7] compared the performance of a monoplane MAV to that of a biplane configuration. The optimization of geometric variables (stagger, gap, decalage angle, and aspect ratio) was conducted through numerical investigations and wind-tunnel validations. The propeller interaction with the biplane configuration was also studied. The results demonstrated the potential of biplane MAVs as an alternative to monoplane platforms such as the Black Widow MAV.
In this paper, the wind tunnel testing of both monoplane and biplane configurations is discussed. A generic windtunnel model was fabricated to vary the gap, stagger, and decalage angle. Then, the experimental data was collected in a low-speed wind tunnel at low Reynolds number. A rigid, flat-plate square wing with an aspect ratio of 1 was used to evaluate the three geometric parameters identified. The analysis consists of a comparison between the flight performance parameters of a monoplane and an optimized biplane. The results indicate that the gap and stagger effects are more dominant in the aerodynamics than the decalage angle. The optimal configuration with the best lift-to-drag ratio was selected for further analysis, in which a flight performance comparison was carried out between a monoplane and the optimized biplane configuration.
2. Experimental Setup and Procedures
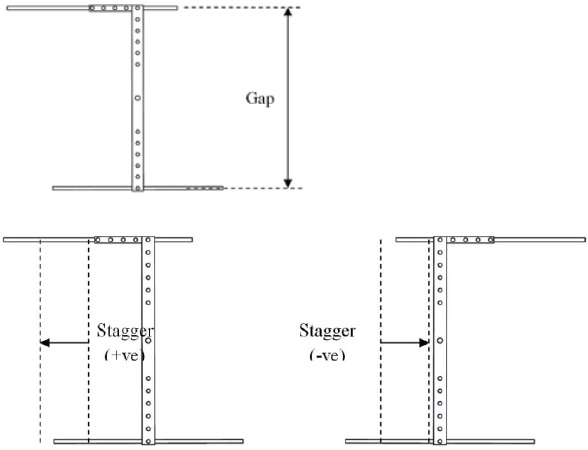
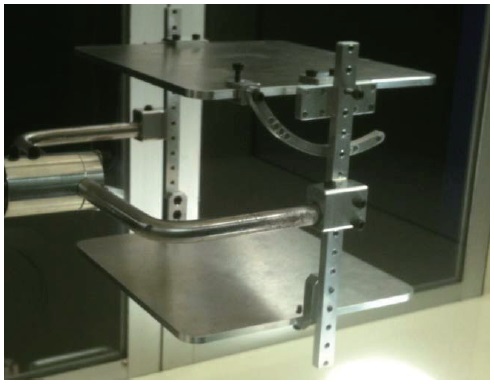
A wind tunnel model was fabricated for the evaluation of aerodynamic forces on the biplane MAV. The key feature of the bi-planar prototype is the ability to adjust the three geometric parameters: the gap, stagger, and decalage angle. The gap is defined as the vertical distance between the two wings. The stagger is the relative horizontal position of the leading edge of the upper wing and the leading edge of the lower wing, with a positive stagger being defined as the leading edge of the upper wing being in front of the leading edge of the lower wing . The decalage angle is the angle of the upper wing with respect to the horizontal plane of the lower wing, as shown in Fig. 1.
The design of the wing mounting setup is extremely important, as it will affect the accuracy of the wind tunnel measurements, and it must have structural integrity to be able to withstand aerodynamic loads. The wings are designed according to the dimensional restrictions imposed on a typical MAV. The wings have an aspect ratio equal to 1.00, a thickness-to-chord (t/c) ratio of 2.67%, and a chord-length of
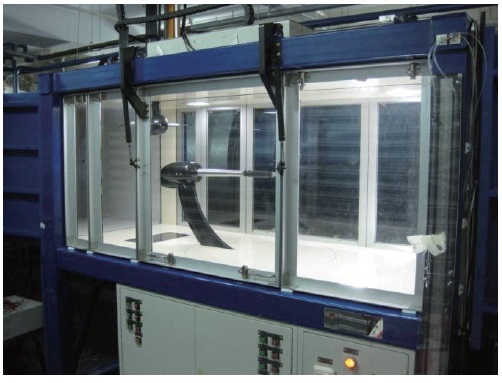
0.15 m. All edges of the rectangular plates are filleted with a 0.01-m radius. The struts are manufactured using aluminum plates with various screw holes drilled onto them. They are covered with masking tape during experiments to avoid any flow disturbances. The gap, stagger, and decalage angles can be altered easily by fixing the wings onto the holes and tightened using bolts and nuts. An arc rod is also used to further secure the wings when the decalage angle between the wings is altered. Fig. 2 shows the final prototype with wings mounted on the frame inside the wind-tunnel facility.
The Nanyang Technological University (NTU) low-speed, low-turbulence, closed-loop wind-tunnel facility was used to test the full-scale bi-planar prototype with various geometric configurations. The dimensions of the internal surfaces of the test section are 0.72 x 0.78 x 2.00 m. The air velocity inside the wind tunnel can be varied from 6-90 m/s with continuous adjustment and nearly uniform distribution. The corresponding Mach number ranges from 0.029 to 0.26. The air speed distribution inside the test section is constant and free from the boundary layer at around 80% of the area of the section. The contraction ratio of the wind tunnel is 9, and 3 anti-turbulence screens with different meshes ensure low turbulence levels. A six-component sting balance is used to measure all forces and moments, and is capable of allowing the model to perform roll, pitch, and yaw rotations. The Data Acquisition, Reduction, and Control System (DARCS) is based on a National Instruments (NI) platform and LabVIEW-based software, which is used to graphically view and record the data. Other important functions of DARCS include pre-testing data input, data storage, and post-test data visualization, as well as user access management. DARCS is also equipped with a personal computer (PC) running Windows XP, a webcam to monitor the inside of the test section, a 16-bit analog-to-digital converter (ADC), and
a motion controller. The wind-tunnel test section is shown in Fig. 3.
The aerodynamic coefficients presented in this work have all been corrected for wind-tunnel blockage effects (solid blockage and wake blockage) and interference between supports and wings, according to the techniques presented by Barlow et al. [8]. The magnitude of blockage and interference corrections for most of the scenarios is less than 12%.
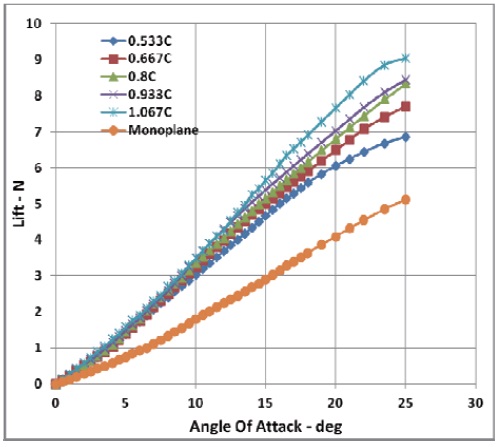
The motivation for adopting the biplane configuration is due to the increase in lift. It is evident in Fig. 4 that the magnitude of lift produced by a monoplane is significantly less than with biplane configurations. For a gap of

an increase in lift by 64% to 158% compared to a monoplane is observed at low angles of attack (

the increases in lift are 115%-225% for low

However, the coefficient of lift for monoplane configurations will be higher because the area required to non-dimensionalize the biplane MAV is twice that of a monoplane. Moreover, as the gap in biplane configurations is decreased, strong interference between the two wings results in the degeneration of the lift, which is an undesirable situation. A detailed analysis on the effect of the gap was performed to address these issues.
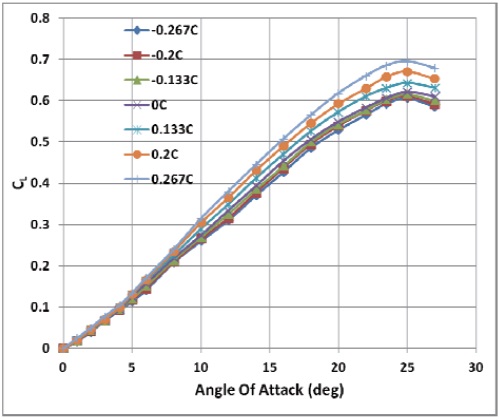
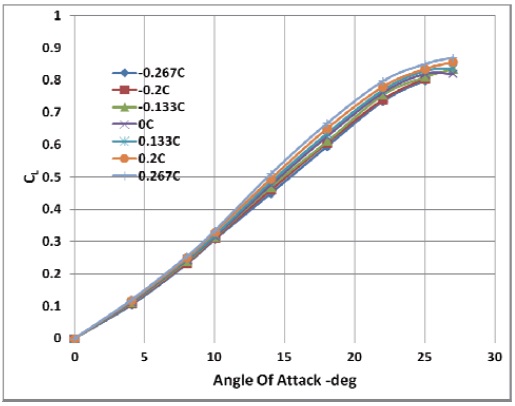
The effect of stagger is evaluated at zero decalage angle and with two gap positions,
The coefficient
of lift at the gap position of

is shown in Fig. 5. As the stagger increases from negative to positive,
When the gap is increased from
the overall coefficient of lift is improved. However, the flow interaction between the two wings is significantly reduced, which makes the lift variation become insensitive to the stagger, as shown in Fig. 6. Therefore, it can be concluded that the effect of stagger on
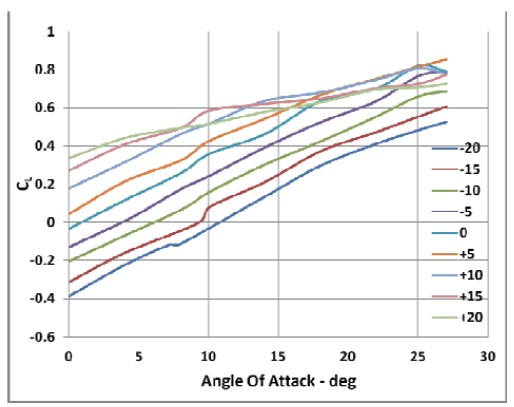
The effect of the decalage angle on the coefficient of lift was evaluated at zero stagger and two gap values,
as shown in Fig. 7 and Fig. 8.
It is evident that the coefficient of lift increases consistently with the increase in decalage angle. However, the lift behavior
is subtle . The increase in lift with the positive decalage angle primarily comes from the change in the geometric angle of attack from the upper wing. Therefore, once the decalage angle is negative, a decrease in lift is observed.
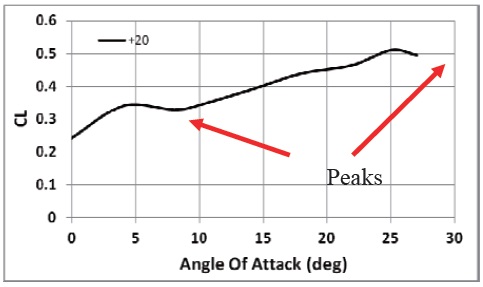
The stall behavior is also decoupled from the decalage angle variation. Fig. 9 shows that two peaks are present in the typical lift graph. The decalage angle is 20° in this case. The first peak is due to the stall of the upper wing, whereas the second peak is from the lower wing. No evident advantages of the decalage angle are observed in the optimal configuration.
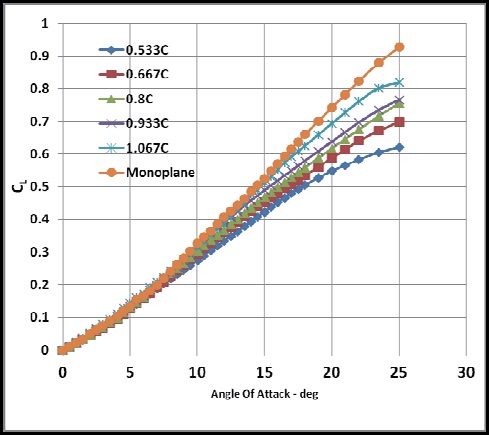
The gap between the two wings is a major factor determining the aerodynamic effects. The coefficient of lift for various gap configurations against the angle of attack is shown in Fig. 10. For reference purposes, the coefficient of lift of a monoplane is also plotted. The gap distance between the two wings is non-dimensionalized with the chord-length. The lift coefficient of the monoplane is larger than that of the biplane wings. However, as the gap between the two wings is increased, the lift approaches that of the monoplane case at
high angles of attack. This is a clear indication that the vortex induced lift for biplane configurations is less than that of the monoplane counterpart.
It is evident that there is an increase in the lift curve slope as the gap increases. Moreover, the maximum lift coefficient also increases with the gap, by up to 32% at

This is mainly due to the reducing effect of the flow interference between the two wings. The stall angle remains near 25° for all values of gap. This reflects the independency between the stall angle and the gap.
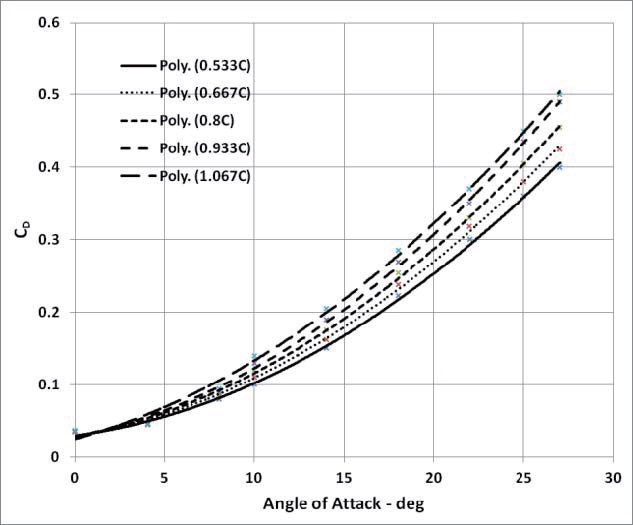
The effect of the gap on the coefficient of drag is shown in Fig. 11. It is evident that the drag increases with the gap. The vortex lift contribution increases with the gap, thereby increasing the drag coefficient. At low angles of attack, the increase in drag is less than 5% overall. However, as the angle of attack increases, the drag profile becomes more separated across various gaps. An increase in drag of up to 25% is observed at an angle of attack of 25°.
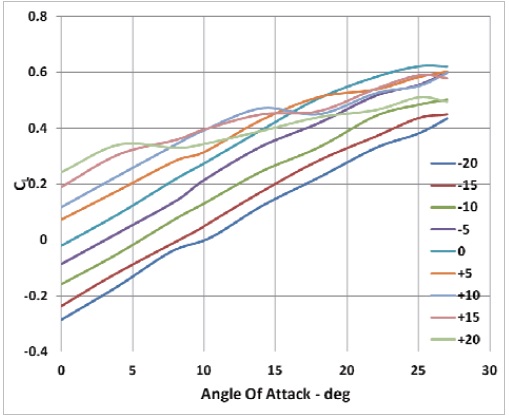
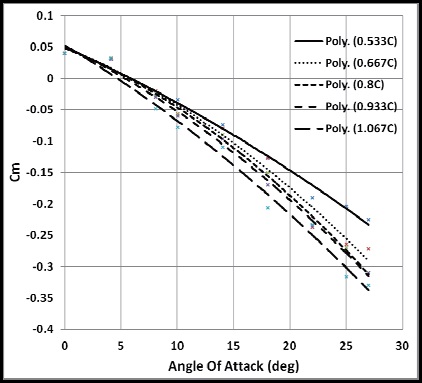
The effect of the gap on the coefficient of the pitching moment is shown in Fig. 12. The pitching moment shown is calculated at the leading edge of the bottom wing. The static
stability
3.5 Final Optimized Biplane Configuration
Through the study of the geometric effects on the aerodynamic performance of a bi-planar MAV, it is possible to identify the biplane configurations that will optimize an MAV based on the requirements of its mission profile. The optimization process should be conducted separately for MAVs with different missions, as the criteria identified might not be the right parameters to optimize other flight parameters. An optimized biplane configuration was selected based on the highest lift-to-drag ratio (L/D). In order to obtain higher L/D, a corresponding increase in lift and decrease in drag must be achieved. Based on the experimental data, a biplane configuration with positive stagger and low gap should be able to achieve highest L/D. The optimal configuration selected is for
stagger, and zero-degree decalage angle.
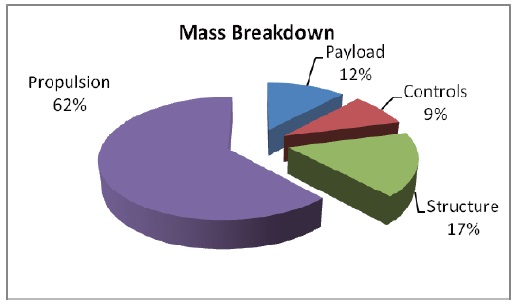
A flight performance comparison of both monoplane and optimized biplane configurations is discussed in this section. The configuration used for monoplane is identical to the wing used for the wind tunnel testing, featuring a chord length of 0.15 m, an aspect ratio of 1, and a thickness-to-chord ratio of 2.67%. For the biplane, the selected configuration is the one discussed in Section 3.5. The weight component analysis of the flying prototypes for both configurations is based on the Black Widow MAV [9]. The rationale behind using the same mass breakdown for the performance analysis is based on geometric similarity. This MAV has a similar wing span to
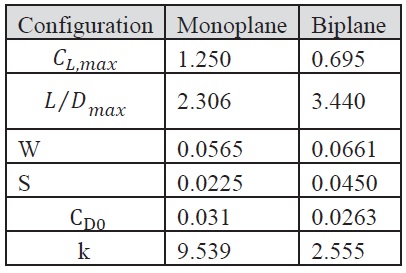
[Table 1.] Monoplane and biplane aerodynamic performance parameters

Monoplane and biplane aerodynamic performance parameters
that used in the wind-tunnel testing. It is designed to fly at 13.4 m/s, with an endurance of 30 min and a maximum flight range of 2 km. The overall mass distribution of the Black Widow MAV is shown in Fig. 13.
The weight of the monoplane is approximated using the Black Widow MAV. The weight of the biplane configuration is calculated by adding the structural weight of an additional wing to the overall configuration. The values of
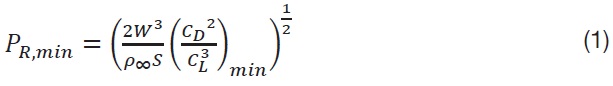
The level flight performance is tabulated for a cruise velocity of 20 m/s and air density of 1.225kg/m3. The minimum power required is calculated using Eq. (1).
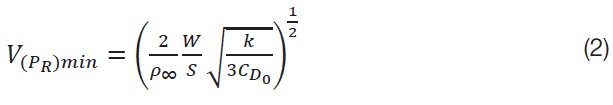
The velocity at the minimum power required is:
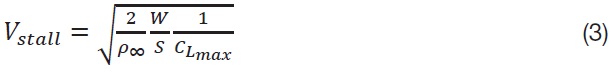
The stall speed is given by:
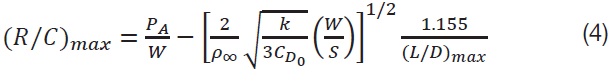
The power available depends on the energy source used in the MAV. Generally, batteries are used in an MAV due to its lower energy usage. The choice of batteries usually depends on the aerodynamic performance of the MAV. In this case, to provide a clearer picture, the power available for both configurations is fixed at 4 watts. For the steady and unaccelerated climb of a propeller-driven MAV, the maximum rate of climb is given by:
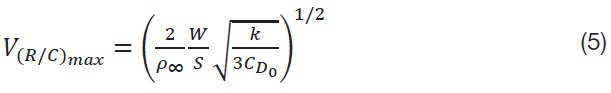
Its corresponding velocity is given by:
For a steady, unaccelerated descent, the small equilibrium glide angle is given by:
Its corresponding velocity is given by:
A maneuvering performance comparison between the monoplane and biplane was also carried out. For a level turn:
The corresponding velocity for the level turn can be estimated by:
The load factor during the level turn is approximated as:
The endurance is calculated from the following relationship:

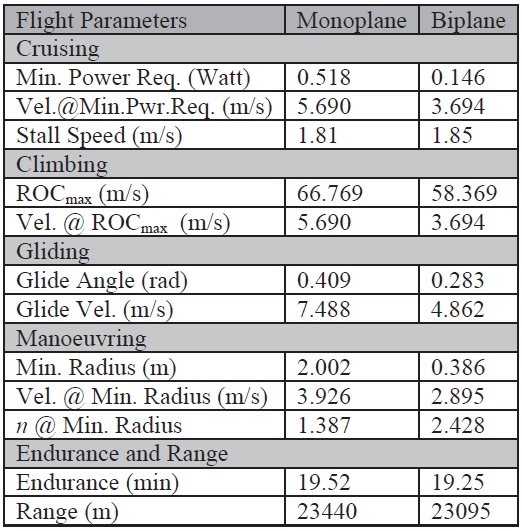
[Table. 2.] Summary of flight performance parameters

Summary of flight performance parameters
Given that both configurations used the same propulsion system, and using the battery source of the Black Widow as a guide, n=0.8 (assumed) ?? 8400 J . Since MAVs are powered by batteries, their range is typically independent of weight variations, and is calculated as follows:
The flight performance parameters are computed based on Eqs. (1) to (12), and are shown in Table 2.
For the cruise mission segment, the biplane dominated over the monoplane MAV in terms of minimum power required and reduced velocity. This has been achieved by the significant increase in lift. Moreover, the reduced flight velocity is the main objective for capturing and transmitting high-quality visual data from low-cost cameras at a reduced frame rate.
The improvement in glide performance is also significant, especially in terms of velocity and glide-slope angle. This will ensure that the ground operator can achieve easy and smooth recovery of the MAV during landing. During level turning, the minimum turn radius of the biplane MAV was improved by up to 80%, but at the cost of increasing the load factor. The endurance and range performance are not significantly affected by the biplane configuration. However, the rate of climb for the biplane MAV is reduced, but the difference is not significant. Therefore, the climb performance can be traded-off for cruise, glide, and levelturn performance.
The experimental investigation of a bi-planar MAV through wind-tunnel testing has been discussed. The objective was to study the effect of three parameters: the gap, stagger and decalage angle. It was found that the gap plays a vital role in determining the degree of flow interference occurring between the wings. The results show that the aerodynamic performance of the bi-planar MAV will be enhanced through the proper combination of gap and stagger adjustments. In the flight performance analysis, the biplane configuration helps to increase lift, enabling flight at lower speed, and maneuvering in tight spaces. However, little improvement in the range and endurance was observed.