A laser ultrasonic inspection system has the advantage of nondestructive testing. It is a non-contact mode using a laser interferometer to measure the vertical displacement of the surface of a material caused by the propagation of ultrasonic signals with the remote ultrasonic generated by laser. After raising the ultrasonic signal with a broadband frequency range using a pulsed laser beam, the laser beam is focused to a small point to measure the ultrasonic signal because it provides an excellent measurement resolution. In this paper, foreign materials are measured by a non-destructive and non-contact method using the laser ultrasonic inspection system. Mixed foreign material on the corroded part is assumed and the laser ultrasonic experiment is conducted. An ultrasonic wave is generated by pulse laser from the back of the specimen and an ultrasonic signal is acquired from the same location of the front side using continuous wave laser and Confocal Fabry-Perot Interferometer (CFPI). The characteristic of the ultrasonic signal of existing foreign material is analyzed and the location and size of foreign material is measured.
Ultrasonic inspection systems are used in various fields of non-destructive measurement because ultrasonic waves have a similar velocity and directivity in their material. Typically, to generate and receive the signal of an ultrasonic wave on a specimen, an ultrasonic measurement system uses the PZT transducer. The ultrasonic inspection system is impossible to apply to a specimen with complicated shape, low surface roughness and high temperature because the transmission efficiency is very low. Many researchers have attempted to eliminate such a disadvantage in various ways. One of the solutions is using the laser ultrasonic inspection system [1].
The advantage of the laser ultrasonic inspection system is its ability to generate and receive the signal of an ultrasonic wave from the specimen without contact. This system consists of two lasers. One is pulse laser that generates the ultrasonic wave in the specimen using the thermal elasticity. The other one is used in the laser interferometer to receive the ultrasonic wave signal from the specimen [2,3].
Typically, a laser ultrasonic inspection system has a very high measurement resolution because the generated ultrasonic wave is a broadband frequency in comparison to the PZT transducer. The laser interferometer receives the signal of the ultrasonic wave from a very small point of the specimen. Therefore it is possible to apply to a high temperature and complicated shape because of contact with only a small area of the specimen. On the other hand, it has some disadvantages. First it requires a very expensive device. Second the signal to noise ratio is very low. Currently, a lot of research is underway to increase the detection efficiency of the laser interferometer. Dewhoust and Shan, in particular, researched the detection of ultrasonic transmission and reflection mode in the theoretical modeling on the Conforcal Fabry-Perot Laser Interferometer, and the ultrasonic signal gain was improved by a combination of the two modes.
The laser ultrasonic inspection system is widely used to measure the corrosion and wall thinning that occur in nuclear power plant piping. As an important element in the safety of nuclear power plant piping, continuous monitoring is required of corrosion and defects. Compared to the conventional ultrasonic inspection method, laser ultrasonic inspection expands its application range because of avoidance of contact [5,6].
In this paper, the galvanic corrosion that occurs from two different metals in contact is measured using the laser ultrasonic inspection system. Generally, if corrosion occurs, the ultrasonic wave signal will be changed, assuming that the corroded parts are mixed with other materials. This part is measured using the laser ultrasonic inspection system. Ultrasonic waves are generated in the material using the Q-switched pulse laser and the ultrasonic wave signals are acquired using the CW-laser and Confocal Fabry-Perot Interferometer. The laser ultrasonic inspection system emits ultrasonic signals generated from the back of the specimen and received at the front of the specimen. Position and size are visualized by analyzing the characteristics of ultrasonic wave that occur in other materials [7].
2.1. Generation of the Ultrasonic Wave
At the laser ultrasonic inspection system, the basic principle of generation of an ultrasonic wave is the thermal elasticity of the material. Typically, laser light is illuminated in the material’s surface. Materials absorb the energy and thermal expansion occurs. On the contrary, a heated material emits the absorbed energy and contracts. Thus, when the pulse laser illuminated a material, a periodic thermal expansion and contraction occur in the material as caused by the ultrasonic wave.
Figure 1 shows the ultrasonic wave propagation process occurring on the surface of the material by using the pulse
[FIG. 1.] Generating and receiving the ultrasonic wave using the laser ultrasonic inspection system.
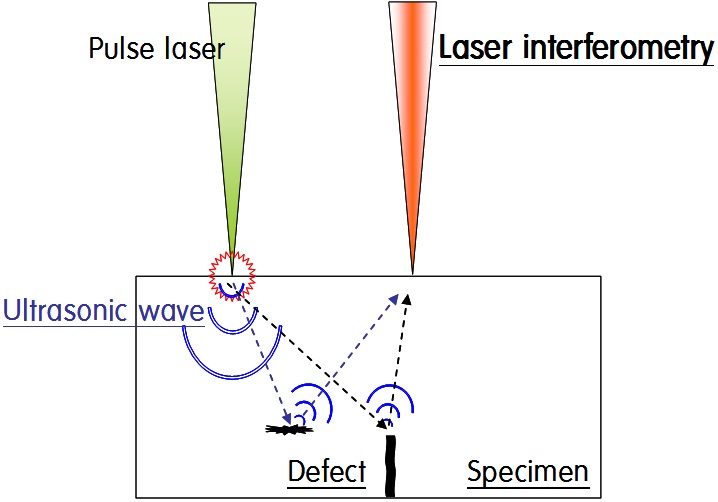
laser. In the case of the generated ultrasonic wave, the inside of the material is reflected from the internal defects and the bottom surface. The reflected ultrasonic wave signal can be received by using a laser interferometer to measure the size, position, and thickness of the defects. In this case, the laser interferometer is the probe for the detection of the ultrasonic wave. The laser ultrasonic inspection system is able to generate and receive the ultrasonic wave without contact.
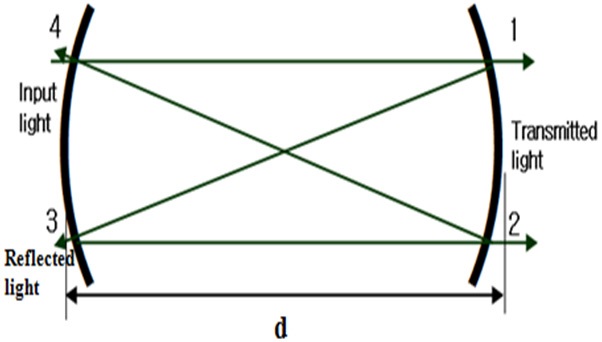
A Confocal Fabry-Perot Interferometer consists of two spherical mirrors facing each other. Fig. 2 shows the schematic diagram of CFPI. As shown in the figure, the laser light is moved to the position of 4, 1, 3, 2 and goes back to its original position. This process is repeated. At this time, the transmitted lights are infinitely increased at each location. In general, The Fabry-Perot Interferometer’s output light beams being transmitted from the first and second positions are optical lights and those from the third and fourth positions are reflected lights. The Fabry-Perot Interferometer uses the output light and the reflected lights to increase the efficiency of the measurement precision. As for the comparison of the Flat Fabry-Perot Interferometer and the Confocal Fabry-Perot Interferometer, the latter is easier to align and its frequency is easier to stabilize. In terms of the manufacturing process, the spherical mirror can be processed more smoothly than a plane mirror; therefore, the resonator of the finesse can be enhanced.
III. SPECIMEN AND EXPERIMENTAL METHOD
3.1. Dissimilar Metal Specimens
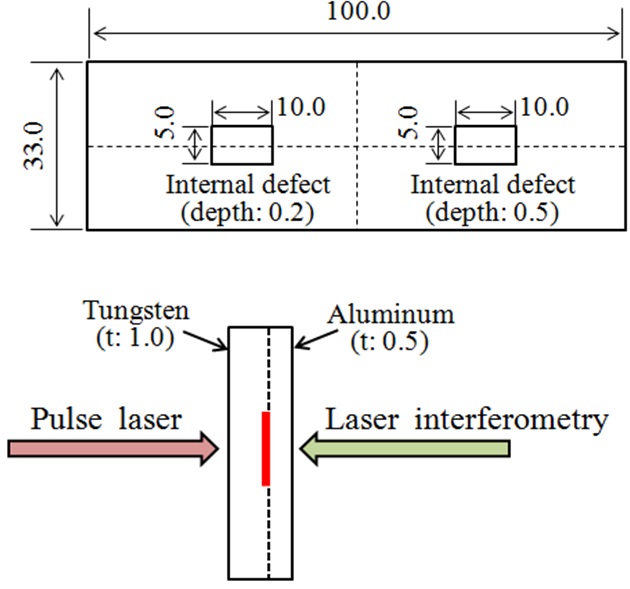
In this study, dissimilar metal specimens are produced by using tungsten and aluminum. The specimen’s horizontal and vertical dimensions are 100 mm and 33 mm respectively. The tungsten and aluminum thickness are 1 mm and 0.5 mm respectively.
Figure 3 shows the general shape of the dissimilar metal specimens. To reproduce defects resulting from the internal corrosion, the tungsten’s artificial defects are created by precision machining. Artificial defects on the horizontal
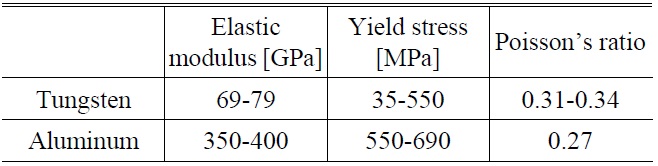
[TABLE 1.] Mechanical property of tungsten and aluminum

Mechanical property of tungsten and aluminum
and vertical dimensions are the same but the dimension thickness is different. Horizontal and vertical dimensions are 10.0 mm and 5.0 mm. Thicknesses are 0.2 mm and 0.5 mm. Artificial defects are inserted by plastic materials (polyethylene) before aluminum is bonded to tungsten. The dissimilar metal specimen’s thickness is 1.5 mm. Table 1 shows the mechanical property of the tungsten and aluminum.
3.2. Laser Ultrasonic Experiments
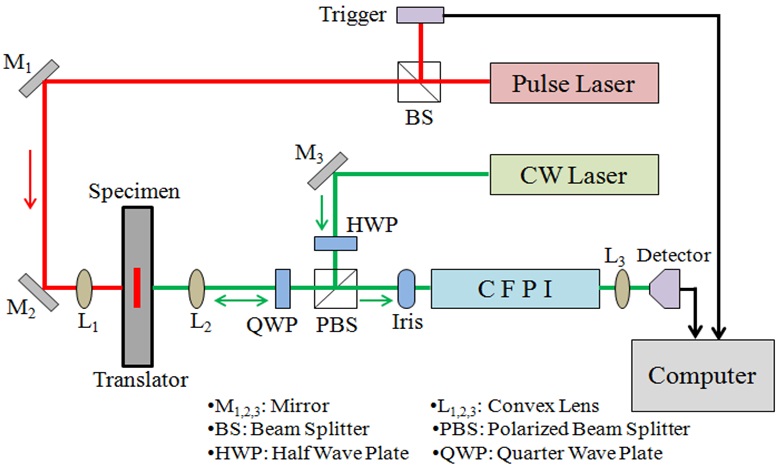
In this study, ultrasonic wave on the specimen is generated by using the pulse laser. Ultrasonic wave from the specimen is also received by using the CW laser. Pulse laser generates 1,064 nm wavelength, Max Avg power 5W and 10Hz pulse frequency. CW laser wavelength and Max Avg power are 532 nm and 200 mW. Fig. 4 shows the schematic of the laser ultrasonic experimental setup. The direction and illumination angle are adjusted by using the beam splitter and mirror. The convex lenses are installed as shown in Fig. 4 to adjust the generation and reception of the ultrasonic wave to the same position. The laser light generated by the pulse laser is split into two paths by a beam splitter. Pulse laser oscillation time and ultrasonic wave received time are completed within microseconds. One of them is irradiated on the specimen and other one synchronizes the laser interferometer. The laser ultrasonic experiment is conducted within the thermo- elastic band and produces no damage to the material if the Q-switch delay time is adjusted.
On the other hand, the laser interferometer which receives the ultrasonic signal operates as follows. The CW laser
light oscillation through the half wave plate, Polarized Beam Splitter, and Quarter Wave Plate is irradiated on the circular polarized light to the specimen. Using a convex lens, the laser light can be focused to the desired location. Next, reflected laser light from the specimen is sent back to the path. This laser light comes to the CFPI before noise is removed by passing through the iris. CFPI passes the laser beam using an optical detector which converts it into an electrical signal transmitted to the computer through the oscilloscope and dynamic stabilizers [8].
IV. EXPERIMENTAL RESULTS AND DISCUSSION
4.1. Transmission Ultrasonic Wave Results
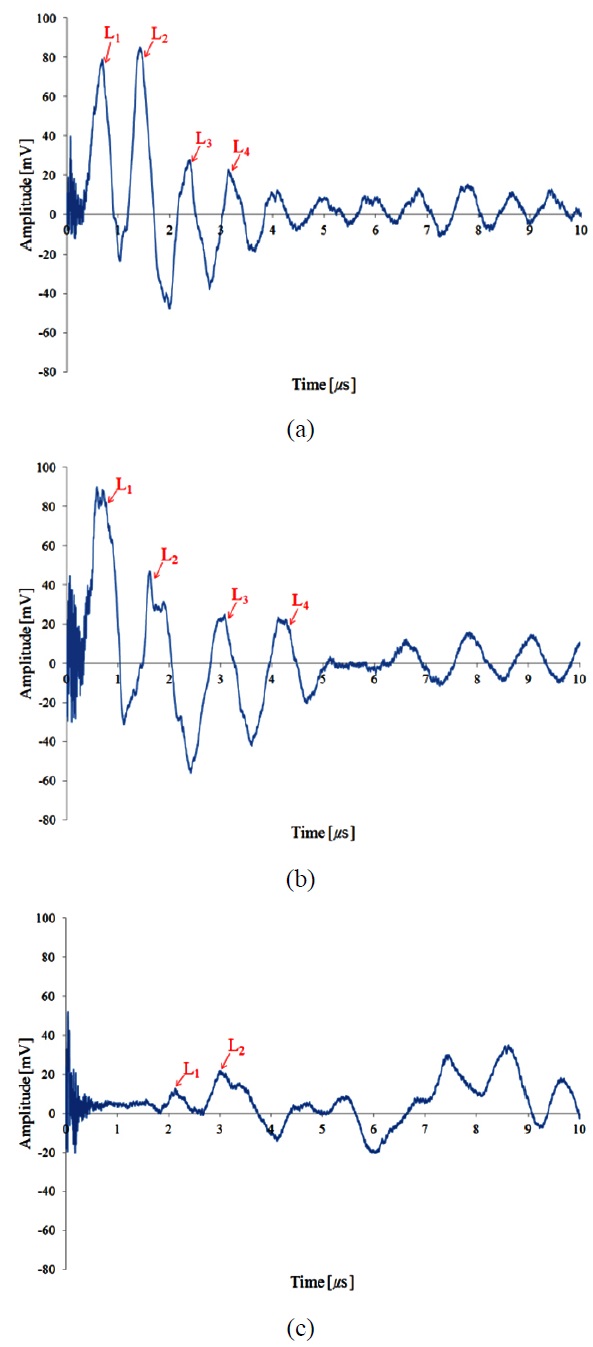
Figure 5 shows the laser ultrasonic experimental results expressed in time and amplitude. Fig. 5(a) shows a representation of the ultrasonic signal in the particle-free parts and Fig. 5(b) and (c) show a representation of the ultrasonic signal with an inserted foreign material having a thickness of 0.2 mm and 0.5 mm. L1 to L4 are signals of longitudinal wave. L1 represents the transmitted signal from the back of the specimen and L2 represents the reflected signal from the contacted location of tungsten and aluminum. Compared to particle free parts, longitudinal waves are drooped and attenuated on inserted 0.2 mm foreign materials. This phenomenon is due to the ultrasonic wave attenuation and the transmission speed change under the foreign materials. However, with inserted 0.5 mm foreign materials, a longitudinal wave signal is a very weak signal and does not show a clear pattern because the foreign material’s thickness is increased and ultrasonic waves cannot pass.
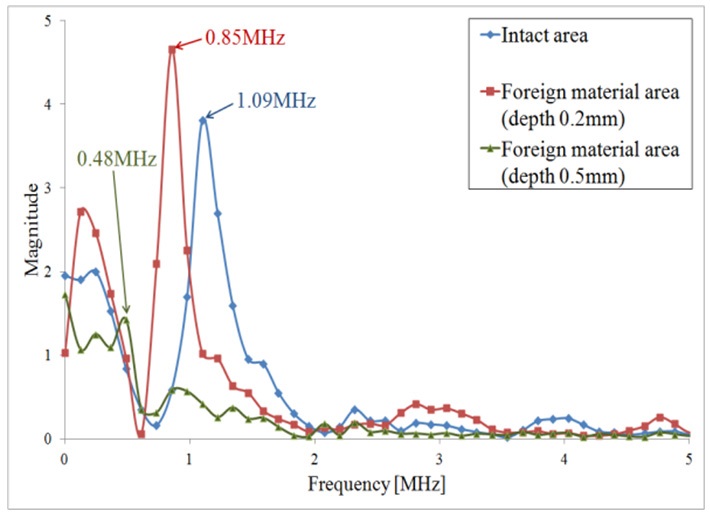
In general, noises are mixed in the ultrasonic wave. Therefore, the process of converting an ultrasonic signal that is expressed in the time domain into the frequency domain is required. Fig. 6 shows the experimental results expressed in the frequency domain. In parts with a presence of foreign material, the longitudinal wave signal is drooped and the center frequency is decreased because transmission efficiency values are decreased. Using the frequency spectrum
data, it is possible to measure the location of the foreign materials. If a scanning device is used, the size of the foreign material can be measured.
4.2. Imagery of Inserted Foreign Material Using a Scanning Device
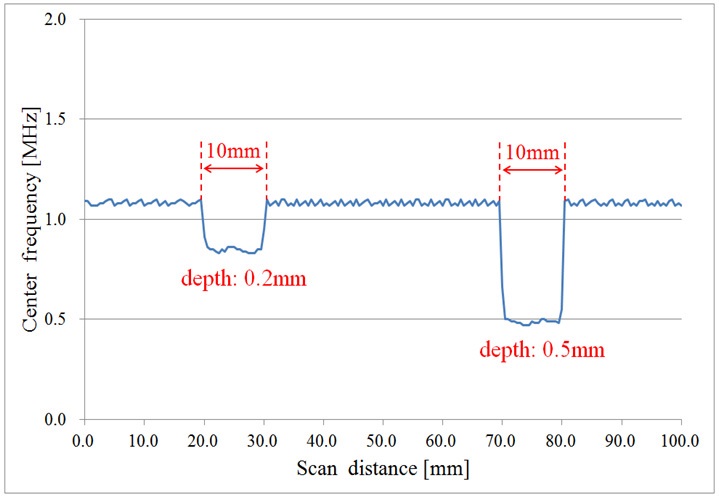
Figure 7 shows the visualization results of foreign material area which are converted by frequency domain to laser
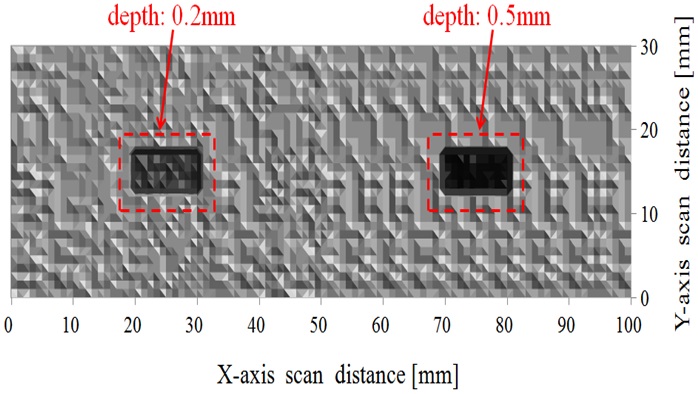
ultrasonic signals and using a scanning device that moves 50 mm with an interval of 0.5 mm steps at x-direction. As shown in the figure, the location and depth of the objects of two different thicknesses can be measured by using the conversion at the center frequency of the ultrasonic signal. Fig. 8 shows the visualization of foreign material’s location using the scanning device that moves 100 mm×30 mm in the X and Y - direction. The foreign material’s location is darker than a particle-free area because its center frequency is relatively lower than the particle-free area. Foreign material length and width are measured by assessing the phenomenon.
In this study, configured laser ultrasonic inspection system uses the CFPI, pulse laser, and CW laser to measure a dissimilar metal specimen. The generated broadband laser ultrasonic frequency ranges are 100 KHz to 200 MHz. CFPI measurement ranges are 1 to 20 MHz. The laser ultrasonic inspection system is made up so that ultrasonic signals are generated from the back of a specimen and received at the front of specimen. Ultrasonic signals are measured by CFPI. Through this study, the following conclusions are obtained.
1) Configured laser ultrasonic inspection system uses the CFPI, pulse laser, and CW laser to measure a dissimilar metal specimen. 1 to 4 longitudinal ultrasonic wave signals are measured. In the comparison of the experimental results, it is possible to measure the foreign material’s location based on longitudinal ultrasonic wave speeds changing according to the different materials.
2) The values of the center frequency ultrasonic signals in time domain and frequency domain conversion are evident due to the presence of foreign matter and the reduction in the value of the center frequency.
3) By extracting the value of the center frequency in the frequency spectrum more precisely, the presence of foreign matter is determined. In addition, foreign materials’ size is measured using a scanning device.
4) By collecting the value of each point from the center frequency of the two-dimensional scan of the x and y direction, it is possible to make a 2-D visualization of the location of foreign material.
5) By using the scanning device and visualization methods, 10 mm defect lengths have been measured as 10.5 mm. Therefore the laser ultrasonic measurement system has been obtained less than 5% error rates.