A novel fiber-optic sensor system is suggested in which fiber Bragg grating sensors are demodulated by a wavelength-sweeping fiber laser source and a spectrometer. The spectrometer consists of a diffraction grating and a 512-pixel photo-diode array. The reflected Bragg wavelength information is transformed into spatial intensity distribution on the photo-diode array. The peak locations linearly correspond to the Bragg wavelengths, regardless of the nonlinearities in the wavelength tuning mechanism of the fiber laser. The high power density of the fiber laser enables obtaining high signal-to-noise ratio outputs. The improved demodulation characteristics were experimentally demonstrated with a fiber Bragg grating sensor array with 5 gratings. The sensor outputs were in much more linear fashion compared with the conventional tunable band-pass filter demodulation. Also it showed advantages in signal processing, due to the high level of photo-diode array signals, over the broadband light source system, especially in measurement of fast varying dynamic physical quantities.
Recently, the use of fiber-optics for industrial and environmental sensing applications has been growing due to its many advantages over other sensing techniques [1]. These sensors are immune to electromagnetic interferences and can be accessed through fiber-optic links for very long distances, such as tens of kilometers, without repeaters. These outstanding characteristics are ideally suited for the condition-based maintenance of large electrical machinery in high electric potential environments. Especially for offshore wind turbines which could be more than a hundred kilometers away from the shore, fiber-optic sensing is becoming a more and more common practice, because of the poor accessibility and the fiber-optic’s immunity against the electromagnetic noise and lightning [2,3]. The conventional well-established sensors, such as strain gauges and accelerometers are prone to failures on the long-term condition monitoring uses in hostile environments and they are sensitive to lightning [4,5].
Of the currently available fiber-optic sensor techniques, the fiber Bragg grating (FBG) sensor offers good prospects in the condition monitoring of large capacity wind turbines. Quasi-distributed FBG sensor networks can be constructed on the large structures of the wind turbine, such as blades, because the FBGs can be highly multiplexed by the wavelengthencoding characteristics. Strain and temperature distributions measured with the sensor networks are essential for the decision of wind turbine operation, minimizing down time and preventing further development of any possible failures.
Because FBG sensor encodes measurand information, such as strain and/or temperature variation, to Bragg wavelength shift, different types of wavelength demodulation have been used to efficiently decode the Bragg wavelength shifts to physical quantities [6-10]. Of the techniques the tunable band-pass filter demodulation has been widely used due to its high resolution and multiplexing capabilities [7]. However, it suffers nonlinear measurement error which is generated from the tuning mechanism of the band-pass filter. Because the linear relationship between the driving voltage and the pass-band wavelength is prerequisite condition for this demodulation, the nonlinear action of the filters significantly degrades the accuracy of the sensor system.
In this paper, we used a wavelength-sweeping fiber laser source with a spectrometer demodulation setup to attain the maximum measurement linearity as well as the high signalto- noise ratio in the sensor output. The spectrometer eliminates time dependence, making the sensor output linear, regardless of the temporal nonlinearity caused by the wavelength filter. The use of a wavelength-sweeping fiber laser generates much stronger output than the broadband source system [11], which is desirable in long distance FBG sensor applications, such as off-shore wind turbines, to maintain enough output levels while sustaining the speed of measurements.
By comparing experimental results with different demodulation setups, we showed the feasibility of the suggested FBG sensor system.
It is well known that the Bragg wavelength shift ratio of a FBG sensor is given by a function of strain and temperature variation (Δ
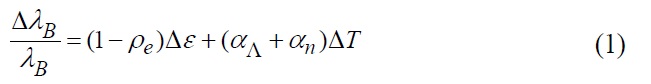
In equation (1), Δ
We used a spectrometer instead of the tunable band-pass filter demodulation to alleviate the nonlinearity issue. The spectrometer consists of a diffraction grating and a photo-diode array (PDA). The Bragg wavelengths from the FBG sensor array are directed to the diffraction grating and diffracted along different angles

where
The combination of a wavelength-sweeping laser and a spectrometer has been successfully used in a biomedical imaging technique, FD-OCT (Fourier domain optical coherence tomography) [14]. For the faster
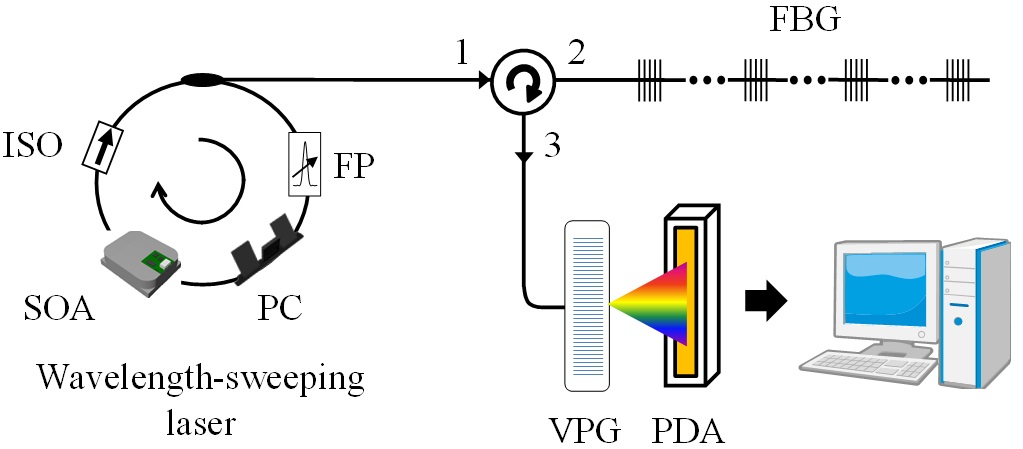
Figure 1 shows the schematic diagram of the proposed FBG sensor system. The Bragg wavelengths are interrogated by using a wavelength-sweeping fiber laser and a spectrometer (a volume holographic diffraction grating plus a photo-diode array). The laser consists of a semiconductor optical amplifier (SOA), a Fabry-Perot (FP) tunable filter, an isolator, a polarization controller, and a directional
coupler with a tunable splitting ratio. The laser output is obtained at the pass-band wavelength of the FP filter. Wavelength tuning is done by driving the FP filter with a 1 kHz ramp signal. The maximum wavelength-sweeping range is 1510~1590 nm, which is determined by the SOA’s operating range and FSR (free spectral range) of the FP filter [11]. In our experiments, the wavelength-sweeping range was 1521.5~1559.9 nm according to input driving voltage of 0~10 V at 1 kHz.
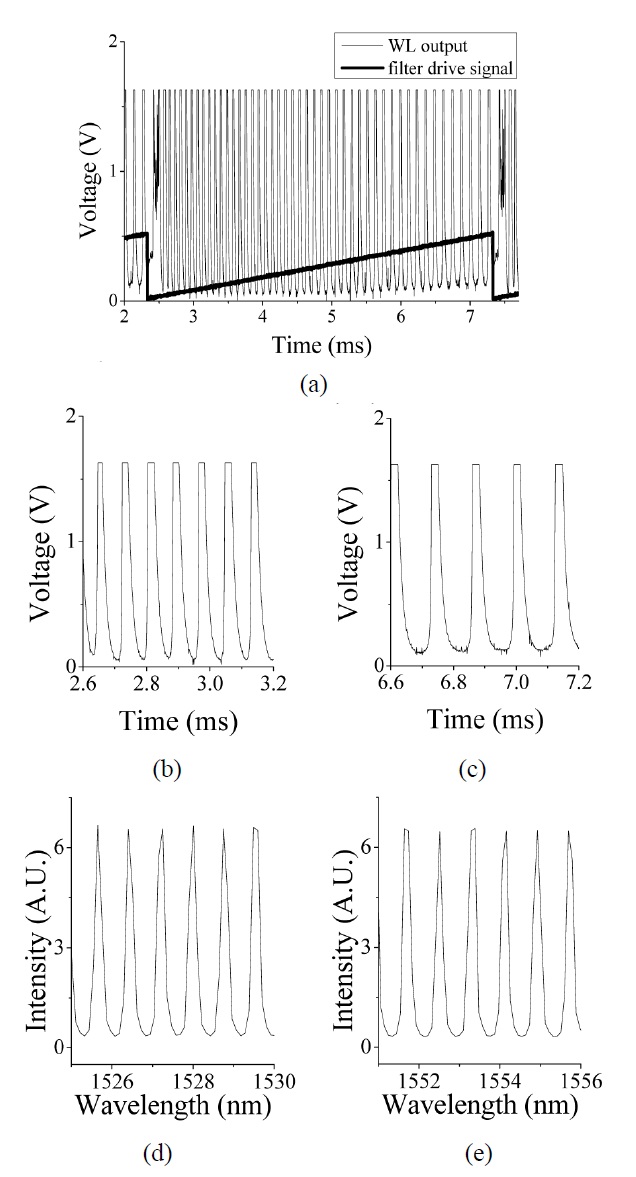
As aforementioned, the output of a wavelength-sweeping laser which is based on a tunable FP filter has a certain amount of nonlinearity. In order to show the nonlinear wavelength-sweeping of the constructed laser, we passed the laser output through a wavelength locker which had periodic transmission peaks at every 100 GHz. Then the
transmitted light intensity was measured with a photo-detector and shown in Fig. 2(a). Fig. 2(b) and (c) are 0.6 ms time windows located at the first and the last part of one sweeping range. From the comparison, it is obvious that the peaks which have 100 GHz sequential differences in the frequency domain are not equidistant in the time domain. It clearly visualized the nonlinear wavelength-sweeping of the laser source.
The same laser output after passing through the wavelength locker was measured again with a spectrometer demodulator and the same parts corresponding to Fig. 2(b) and (c) are shown in (d) and (e), respectively. The peaks are equidistantly spaced in all parts of the sweeping range, which is the strong evidence of linear wavelength demodulation.
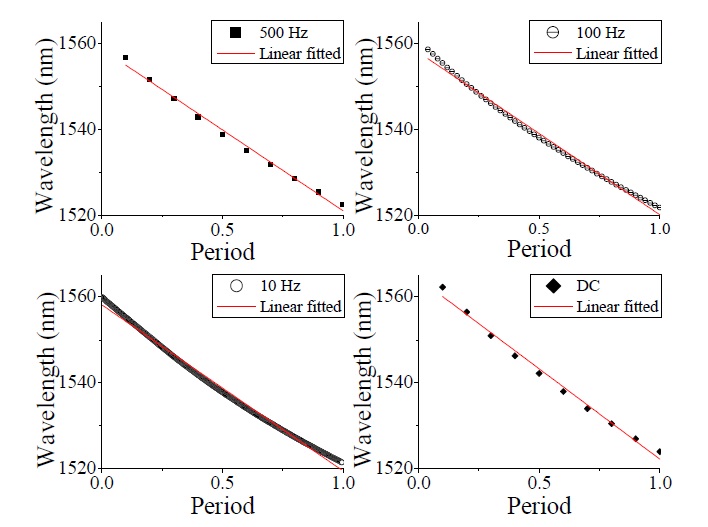
Mostly, due to the resonance characteristics of the filter, the degree of nonlinear wavelength tuning varies at different scanning frequencies. With the linear and fast measurement capability of the spectrometer, the frequency dependence could be measured. Fig. 3 shows the pass-band wavelength variations in one sweeping period at different scanning frequencies, such as 500, 100, 10 Hz, and DC. The spectrometer output was acquired at 5 kHz sampling frequency. The MEMS (micro-electro-mechanical systems) technology based filter changed the pass-band in the opposite direction against the drive voltage, generating negative tuning slopes in Fig. 3. At all frequencies the filter’s nonlinear actions were clearly shown.
From the measured and linear fitted wavelengths, the maximum discrepancy was 2 nm and the standard deviation was calculated to be 0.866 at 100 Hz of scanning frequency.
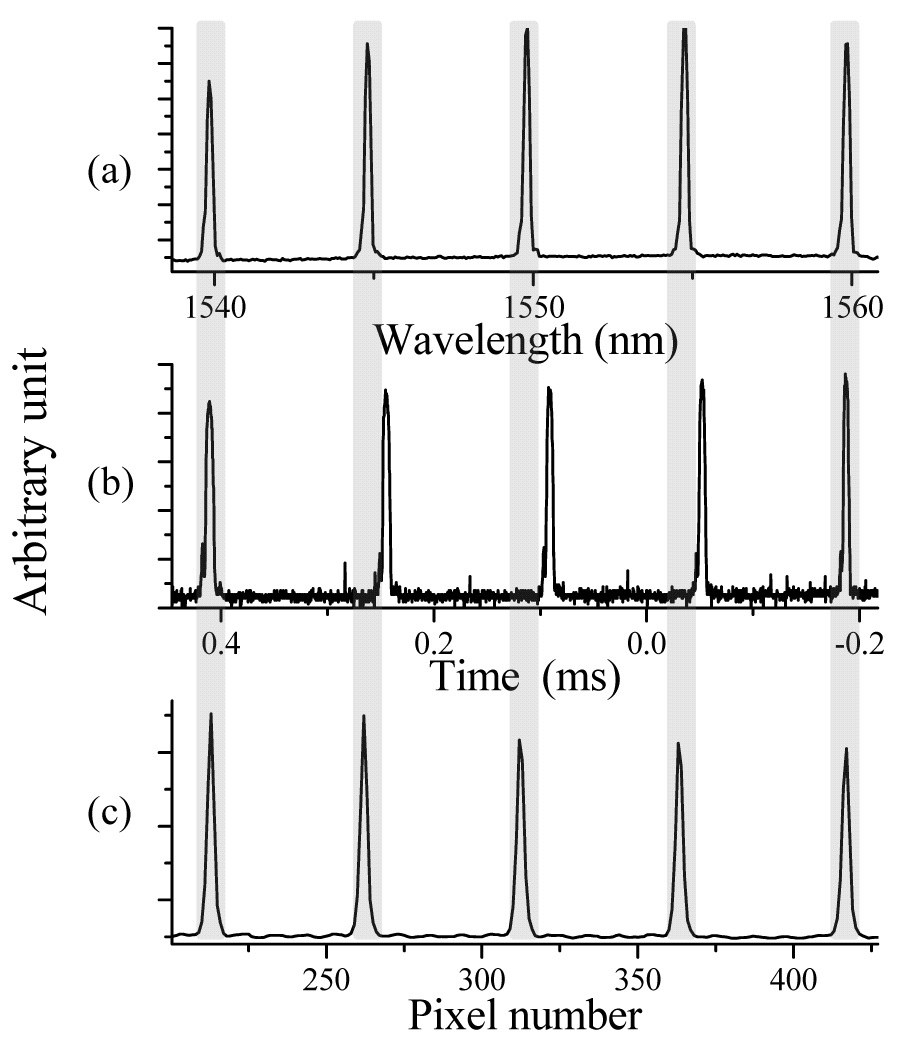
In order to test and show the feasibility of the suggested sensor system, we constructed a fiber-optic wavelength-sweeping laser to demodulate a sensor array that had serially connected 5 FBG sensors. For comparison, we used 3 different demodulation techniques. As a reference demodulator, an optical spectrum analyzer (OSA) with a broadband light source was used and Fig. 4(a) is the Bragg spectrum measured with an OSA. Figs. 4(b) and (c) are the Bragg spectra measured with the tunable band-pass filter demodulator and the spectrometer demodulator, respectively. For both cases the wavelength-sweeping laser was used as a light source. Again the measurement error by the tunable band-pass filter demodulation is clearly shown from the comparison of (b) and (c). The peak locations in the spectrum (c) are the same as those of the reference OSA signals.
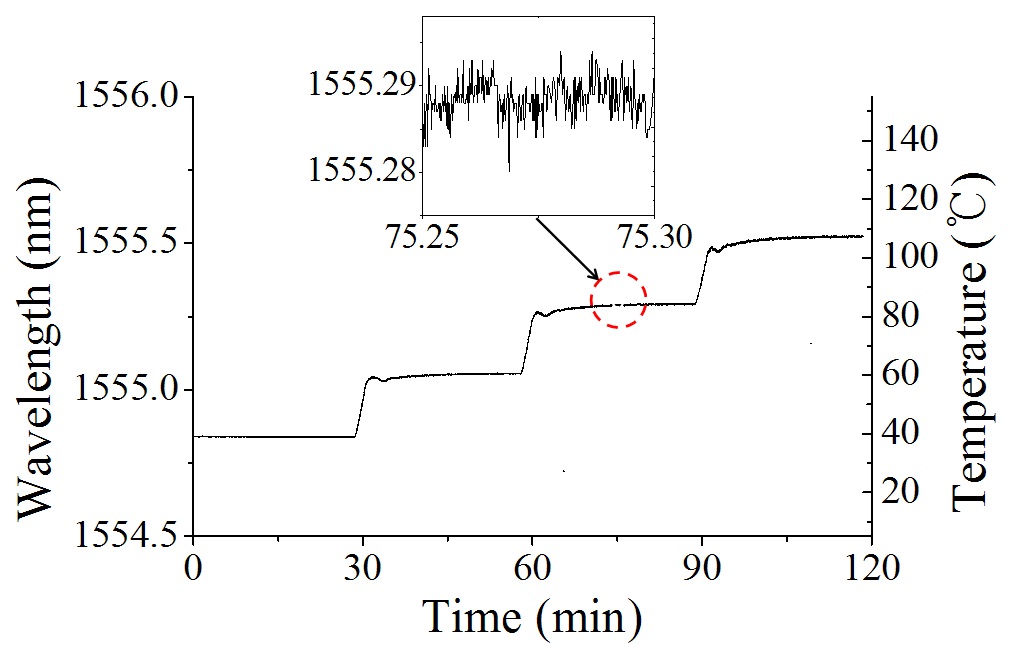
With the laser spectrometer, we measured different profiles of temperature and strain. For temperature measurement, we inserted an FBG sensor in an oven and raised the temperature
every 30 minutes. Fig. 5 shows the temperature-induced stepwise Bragg wavelength variation measured with the FBG sensor. For ease of temperature reading, the temperature corresponding to the Bragg wavelength was calculated (11 pm/℃) and displayed on the right side of the graph. From the inset of Fig. 5, the wavelength drift was less than 0.01 nm, which could be attributed to the temperature setting accuracy of the oven.
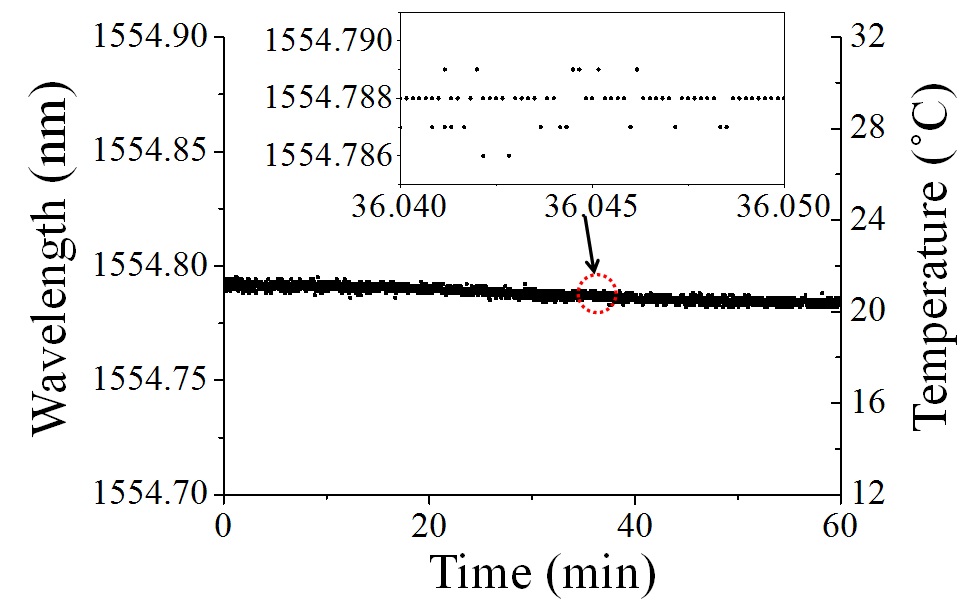
The FBG sensor was taken out of the oven and placed at room temperature for an hour and Fig. 6 shows the measured Bragg wavelength variation. The random walk of the sensor output was less than 4 pm which corresponded to ~0.4℃.
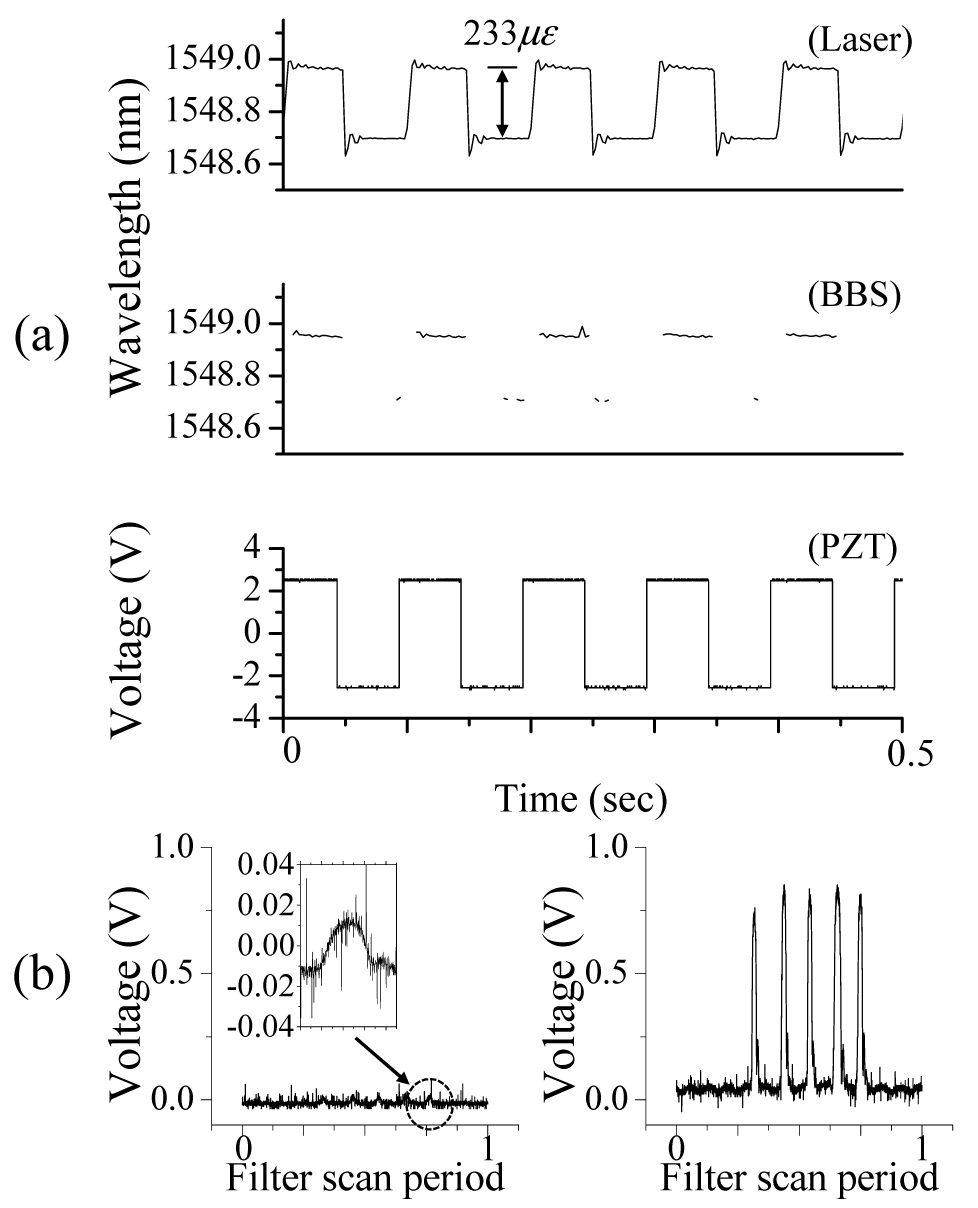
In order to show the capability of dynamic strain measurement,
we attached an FBG sensor to a piece of multi-stack piezoelectric element and applied a 10 Hz square wave voltage which was one of the hardest waveforms for strain sensors to reconstruct. The spectrometer was sampled at 500 Hz of sampling frequency and the reconstructed strain profile is shown in Fig. 7(a). The same strain was also measured with a broadband source instead of the wavelengthsweeping fiber laser. The profile measured with wavelengthsweeping fiber laser reconstructed the applied strain (~233 με peak-peak) very faithfully while the output of the broadband source missed substantial parts. It is because the intensity of the broadband source output is too low for the subsequent peak location process as shown in Fig. 7(b). It is the two Bragg spectra according to the different light sources, clearly demonstrating the advantage of using a laser source. The output of broadband source couldn’t be adjusted better by increasing the integration time of PDA because the background noises are accumulated and easily saturate the pixels.
An FBG sensor interrogation method was suggested by combining a wavelength-sweeping fiber laser and a diffraction grating-based spectrometer. The spectrometer which consists of a volume holographic diffraction grating and a photodetector array enabled linear wavelength shift measurements, regardless of the nonlinearity and the intensity variations of the wavelength-sweeping fiber laser source. The high power density of the laser made it possible to get high signal-to-noise ratio. From the experiments, the suggested sensor system has obtained temperature measurement accuracy less than ±0.2℃.