An ultra-fast generic LC-MS/MS method was developed for high-throughput quantification of discovery pharmacokinetic (PK) samples and its reliability was verified. The method involves a simple protein precipitation for sample preparation and the analysis by ultra-fast generic LC-MS/MS with the ballistic gradient program and selected reaction monitoring (SRM) mode. Approximately 290 new chemical entities (NCEs) (over 10,000 samples) from 5 therapeutic programs were analyzed. The calibration curves showed good linearity in the concentration range of 1, 2 or 5 to 2000 ng/mL. No significant ion suppression was observed in the elution region of all the NCEs. When approximately 300 plasma samples were continuously analyzed, the peak area of internal standard was constant and reproducible. In the repeated analysis of samples, the plasma concentrations and the area under the curve (AUC) were consistent with the results from the first analysis. These results showed that the present ultra-fast generic LC-MS/MS method is reliable in terms of selectivity, sensitivity, and reproducibility and could be useful for high-throughput quantification and other bioanalysis in drug discovery.
Today’s pharmaceutical industry has been able to dramatically increase the throughput of generating new chemical entities (NCE) and large numbers of samples are derived from various
There have been many attempts to develop the high throughput LC-MS/MS methods for DMPK screens. Multi-port autosamplers1, parallel HPLC columns2, multi-channel electrospray source3, and multi-mode ionization source4 have been utilized for these purposes. Recently, ultra performance liquid chromatography (UPLC) has been extensively investigated for rapid chromatographic separation5-8. Different types of analytical columns such as fused-core and porous columns have been used to implement UPLC system with efficiency8-13. Meanwhile, Korfmacher
In this study, in continuation of the ultra-fast generic LC-MS/MS method development for the high-throughput quantification, we developed and optimized more generic and practical ultra-fast LC-MS/MS method with the ballistic gradient. This method was successfully verified and applied to analysis of over 10,000 samples from approximately 290 NCEs.
Compounds were synthesized at LG Life Sciences (Deajeon, Korea). Acetonitrile (HPLC-grade) was purchased from Burdick & Jackson (Ulsan, Korea). Ammonium acetate, formic acid and dimethyl sulfoxide (DMSO) were provided by Sigma Aldrich (St. Louis, MO, USA). Distilled water was purified by Milli-Q purification system (Millipore, Bedford, MA USA).
HPLC was performed using a LC-10ADvp binary pump system (Shimadzu, Kyoto, Japan) and Nanospace SI-2 autosampler (Shiseido, Tokyo, Japan). The analytical columns were a Xterra C18 (50 mm×2.1 mm, 5 μm, Waters, Milford, MA, USA), Hydrosphere C18 (50 mm×2.0 mm, 5 μm, YMC, Kyoto, Japan), Capcell-Pak C18 (50 mm×2.0 mm, 5 μm, Shiseido, Tokyo, Japan). The HPLC mobile phase consisted of (A) ammonium acetate (10 mM) - formic acid (1000:1, v/v) and (B) acetonitrile. A gradient program was summarized in Table 1.
The HPLC system was coupled to an API4000 triple quadrupole mass spectrometer (Applied Biosystems, Concord, Canada) equipped with a TurboIonSpray source. Electrospray ionization (ESI) was performed with nitrogen as the nebulizing, turbospray and curtain gas, with the optimum values set at 60, 60 and 20 psi, respectively. Turbo-gas temperature was set at 600℃ and ESI needle voltage was adjusted to 5400 V. The mass spectrometer was operated with unit (0.7 FWHH) resolution for Q1 and Q3.
>
Standard and sample preparation
Stock solutions of analytical compounds and the internal standard were prepared as 1 mg/mL solutions in DMSO. The internal standard solution was prepared as 100 μg/mL solution in acetonitrile (Solution (A)). The analytical compounds were serially diluted with Solution (A) to 200, 100, 50, 20, 10, 5, 2, 1, 0.5, 0.2 and 0.1 ng/mL solutions containing 100 μg/mL of the internal standard (Solution (B)).
Plasma samples and calibration standards were prepared by protein precipitation. For the calibration standards, 10 μL of plasma was precipitated with 100 μL of the Solution (B), yielding the calibration standards with concentrations of
[Table 1.] Chromatographic conditions for ballistic linear gradient.
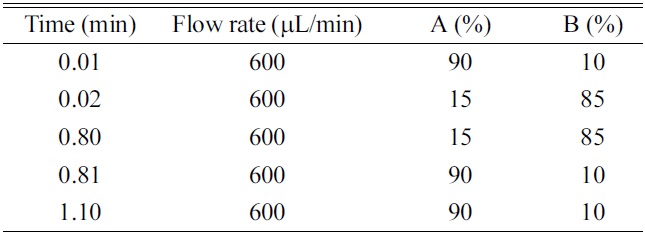
Chromatographic conditions for ballistic linear gradient.
2000, 1000, 500, 200, 100, 50, 20, 10, 5, 2 and 1 ng/mL. The calibration curves were generated by plotting the peak area ratio for the analyte to the internal standard versus the concentrations in the standard spiked plasma samples. The plasma samples were precipitated with 100 μL of the Solution (A). After vortex mixing and centrifugation, 1~5 μL of the supernatant were injected into the LC-MS/MS system.
>
Optimization of sample preparation and analytical conditions
The aim of this study is to develop the ultra-fast generic LC-MS/MS method for the high-throughput quantification of NCEs and demonstrates that the present method is useful for the PK screening of NCEs in the drug discovery.
An initial effort to develop the ultra-fast generic LC-MS/MS method was made to optimize simpler, more rapid, and more practical and generic chromatograph-mass spectrometric conditions. A rapid and simple sample preparation is especially important for high-throughput sample analysis and the reduction of quantification errors. In this study, the plasma samples were simply precipitated with acetonitrile (10 volume) and centrifuged. The resulting supernatants were directly injected into the HPLC system. The volume of acetonitrile for the protein precipitation was optimized to 10 volume by considering the peak intensity, matrix ion suppression and sensitivity.
The use of gradient program is essential to achieve more practical and generic chromatographic condition. When comparing with the isocratic elution, the use of gradient condition has the advantages in terms of the wider applicability of generic chromatographic condition, washing of hydrophobic substances in the column, better peak shape, optimal peak separation from endogenous interferences or metabolites, and the increase of sensitivity by the generation of the narrow peak width. However, the faster re-equilibrium time to the initial condition is critical to achieve the complete gradient condition within the short analysis time. Two approaches can be used to realize the faster re-equilibrium, which are; 1) the minimization of the void volume of HPLC system and 2) the increase of the flow rate. In this study, HPLC system was redesigned by replacing tubing and mixer with the shorter and smaller ones and the flow rate was optimized to 600 μL/min by considering the sensitivity resulting from the concentration dependent mechanism (peak dilution effect) of electrospray ionization, peak width and the re-equilibrium rate to initial condition. As results, the re-equilibrium time to the initial condition was within 0.3 min using the 0.01 min ballistic gradient and 2.0 mm I.D.×50 mm length column. The gradient condition and flow rate are summarized in Table 1. In this study, the initial and final B% of organic mobile phase and the ballistic gradient time was optimized to 10%, 85% and 0.01 min, respectively. Especially, the ballistic gradient time and final B% of organic mobile phase was a prime concern because of the ion suppression, sharp peak shape, peak separation and washing of hydrophobic substances. When investigating the matrix ion suppression effect by the final B% of organic mobile phase, over 90% of organic mobile phase gave rise to serious matrix ion suppression effect under the present 0.01 min ballistic gradient condition. On the other hand, in the condition of final 85% of organic mobile phase, no ion suppression was observed to the elution region of many NCEs and also, it is possible to wash out the hydrophobic substances. When investigating the ballistic gradient time, no improved peak separation effect was observed to 0.1, 0.2 and 0.3 min. When comparing with the ballistic gradient condition of 0.1, 0.2 and 0.3 min, the 0.01 min ballistic gradient with final 85% B of organic mobile phase generated the better peak shape, a narrow peak width and optimal peak elution time.
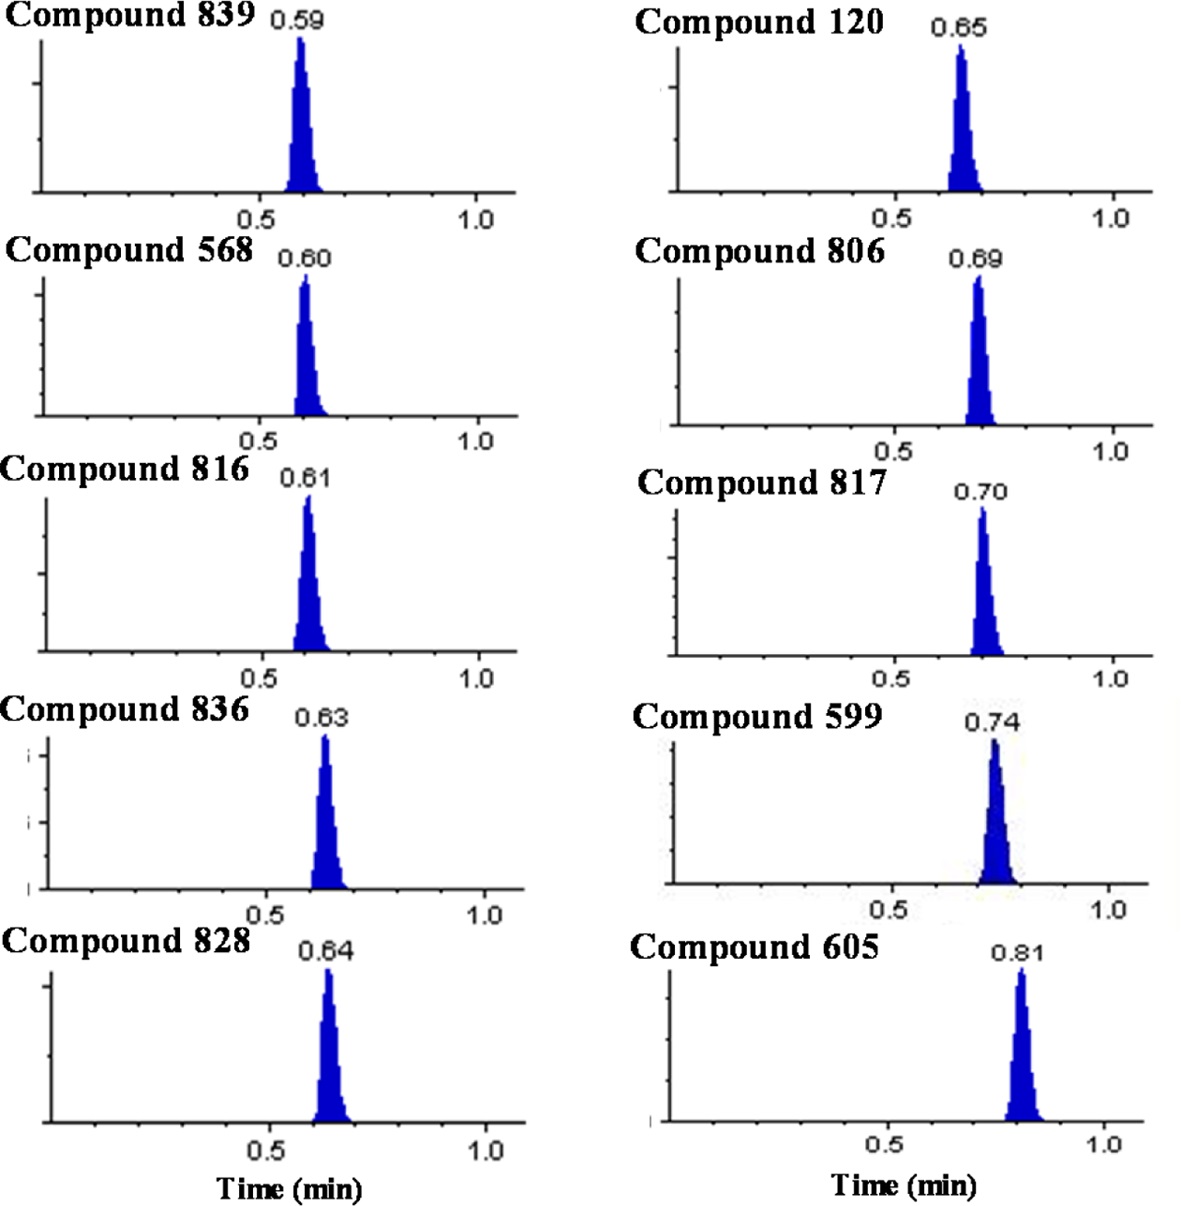
Over 10,000 plasma samples from approximately 290 NCEs were analyzed by the present ultra-fast generic LC-MS/MS method with the ballistic gradient and analysis time of 1.1 min. We were able to achieve a total cycle time of 103 s including the injection cycle time of 37 s and analysis time of 66 s. The representative chromatograms for several selected compounds are shown in Figure 1. The compounds were eluted between 0.35 and 0.85 min with narrow peak width values of 3~6 s. The void time was estimated to be approximately 0.25 min and all peaks were eluted beyond the calculated void time without being eluted in the solvent front.
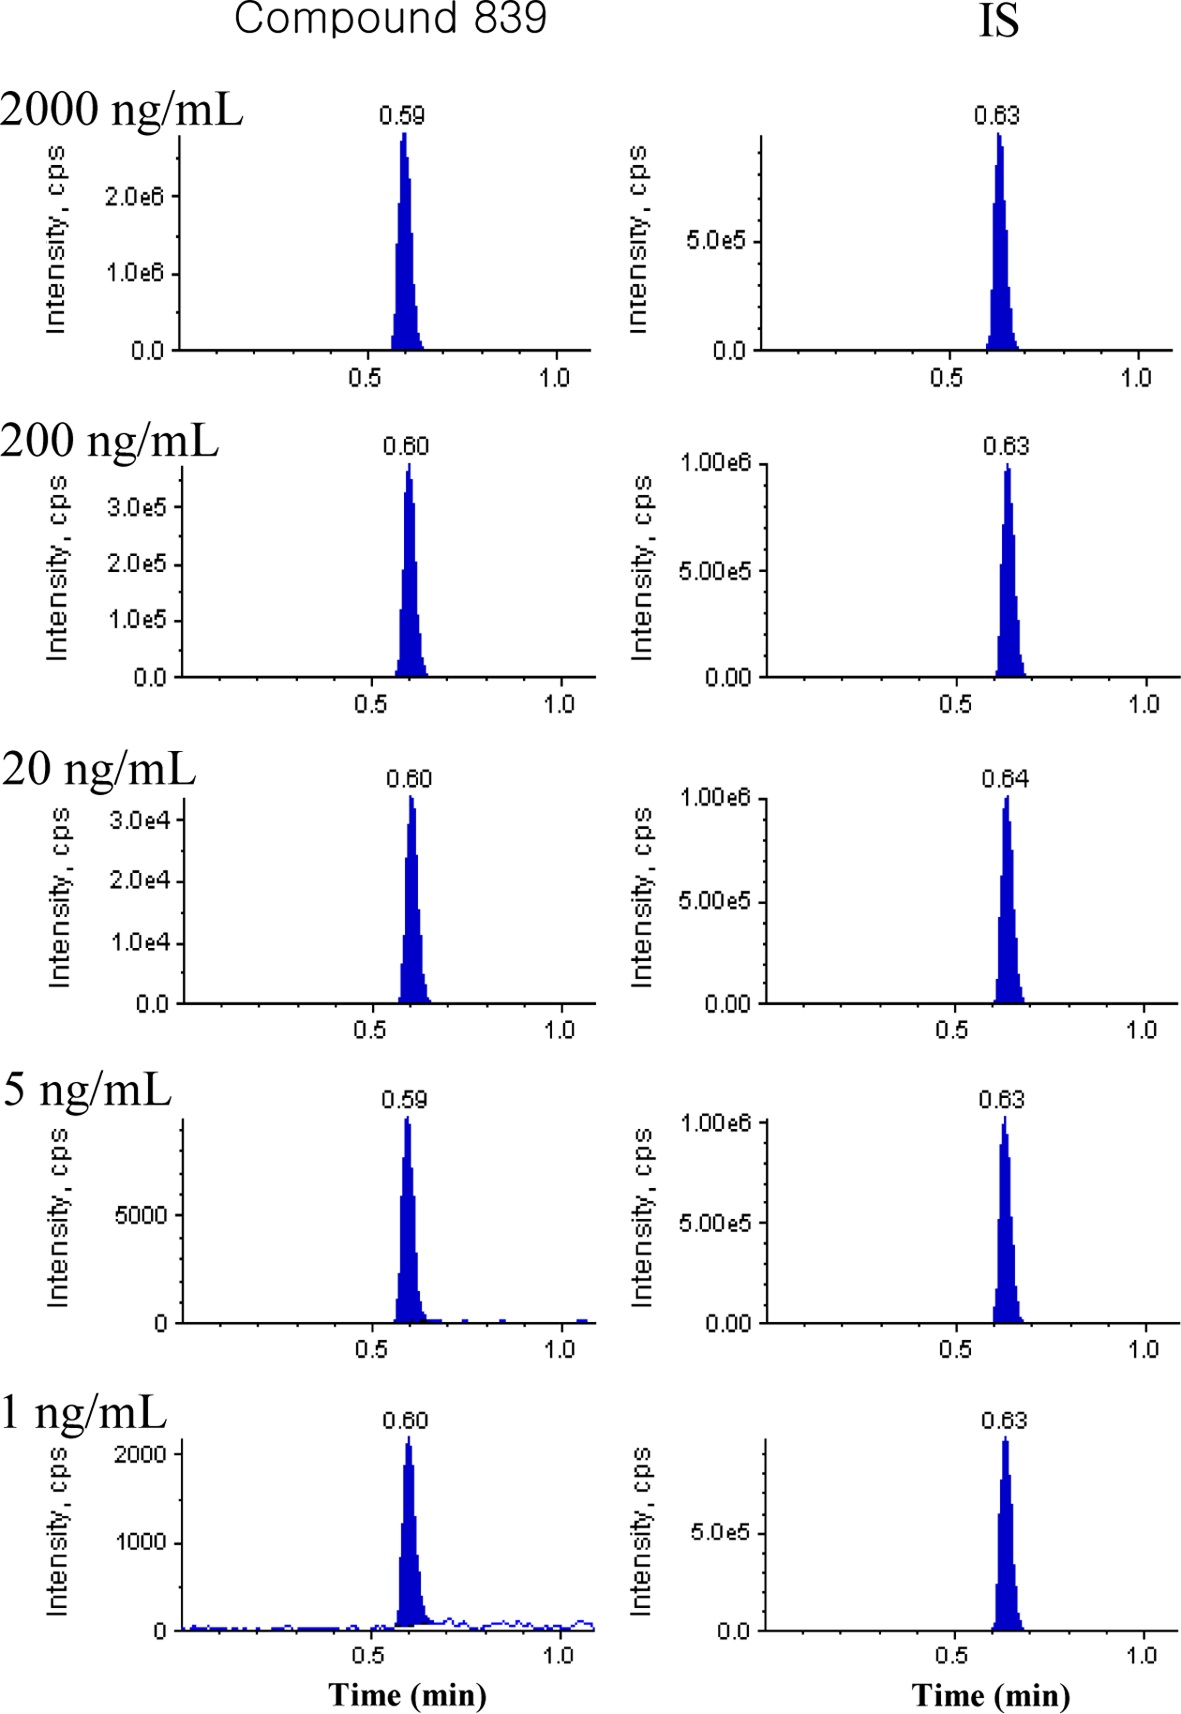
Spiked plasma calibration samples of approximately 290 NCEs (1, 2 or 5~2000 ng/mL) were analyzed and Figure 2 shows the representative chromatograms in the concentration range of 1 to 2000 ng/mL for compound 839. The peak area
ratio of each NCE and its internal standard was fitted to a weightless least-squares model for a calibration curve and the linearity was shown by the correlation coefficient (R2). The linearity of all calibration curves was greater than 0.9 and back-calculated concentrations in the calibration curves were within 20% of the nominal values.
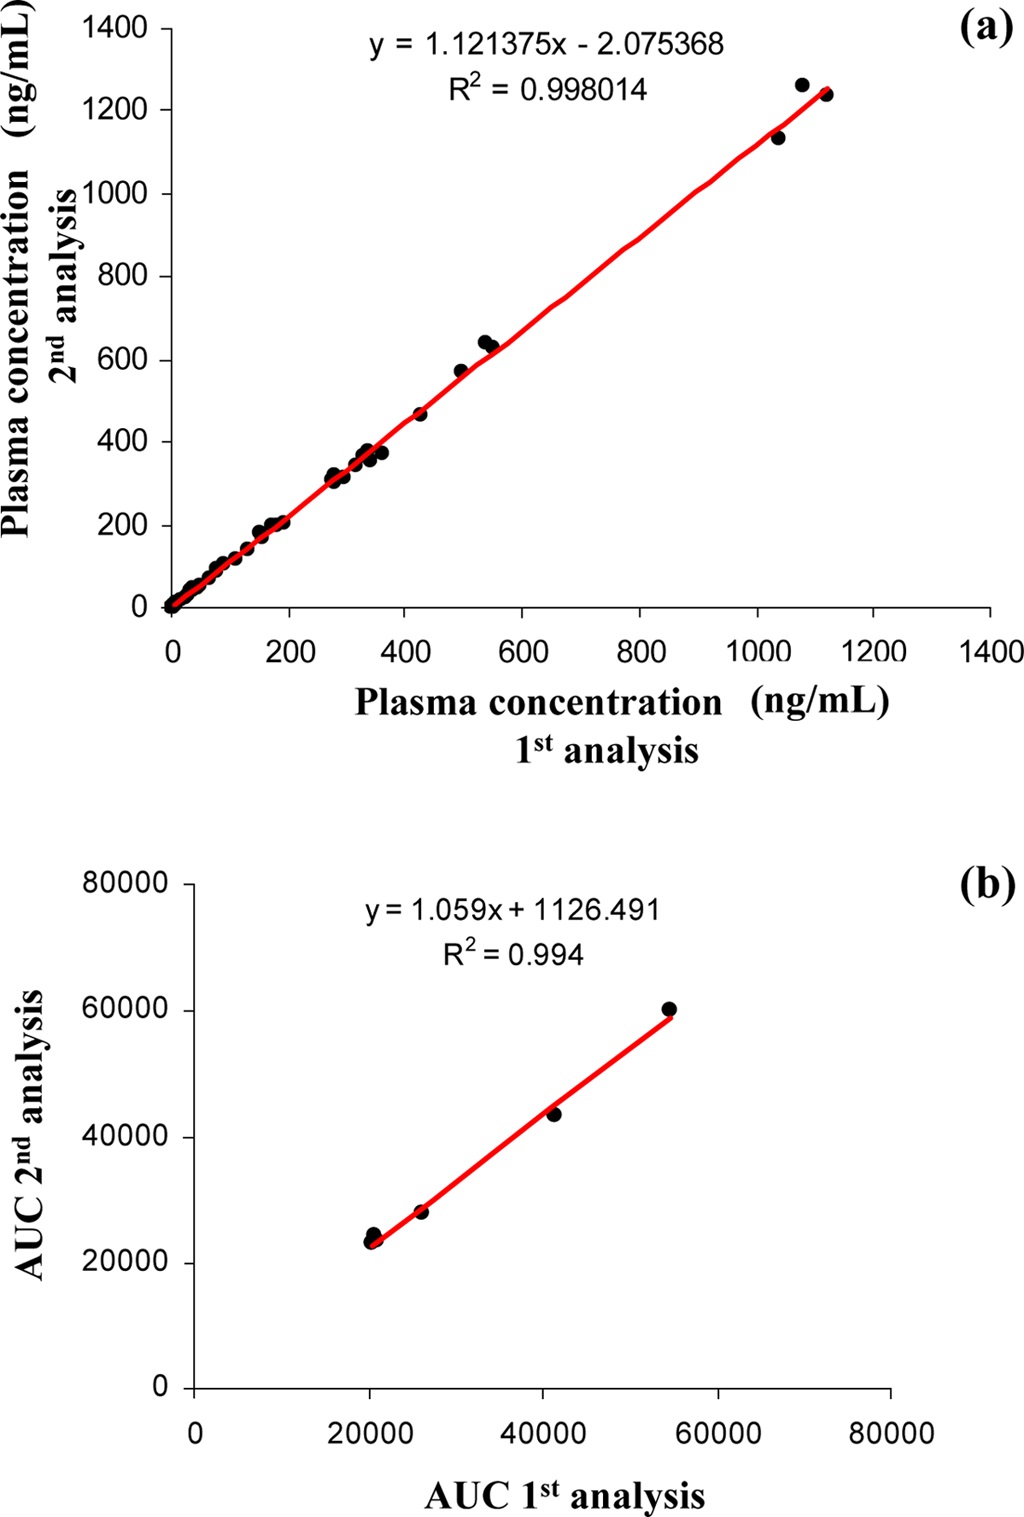
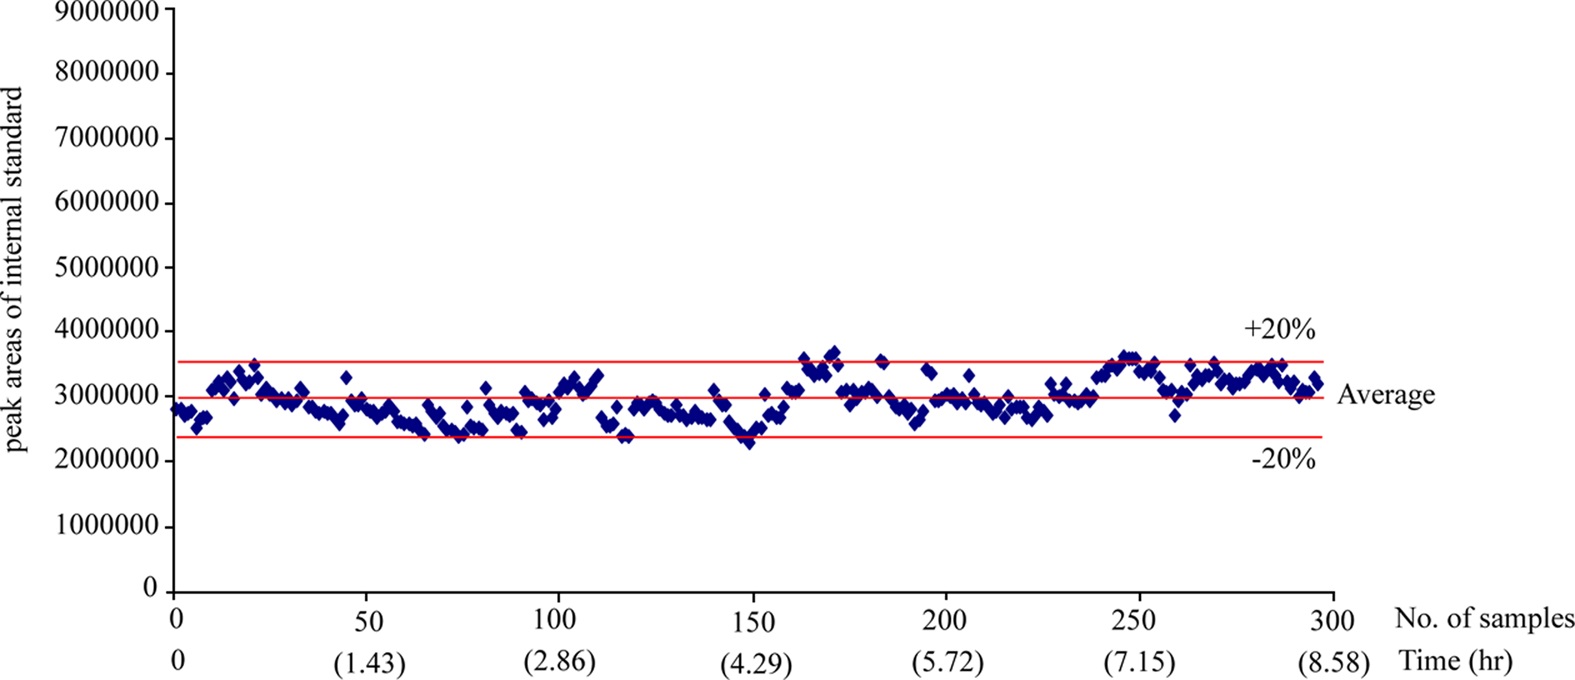
The 300 different PK plasma samples were continuously analyzed to monitor the fluctuation of the peak area. When plotting the peak area values of internal standard in each analysis as shown in Figure 3, all data points were mostly observed within the average ±20% and a drift pattern was not observed during the 300 analyses over more than 8 hrs. In order to examine the reproducibility of the present system, we repeatedly analyzed the PK plasma samples of the selected compound and compared their plasma concentrations and the area under the curve (AUC) values between the measures of repeated inter-day analysis. Figure 4 (a) and (b) represent the correlation plots of plasma concentration values and plasma AUCs in the first-day versus second-day analyses after intra venous (n=3, 8 time points) and oral administration (n=3, 7 time points) to rats, respectively. The concentration profiles of two repeated analyses were almost identical in both intra venous and oral administration data. The correlation coefficients (R2) for plasma concentration and AUC were
both greater than 0.99 indicating a fairly good correlation. These results suggest that the present method is systematically stable and reproducible, and suitable for the high throughput quantitation of NCEs in the drug discovery.
An ultra-fast generic LC-MS/MS method with the optimized ballistic gradient and flow rate was developed and verified for high-throughput quantification of discovery pharmacokinetic (PK) samples. The present ultra-fast generic LC-MS/MS method has been proven to be reliable in terms of selectivity, sensitivity, and reproducibility. This method was successfully applied to analysis of over 10,000 PK plasma samples from approximately 290 NCEs. Therefore, the present method based on generic analytical system seems to be useful for the high throughput quantitative PK screens and other bioanalysis in drug discovery.