Phosphoinositides, the phosphorylated derivatives of phosphatidylinositol (PI) are negatively charged phospholipids. Phosphatidylinositol 3,4,5-trisphosphates, also known as PtdIns(3,4,5)P3s, PI(3,4,5)P3s or PIP3s among the phosphoinositides are the most difficult to characterize due to their presence in low concentration into cell.1-3 Several evidences showed that PIP3s principally were accumulated into cell in response to a variety of stimuli, such as growth factors and oxidative stress, where phosphatidylinositol 4,5-disphosphates (PtdIns(4,5)P2s or PI(4,5)P2s) are phosphorylated at 3 position of the inositol ring by the action of PI3-Kinase.4-8 PIP3s act as an important secondary messenger in incorporating multiple intracellular signaling pathways and in adjusting a large range of cellular activities.2,4,5 PIP3s can activate the downstream signaling events, like cell motility, cell proliferation, cell growth and cell survival via recruiting downstream signaling molecules (PKB/Akt) containing pleckstrin homology (PH) domain.9,10 Several studies showed that natural oncogenic form of PI3-Kinases caused elevation in PIP3 levels, activation of Akt and tumor progression.8,11,12
Some recent studies showed that PIP3s were degraded by the two inositol phosphatases, SHIP (SH2-containing inositol phosphatase, dephosphorylates PIP3 at the 5 position to produce PI(3,4)-P2) and PTEN (phosphatase and tensine homolog, hydrolyzes PIP3 at the 3-position to produce PI(4,5-P2).5,13,14 PTEN (phosphatase and tensine homolog deleted on chromosome ten)/MMAC (mutated in multiple advanced cancers) is a tumor suppressor gene located at 10q2315,16, which encodes a 55 kDa protein composed of 403 amino acids.13,15,16 PTEN protein contains the consensus motif of HCXXGXXR(S/T) found in all protein tyrosine phosphatases (PTPs).5 Studies on tumor cell line showed that certain mutated PTEN induced elevated levels of PI(3,4,5)P3 and of Akt activity13,17,18, and the introduction of wild type PTEN reduced levels of both.18,19 In another study, it was found that PTEN inactivation by oxidative stress also caused an increase in cellular PtdIns(3,4,5)P3 levels.20
Recently, characterization of PIP3s has received great attention in the field of lipidomics due to their involvement in lipid related diseases. There are different methods to identify them in cell extracts including receptor displacement assays, metabolic labeling, and chromatographic separation of the radiolabeled products after deacylation,6,21-23 but these techniques are technically demanding and suffer some limitations. Use of mass spectrometry based lipidomics can overcome these technical limitations and improve the detection process without previous separation through HPLC or TLC because of its high resolving power. Recently phosphatidylinositols were characterized in murine brain extracts using matrix-assisted laser desorption/ionization(MALDI)-time-of-flight(TOF)mass spectrometer(MS).24 Use of electrospray ionization (ESI)-MS also reported for phosphatidylinositol monophosphates (PIPs) and phosphatidylinositol diphosphates (PIP2s) profiling in lipid extracts from cultured cells and rat brain3 and for PIPs, PIP2s and PIP3s in murine macrophage extracts.6
In the present study we searched experimental conditions to characterize molecular species of PIP3s upon expression of PTEN protein in HeLa and HEK 293-T cell lines by using mass spectrometry. We initially found that more than 50 pmol of PIP3s are required for quantitation of them in a mass spectrometry and HEK 293-T cell is proper for study of cellular PTEN on enzymatic behavior in a cell. We recognized that the level of most of PIP3s slightly reduced in HEK 293-T cells expressing of wild type PTEN protein and quantitatively increased in HEK-293T cells expressing of C124S mutant PTEN protein.
Media and reagents for cell culture were obtained from WelGENE Inc. (Daegu, Korea), transfection reagents (Lipofectamine™ LTX and PLUS™ Reagents) and OPTIMEM® I Reduced Serum Medium from Invitrogen (San Diego, CA, USA). HA-probe (Y-11) and PTEN (FL-403) antibodies used as primary antibody in western blot were purchased from Santa Cruz Biotechnology, Inc. (Santa Cruz, CA, USA), BCA kits for protein concentration determination from Thermo Scientific. Standard phosphoinositides (PtdIns-(1,2-dipalmitoyl) (ammonium salt), PtdIns-(3)-P (1,2- dipalmitoyl) (ammonium salt), PtdIns-(4)-P (1,2-dipalmitoyl) (ammonium salt), PtdIns-(5)-P (1,2-dipalmitoyl) (ammonium salt), PtdIns-(3,5)-P2 (1,2-dipalmitoyl) (sodium salt), PtdIns- (3,4)-P2 (1,2-dipalmitoyl) (sodium salt), PtdIns-(4,5)-P2 (1,2- dipalmitoyl) (sodium salt), and PtdIns-(3,4,5)-P3 (1,2- dipalmitoyl) (sodium salt)) and internal standards (PtdIns- (3,4,5)-P3 (1,2-dipalmitoyl)-d62 (sodium salt)) were obtained from Cayman Chemical (Ann Arbor, MI, USA). Plasmid DNA pSG5L HA PTEN wt (ampR) and pSG5L HA PTEN C124S were purchased from Addgene (Cambridge, MA, USA).
>
Cell culture and transfection
HeLa and HEK 293-T cells were cultured in DMEM containing 10% fetal bovine serum, 100 U/mL penicillin and 100 μg/mL streptomycin and maintained at 37℃ in a humidified atmosphere with 5% (v/v) CO2. For a transfection, cells were plated in a 10 cm cell culture dish 24 h before a transfection. When cells were 50% to 80% confluent, transfection was performed using Lipofectamine™ LTX and PLUS™ Reagents with Opti-MEM® I Reduced Serum Medium according to the manufacture’s instruction.
Phosphoinositides were extracted as described1,3,6 and slightly modified. Sample (~107 cells of 2 days after transfection) was transferred into 15 mL polypropylene centrifuge tube. 3 mL of ice-cold chloroform/methanol (1:2) containing 5 ng of internal standard (PtdIns-(3,4,5)-P3 (1,2- dipalmitoyl)-d62 (sodium salt)) was added to centrifuged cell pellets. After vigorous vortexing, the sample was incubated on ice for 15 min. Ice-cold chloroform (1 mL) was added, followed by phase splitting buffer (1 mL of 1.76% KCl, 100 mM citric acid, 100 mM Na2HPO4, 5 mM EDTA, and 5 mM tetrabutyl ammonium hydrogen sulphate, pH 3.6) to induce a phase-split. After mixing, the sample was incubated on ice for 5 min. To complete the phase-split the sample was centrifuged (200 x g, 5 min). The lower, organic phase was transferred into a clean tube. The upper, aqueous phase was reextracted with 2 mL synthetic lower phase (150 μL of water, 2 mL of 0.25 M methanolic acid, 4 ml of chloroform, and 1.5 mL of phase splitting buffer) and centrifuged (200 x g, 5 min) and the resultant lower phase combined with the previous lower phase extract. 0.88% KCl (2 mL) was added to the remaining aqueous phase prior to extraction with 2 mL water-saturated butanol (30 min incubation on ice). The resultant butanol-rich upper phase was combined with the previous lower phase extracts. After drying, the sample was reextracted using 800 μL of chloroform/methanol (1:1) and 500 μL of 0.4% acetic acid. The solvent from the collected lower layer was evaporated in a vacuum centrifuge and resuspended in 50 μL of chloroform/methanol/isopropanol (with ammonium acetate 5mM) (1:2:4).
>
Protein determination and western blot
Protein expression was analyzed by western blotting. A 10 cm culture dish of transfected cells was collected by centrifugation at 500 x g for 5 min, washed with phosphate buffered saline (PBS). After 30 min incubation at ?80℃, the cells were lysed in RIPA buffer supplemented with protease inhibitor and phosphatase inhibitor cocktail 1 & 2 (Sigma Aldrich Korea), and then vortexed for 15 min, and cell lysates were centrifuged at 14,000 x g for 10 min to remove insoluble material. Protein concentration was determined by BCA assay. Protein samples were prepared by boiling lysates in reducing SDS-sample buffer for 5 min. Proteins were separated by 12.5% SDS-PAGE, and blotted to nitrocellulose transfer and immobilized membrane. The blotted membranes were blocked with 3% nonfat dry milk in TBS-T buffer (10 mM Tris, 150 mM NaCl, 0.2% Tween- 20, pH 8.0). The membrane was probed with an appropriate primary antibody for overnight at 4℃ and subsequently probed with secondary antibody for 1 h. Immunoreactive bands were visualized using a chemiluminescence kit from Amershan Bioscience Co. (Piscaraway, NJ, USA).
Mass spectral analysis was performed on SYNAPT® G2 High Definition MS™ System with Q-TOF technology (Waters Corporation, MA, USA). The instrument was equipped with NanoMate (Advion, NY, USA), as an electrospray source. Samples were analyzed at an infusion rate of 20 μL/min in negative ionization mode over the range of m/z 50-1,500. The ion spray voltage was set at ?1.2 kV and the source temperature was 80℃. Data were collected with the MassLynx™ application managers (Waters Corporation MA, USA).
>
PTEN expression on mammalian cells
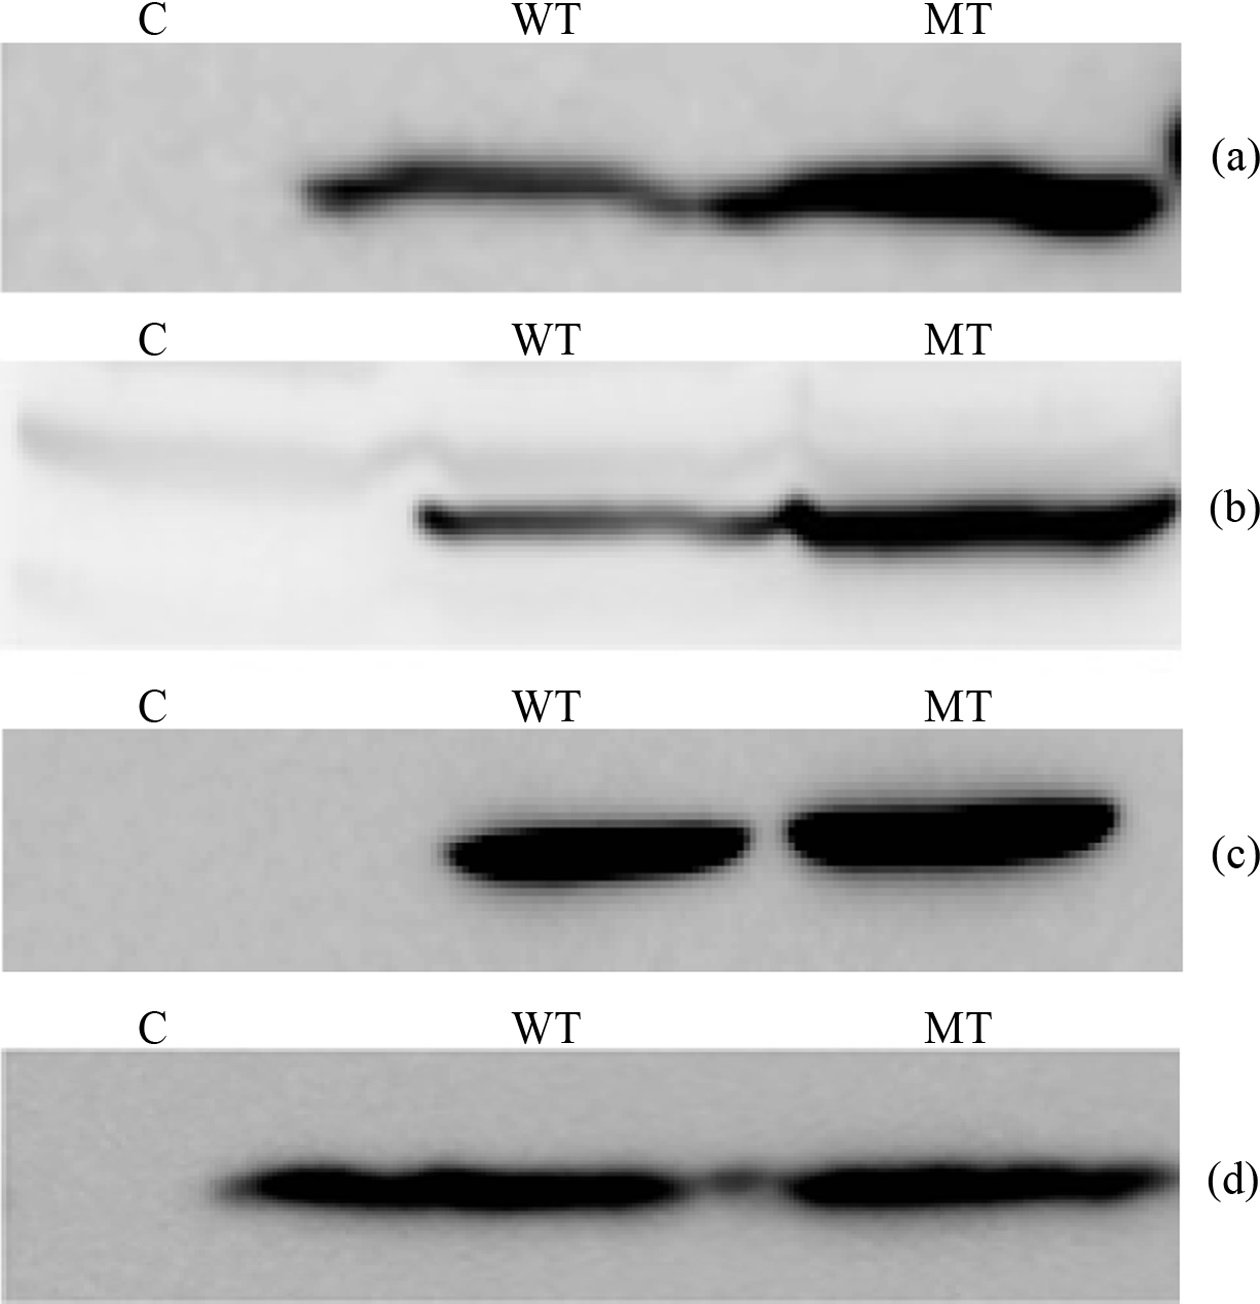
The main target of this study is to measure quantitative variation of PIP3 species which have different combination of fatty acid chain, among the wild type PTEN and mutant type PTEN expressing cells. In this regard we transfected HeLa and HEK 293-T cells with wild and mutant type (C124S) plasmid DNA each. To check the PTEN expression we performed western blotting probing with appropriate antibodies (HA and PTEN antibody) (Figure 1). The western blot images in HeLa cells showed that wild type PTEN expressed a little less than C124S mutant PTEN and transfected PTEN was in a more amount than endogenous
PTEN in both mutant and wild type expressing cells. The western blot images in HEK 293-T cells showed that both
wild type and C124S mutant PTEN expressed in a similar amount and endogenous PTEN was observed in a negligible amount. Based upon the different behavior of PTEN expression between HeLa and HEK 293-T cells, we thought that focusing on the lipidomic analysis of PIP3s in HEK 293- T cells is decent because observing quantitative variation of PIP3s needs measurement in a condition of the same amount of enzyme between wild type and active site mutant.
>
Mass spectrometric analysis of phosphoinositide standards
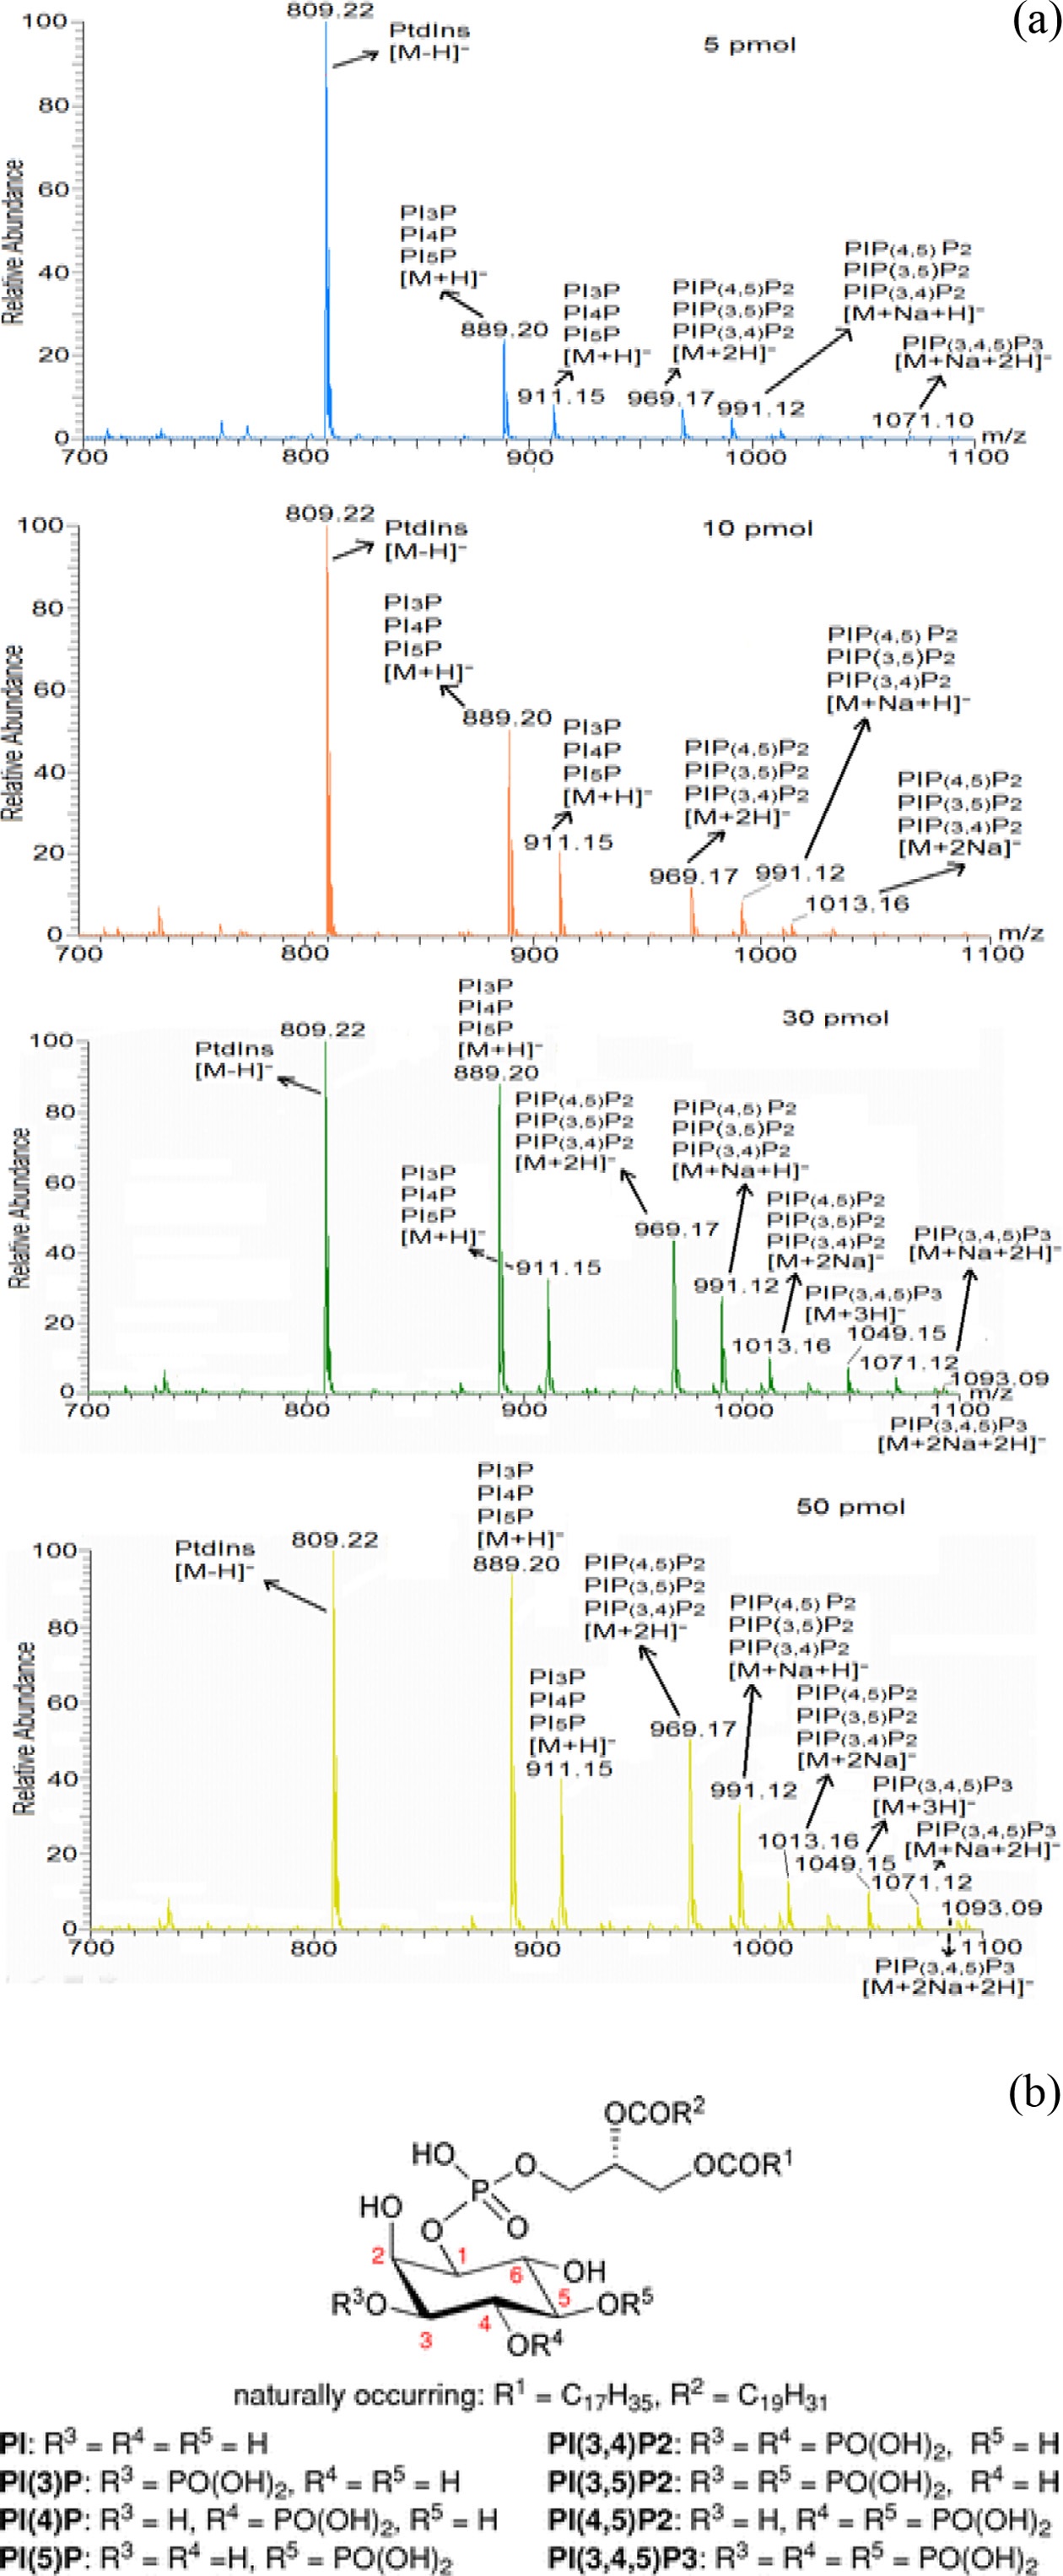
To validate the sensitivity of the mass spectrometer in phosphoinositides’ detection, mass spectrometric analysis of phosphoinositide standards (PI, PIP, PIP2 and PIP3) with different concentration was performed (Figure 2 (a)). The experiment showed the gradual increase of ion intensity of the phosphoinositide standards with their increased concentration. This suggests the lower limitation of detection of PIP3 using the mass spectrometric condition was found to be ≥50 pmol for PIP3. Therefore, we found that required amount of PIP3s extracted from mammalian cells is at least 50 pmol in order to quantify molecular species of them. Based upon this observation, we checked the change of PIP3s’ amount
with different numbers of extracted cells (data not shown) and found that the minimum number of extracted cells is more than 107 so as to quantify the PIP3s. Additionally we provided general chemical structure of phosphoinositides in Figure 2 (b) for clear understanding of their mass spectrum.
>
Mass spectrometric analyses of phosphoinositides extracted from mammalian cells
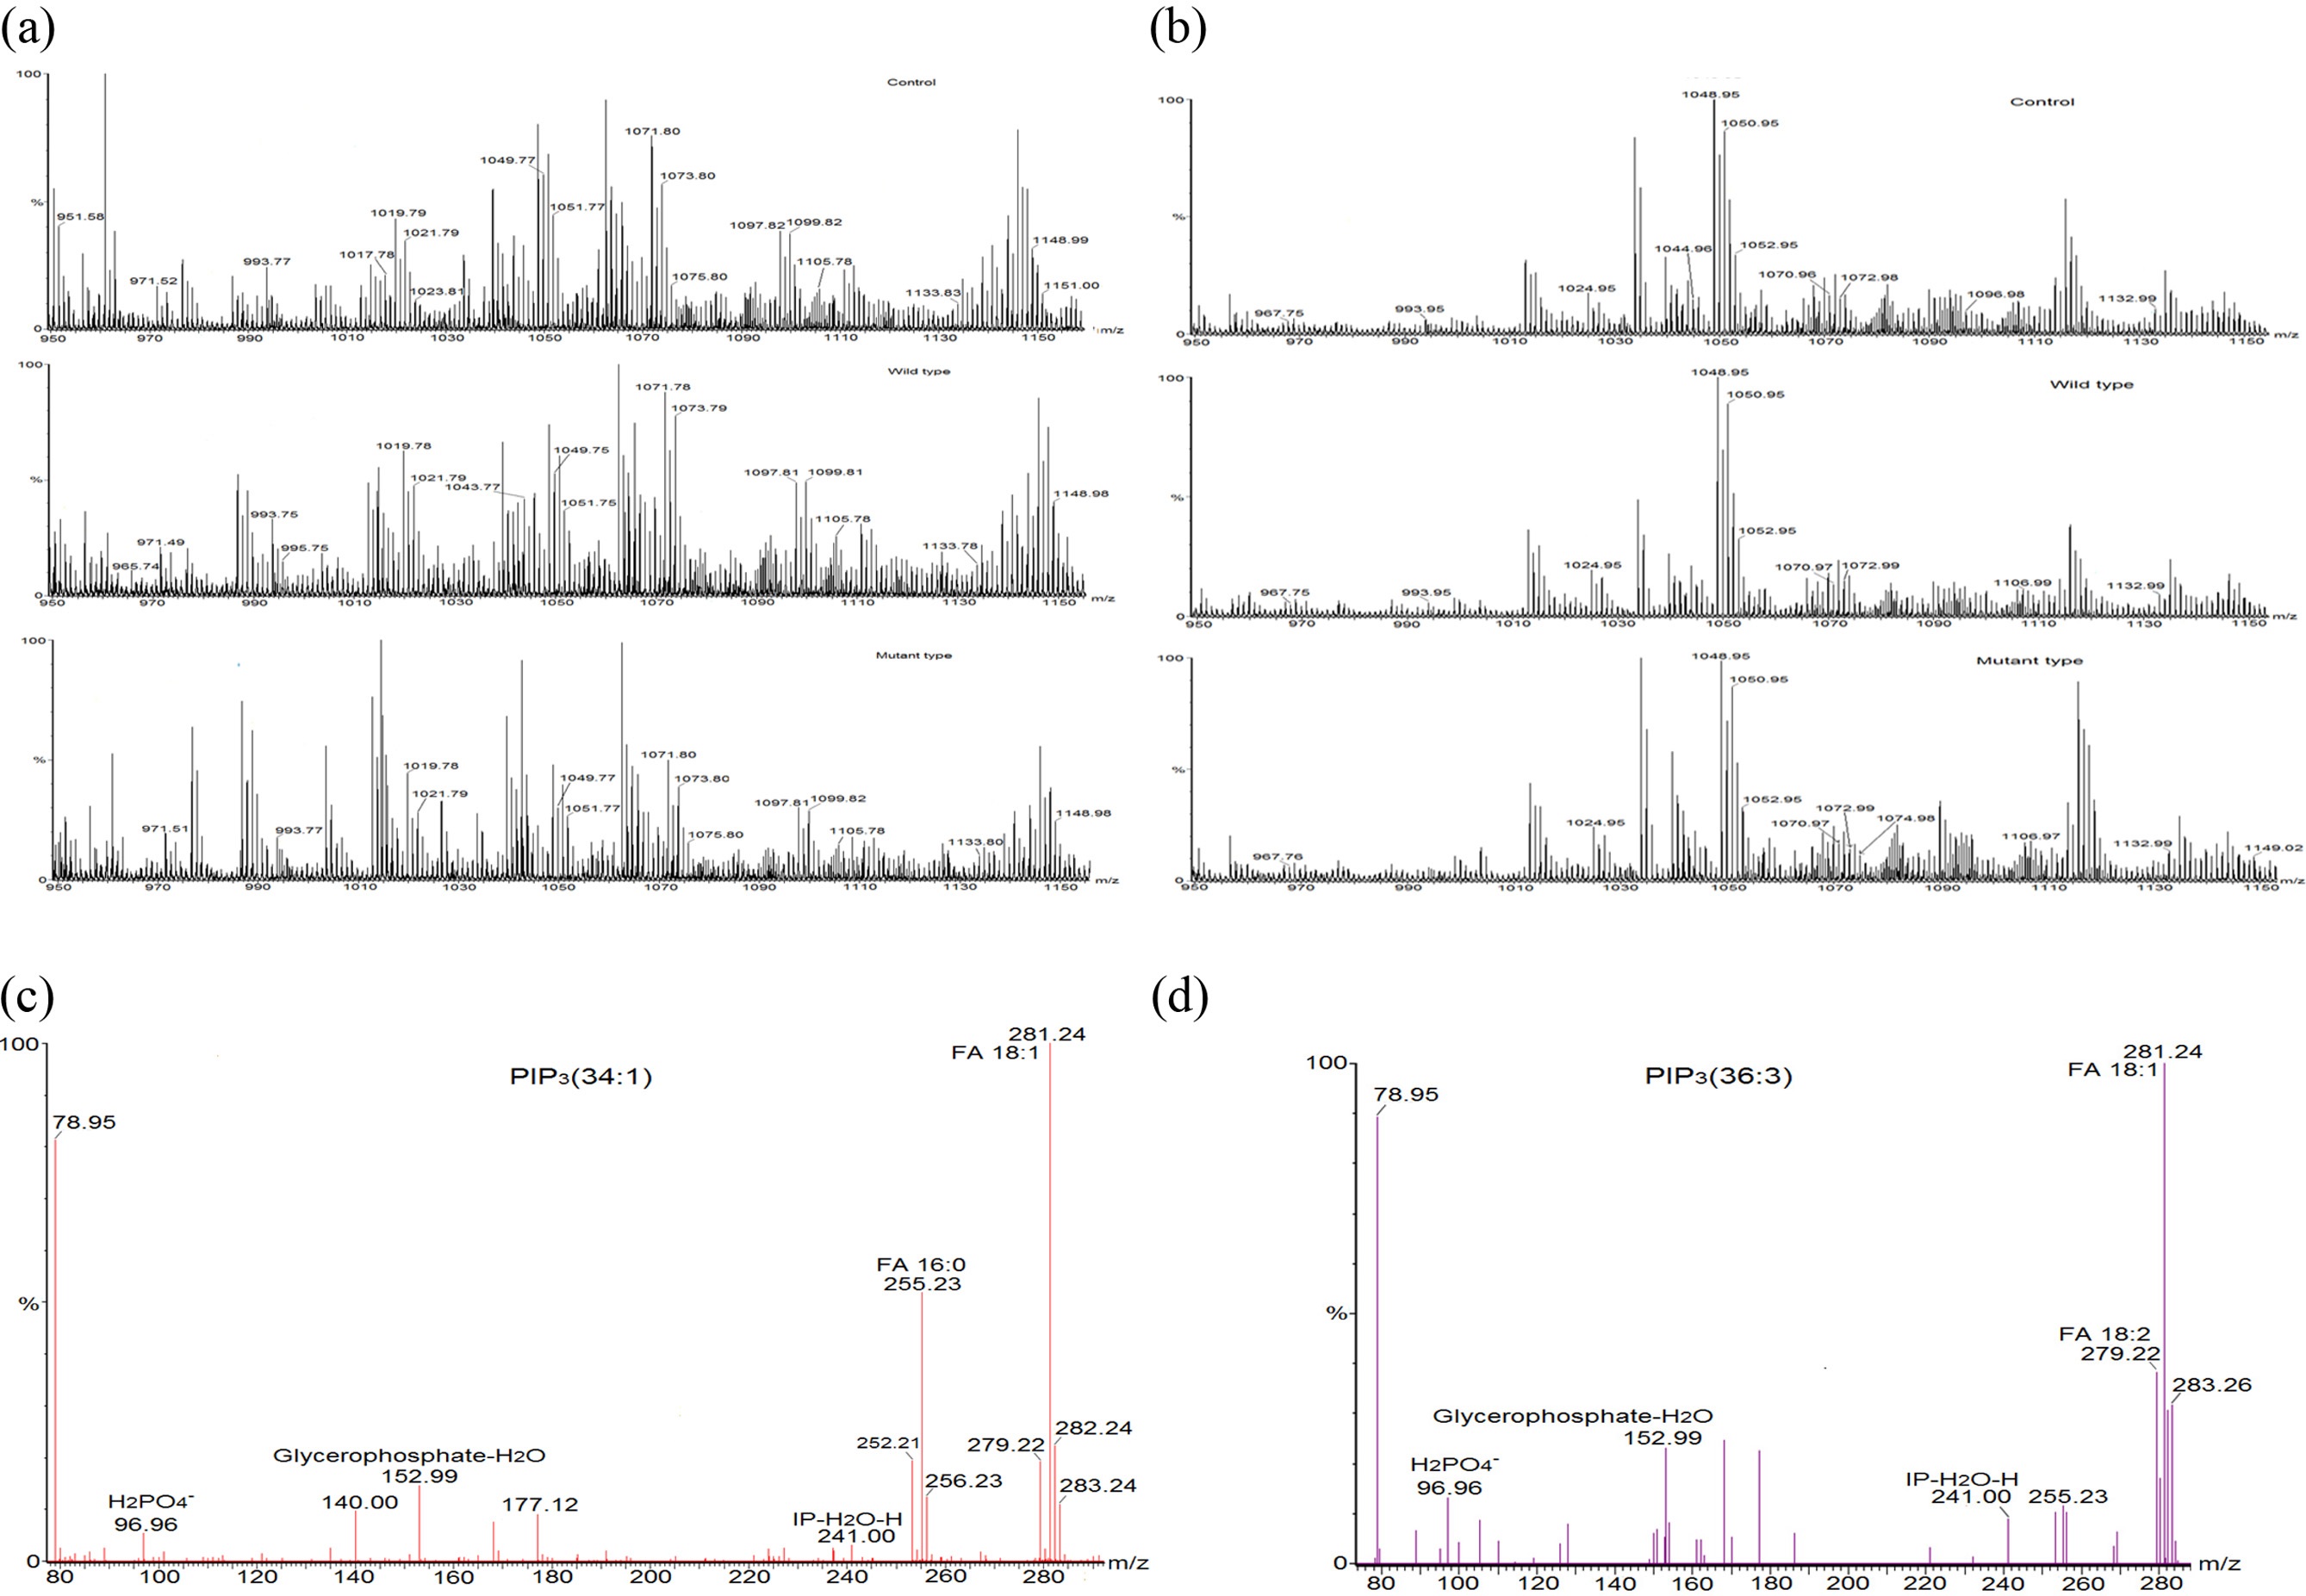
To verify the effect of transfected PTEN on cellular PIP3s, phosphoinositides’ were extracted from the transfected mammalian cell lines (HeLa cell and HEK 293-T cell) and subjected to the mass spectrometry analyses. We followed a 2 step extraction method of PIP3s from cell based on phase splitting using HCl. In order to confirm if PIP3s are extracted in a proper way, we checked recovery amount of PIP3 with PIP3 standard (50 pmol) through extraction process of this experiment and found that more 95% of PIP3 standard was recovered through comparing the intensity of it in a mass spectrum before extraction and after extraction (data not shown). Relatively higher numbers of mass peaks were observed in mass spectrum of PIPs extracted from HeLa cell (Figure 3 (a)) than them extracted from HEK 293-T cell (Figure 3 (b)) due to more complex composition of extracted lipids in HeLa cell line. We tried to identify PIP3s from this mass spectrum through MS/MS analysis, and found that a certain number of PIP3s which further were quantified through internal standard calibration. MS/MS analysis was performed so as to confirm identity and fatty acid composition of PIP3s. MS/MS spectra (Figure 3. (c) and (d)) of PIP3(34:1) and PIP3(36:3) among them of identified PIP3s were representatively presented here. MS/MS analysis of the precursor ion peak at m/z 1075.80 was visibly assigned as PIP3(34:1). Two characterized fragments of the polar head group appeared at m/z 241.00 (inositolphosphate-H2O) and m/z 96.96, which is from the [H2PO4]? anion and one fragment of glycerol part was found at m/z 153.00 (glycerophosphate-H2O). Two fatty acid fragments were identified at m/z 281.20, which corresponds to oleic acid 18:1, and at m/z 255.20, which corresponds to palmitic acid 16:0. Another characteristic phosphoinositide PIP3(36:3) was identified at m/z 1099.82. Three characterized fragments from polar head group and glycerol part were appeared as above. Two fatty acid fragments were identified at m/z 281.20, which corresponds to oleic acid 18:1, and at m/z 279.20, which corresponds to linoleic acid 18:2.
>
Quantitative analysis of PIP3s
Quantitative study of the identified PIP3s using a PIP3 internal standard showed the concentration of PIP3s obtained from both HeLa and HEK 293-T cell in ng of lipid/mg of protein. We identified and quantified 7 PIP3s from both HeLa and HEK 293-T cell (Table 1). In case of HeLa cell, PIP3(34:1) and PIP3(32:0) were found in a higher concentration than other PIP3s, and the effect of both
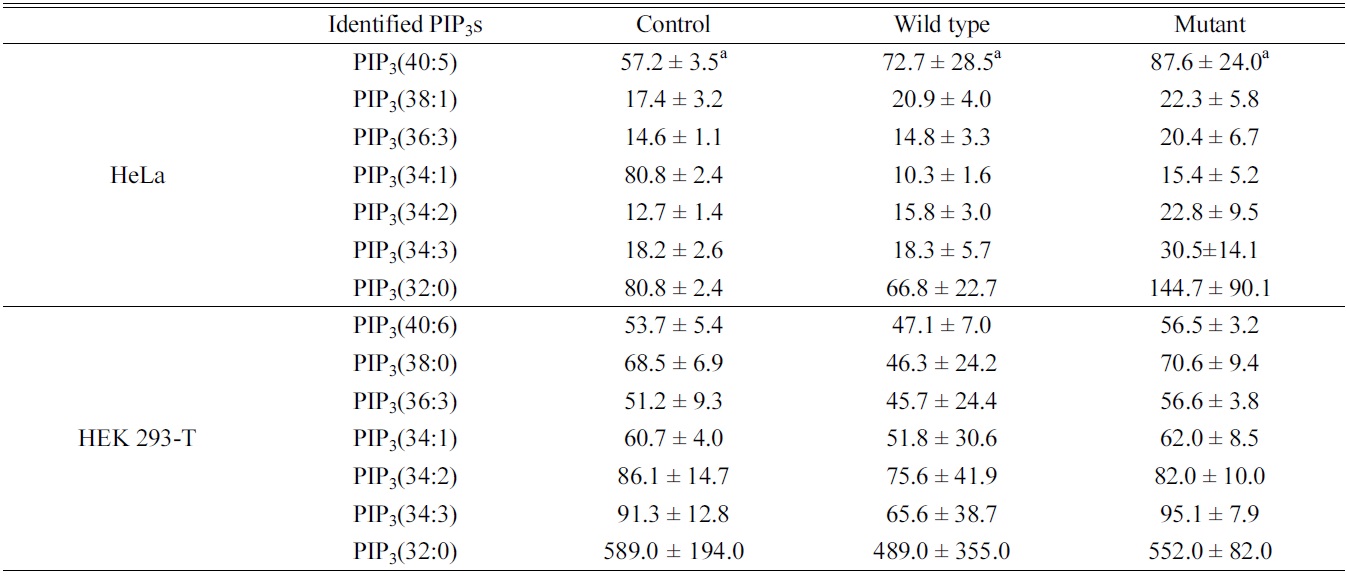
Identified phosphatidylinositol 3,4,5-trisphosphates in HeLa and HEK 293-T cell line upon PTEN expression. a: ng of lipid/mg of protein, represents average ± standard deviation from triplicate experiments
wild type and mutant PTEN expression showed strangely increasing concentration of all PIP3s except PIP3(34:1). This strange behavior might be originated from difficult interference of endogenous PTEN behavior due to complicate circumstance of HeLa cell. In case of HEK 293-T cell, PIP3(32:0) was found in a higher concentration that other PIP3s, and the concentrations of identified PIP3s were higher in mutant type than wild type expressing cells since the functionally active PTEN can convert PIP3 to PIP2 by dephosphorylating at 3 position of the inositol head. Therefore, we conclude that HEK 293-T cell line is an appropriate system to study enzymatic behaviors of PTEN in a cell.
In conclusion, we found that in order to enzymatically study cellular activity of PTEN through mass spectrometry the extracted amount of PIP3s should be more than 50 pmol, which is extracted from more than 107 mammalian cells. Additionally, we found that HEK 293-T cell is proper to see enzymatic manner of PTEN in a cell. These results suggest that several experimentally optimized conditions are required for investigation of cellular PTEN on a catalytic mechanism and a detailed identification of cellular substrates. We will further investigate on more detailed identification of molecular species of cellular PIP3s based upon PTEN enzymatic activity in HEK 293-T cells with these optimized conditions and more experiments. In addition, we will study quantitative change of PIP3s with differently expressed levels of PTEN in mammalian cells obtained through inducible expression system for kinetic study of cellular PTEN.