A shaking motion could be used to improve fish escapement from a cod-end net by creating a sieving effect over the swept volume or by disturbing the optomotor response of the fish. In this study, a perpendicular shaking motion was generated in a towed cod-end net by a circular canvas attached to the end of the codend, which formed a biased cap-like shape. This concept was tested by using a model in a flow tank and by towing a prototype cod-end during sea trials. For the model tests, the amplitude of the shaking motion was 0.6 ± 0.1 times the rear diameter of the cod-end, and the period of the shaking motion was 2.6 ± 0.1 s at a flow velocity of 0.6 or 0.8 m/s. In the sea trials, the amplitude was 0.5 ± 0.2 times the rear diameter of the cod-end, and the period of the shaking motion was 7 ± 4 s at towing speeds of 1.2 or 1.7 m/s. Thus, the shaking amplitude during the sea trials was equal to or less than that observed in the tank tests, and the shaking period was twice as long. The shaking motion described by the amplitude and period could be an effective means to stimulate fish escapement from cod-end during fishing operations considering the response of the fish.
Present methods for fish selectivity or by-catch reduction mainly consist of square-mesh windows and grid systems in the nets, which maintain a constant position determined by the towing speed. These are set using constant visual stimulus or constant flow schemes. A more active procedure (as opposed to increasing the mesh or grid opening) is preferable to reduce the by-catch (Macbeth et al., 2005; World Council of Fisheries Societies, 2012). O’Neill et al. (2003) demonstrated the relationship between cod-end pulsing in the towing direction induced by the vessel motion caused by waves and improved cod-end selection. Grimaldo et al. (2008) reported more escape attempts when the exit square-window netting was slack and fluttering due to turbulence inside the cod-end (Ziembo, 1993; Pichot et al., 2009). Therefore, placing an active stimulating device (ASD, such as a fluttering net panel) within the turbulent flow inside the cod-end (Kim, 2012, 2013) should generate variable visual stimuli (Kim and Wardle, 1998) and flow-related effects for juvenile fishes (Broadhurst et al., 1999).
An active stimulating device inside the cod-end has been used in tank experiments to increase the escape response of juvenile seabream and halibut (Kim and Whang, 2010; Kim, 2011). This device was originally derived from fish observations in the North Sea, where trawling fish escapements were greater when the fish behaved erratically and more approaches were available toward the mesh compared to the case when the fish position was fixed, due to the disturbed optomotor response in the fish (Kim et al., 2008). Jones et al. (2008) also observed that the rate of netting strikes by fish in North Sea trawls was generally higher at faster towing speeds and lower catch densities.
Another passive method for controlling fish catches consists of shaking the cod-end to generate small perpendicular pulses vertically or horizontally, in addition to larger longitudinal pulses (O’Neill et al., 2003). Smaller shaking pulses are sometimes observed in the cod-end due to turbulence caused by the ship’s motion in high seas or high currents, in addition to longitudinal pulsing. Thus, an artificial method to generate this shaking motion could help improve fish escapement through a sieving effect across the swept volume, if the distanced traveled by the net due to the shaking motion is greater than half the cod-end diameter.
A perpendicular shaking motion can be generated in a towed cod-end through an unstable perpendicular lifting force with respect to the drag. In this study, a circular canvas disk was partially attached to the rear of the cod-end, forming a cap, to generate a lifting force. A rear shaking motion was observed, which was controllable by altering the attachment position of the canvas at the rear of the cod-end. Shaking experiments were carried out using a model cod-end in a circulating water channel and a prototype cod-end with a towing frame during sea trials. The characteristics of the shaking motion were measured and analyzed, assuming that the shaking amplitude and period were the main points of the relevant stimulus for fish escapement.
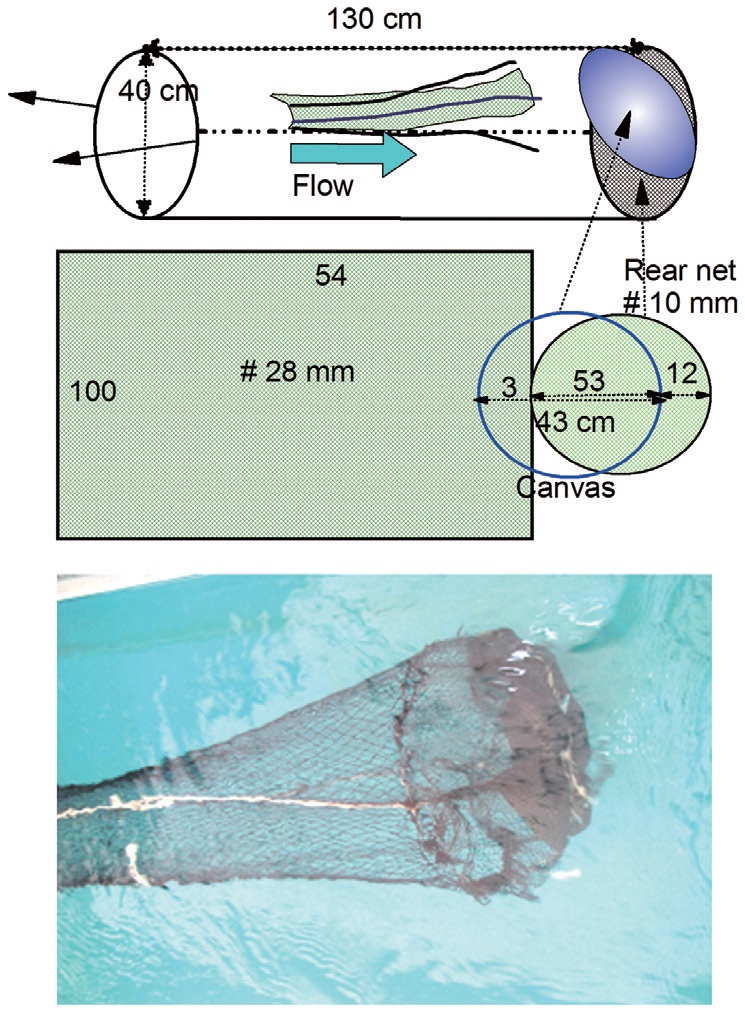
The model cod-end used in the tank experiments had a front diameter of 40 cm with 100 meshes, a length of 130 cm with 54 meshes, and a hanging ratio of 87% from two side twines (PA, braided, Ø3 mm), as shown in Fig. 1. The mesh size was 28 mm (reef knot, diamond mesh) made of PA (Ø0.5 mm). The net was attached with front (Ø40 cm) and rear (Ø38 cm) circular ring frames formed by stainless steel wires (Ø3 mm). The rear round panels were circular with 65 meshes made of 10-mm mesh-size PA Raschel netting (Ø0.5 mm), which was attached at the end ring and formed a cap-like shape.
To generate a shaking motion, a circular canvas (0.3-mm thickness, PP canvas, Ø43 cm) was attached to the rear circular net and side net, with an overhanging portion forming a biased cap inside the rear of the cod-end. A rectangular (60 × 40 cm) fluttering net-panel used as an ASD was made of white PA Raschel net (Ø0.5 mm) with a hanging ratio of
97%, and was attached to the front ends of seven pieces of braided white PA twine (multifilament, Ø3.5 mm, length 70 cm) (Kim and Whang, 2010).
The model cod-end was set up in the outer channel (L 2 m × B 0.8 m × D 0.8 m) of a circular water tank, as described in Kim and Whang (2010). The water flow was regulated by seven vertical rectified plates (L 1.3 m × D 0.8 m; thickness, 1 mm) in front of the observation channel. The mean flow velocity measured by a Nortek Vector velocimeter (Nortek, Norway; velocity sensitivity, 1 mm/s) was either 0.6 m/s when five underwater pumps were used (IPV-835, 220 V, 1 hp; Hanil Electric, Seoul, Korea) or 0.8 m/s when seven pumps were used. The turbulence intensity was 10% at the middle of the observation channel, based on field measurements for shrimp beam trawling or bottom trawling (Kim, 2012, 2013). The tank experiments were carried out using the model cod-end for the following three conditions: 1) without shaking the round canvas at the end of the cod-end, 2) with shaking the round canvas at the end of the cod-end, and 3) using a fluttering net panel as an ASD along with shaking the round canvas. The cod-end motion was observed using underwater video cameras mounted laterally (Simrad OE 1210; Optronics, Oslo, Norway), at the rear (OE1358; DeepSea Electronics, Rockford, IL, USA), and on the top (UWC-150VH-N; Huhu, Bucheon, Korea), and recorded using three video recorders (WR-1000; Samsung, Suwon, Korea).
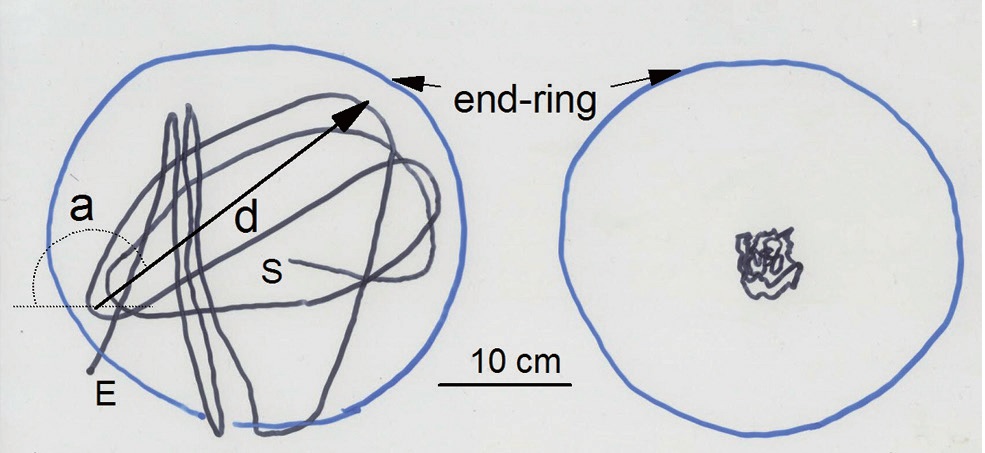
The motion at the center-rear of the cod-end was tracked using an A4-size OHP film based on images from a video monitor (26 inches; Samsung), as shown in the example in
Fig. 2. The distance that the net moved was estimated based on length calibration from the video image (accuracy, 2 mm) using the known diameter of the rear circular ring. The recorded amplitude of the shaking motion was based on the distance that the net moved at the center of the cod-end (position d in Fig. 2). The moving angle was defined as the angle between the left horizontal line and the moving direction (position a in Fig. 2). The period of the shaking motion was

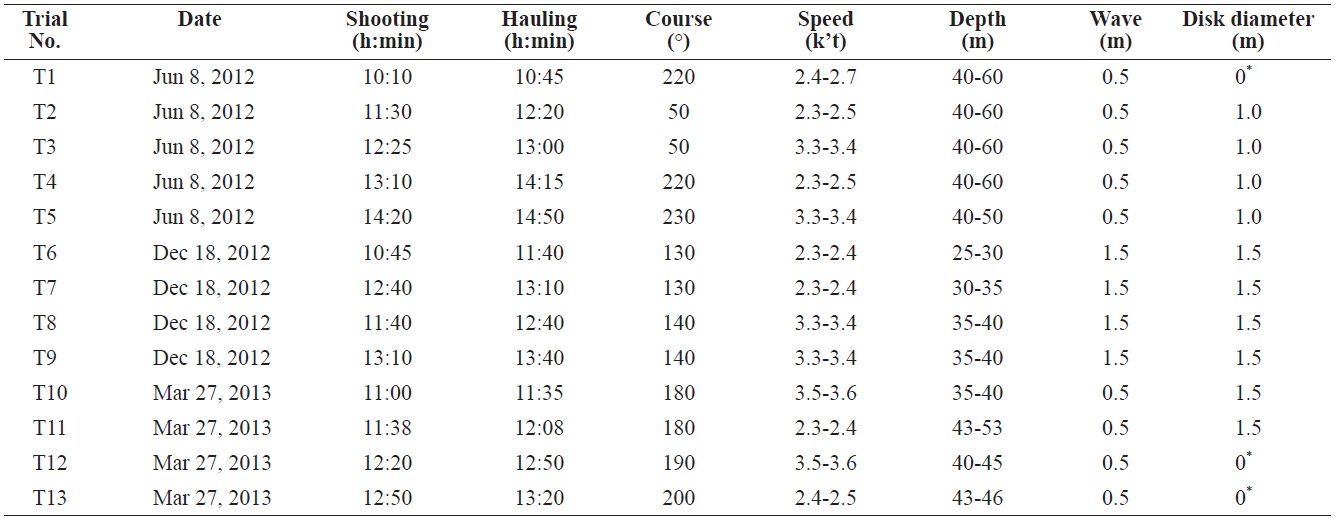
Conditions of the towing experiments with shaking codend except T1 as normal codend without shaking disk
determined within 0.01 s based on the time interval for one oscillation period at the center of the cod-end (position d).
The motion of the fluttering net panel during the shaking motion of the cod-end was defined based on the upper and lower positions of the end of ASD in addition to the upper or lower clearance intervals between the fluttering net and the upper or lower net of the cod-end, respectively, as determined from the lateral images. This motion was also described in terms of its amplitude and period.
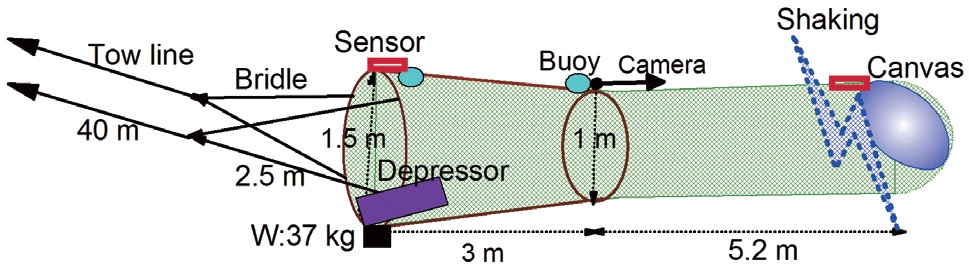
Towing experiments were conducted at sea using a conical towing frame (L 3.0 m × D 1.5-1.0 m, constructed from 10-mm-diameter stainless steel rods), with the cod-end fitted as described by Kim and Jang (2005) (see Fig. 3). Lead weights (0.85 kg × 26 pieces = 22.1 kg underwater) and spherical iron bobbins and shackles (5 kg × 3 pieces = 15 kg underwater) were attached at the lower front ring of the frame, and oval buoys (diameter, 13 cm; length, 15 cm; 1.1 kg 4 pieces = 4.4 kg buoyancy) were attached along the top of the frame. Additionally, two iron square panels (thickness, 1 mm; L 50 cm × B 45 cm) were attached to the lower front frame with a tilt of 15º as depressors, to maintain a stable towing depth.
The experimental cod-end was constructed from a 60-mm diamond mesh using PE 135-ply twine. The cod-end perimeter consisted of 100 meshes laced onto a front stainless steel ring (1.5 m diameter) through the end ring (1.5 m diameter) of the stainless frame. The net was 3.0 m in length, and extended 5.2 m with 100 meshes around the circumference. Thus, the total length of the cod-end was 8.2 m of PP rope (Ø 10 mm). The end of the cod-end was fixed with a serving wire ring (Ø10 mm) to provide an overhang and form a cap-like shape when it was towed underwater. To generate the shaking motion, a round piece of canvas (thickness 0.5 mm, acrylic canvas, Ø1.0 and 1.5 m) was attached to the rear of the cod-end, with an overhang that formed a half sphere. Two mini depth meters (DST-tilt sensor; Star-Odi, Reykjavik, Iceland; diameter, 15 mm; length, 46 mm; weight in water, 12 g; depth sensitivity, ±0.4%; tilt accuracy [yaw, pitch, roll], ±1°; temperature accuracy, ±0.1℃; sampling interval, 1 s) were attached to the top front ring of the frame and the top of the end wire ring of the cod-end. The depth values of the two sensors were calibrated from the surface to a depth of 60 m. The shaking motion was detected from the depth difference between front and rear of the cod-end for vertical motion, and from the tilt difference for diagonal motion. The shaking motion at the rear of the cod-end was also observed using an underwater video camera (UWC?150VH-N; Huhu) and a video recorder (WR-1000; Samsung).
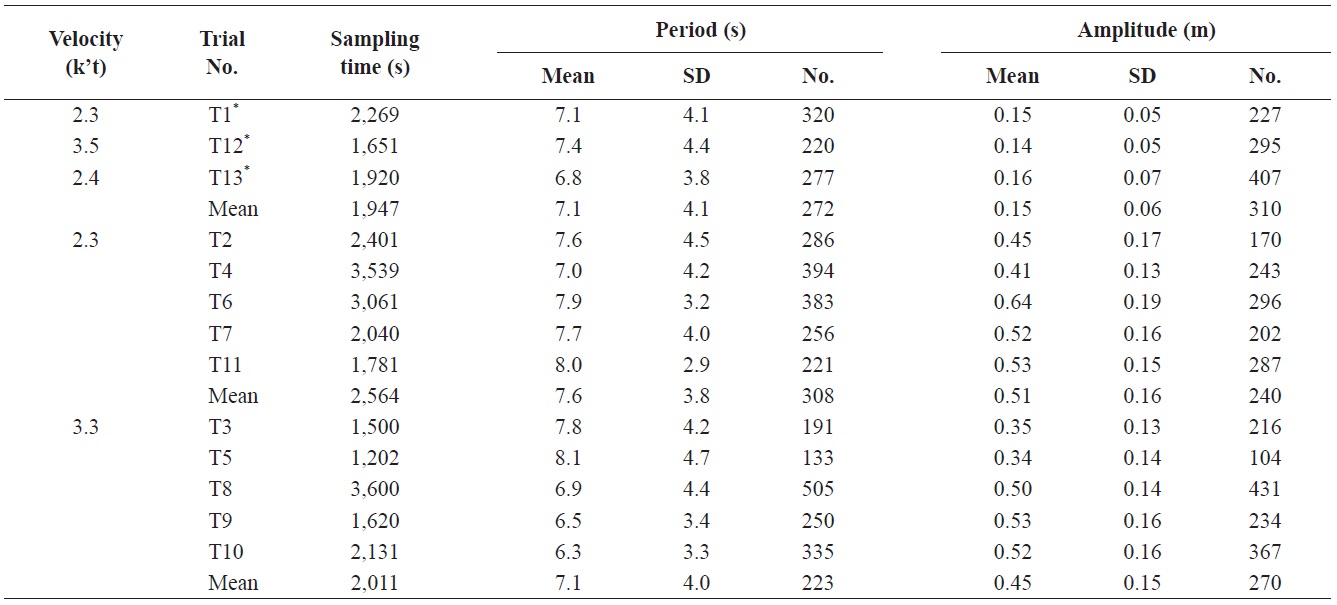
Towing trials were carried out 13 times in the Chudo-Yokjido area, southwest of Tongyoung, using the research vessel Charmbada (36 G/T, 300 HP×2) owned by Gyeongsang University on July 18, 2012, December 18, 2012, and March 27, 2013, as listed in Table 1. Towing speed was measured using a ship Doppler log (ds-80; Furuno Electric, Nishinomiya, Japan). Two speeds were considered: the slower one used one screw, and the faster one used two screws at the minimum number of engine revolutions per minute. Two tow lines (40 m, made of PP, Ø12 mm) were attached at the stern of the vessel, separated by 3.9 m.
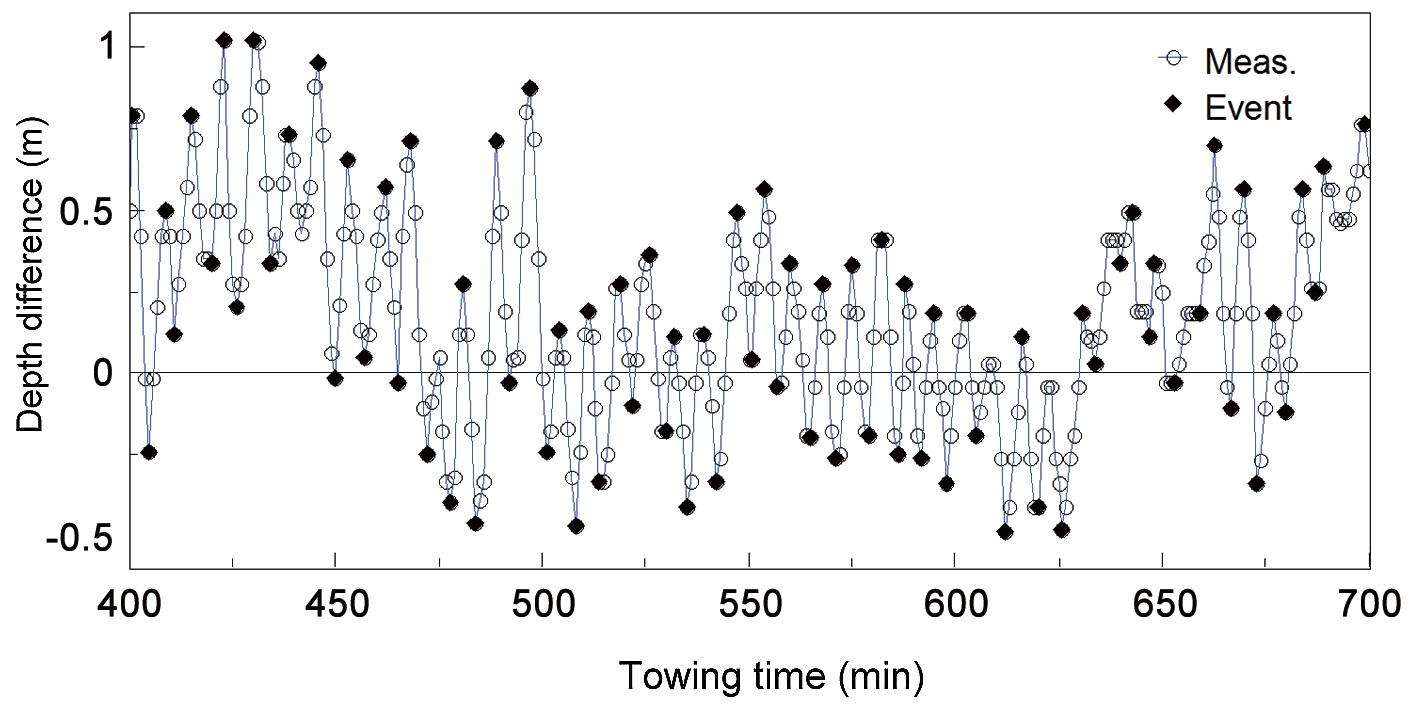
The depth data obtained from the depth sensor memory were processed to yield the depth difference between the front and rear of the cod-end every second. Next, a time series of the depth difference was analyzed based on a fast Fourier transform (FFT) and a Mexican hat (mexh) wavelet analysis (Narasimha et al. 2007) using MATLAB software, as well as period estimations from global wavelet methods using software developed by Torrence and Compo (1998). However, the above methods cannot calculate shaking amplitude as the depth changes, and they are also unsuitable for wide ranges of periodic data. Therefore, an event analysis method based on the peak and valley values obtained from the depth difference data was applied, using in-house software developed based on the work of Narasimha et al. (2007). When the depth increased until the peak value and then decreased, that peak value was identified as a positive peak value, while the opposite was identified as a negative valley value. Fig. 4 shows an example of the results obtained using our event analysis method. The minimum time interval between peaks or valleys was restricted to more than 3 s, and the threshold between peaks and valleys was the mean value ± a standard deviation of 0.5. The mean period was estimated from the average of the total number of intervals between peaks and valleys, while the mean amplitude was estimated from the depth differences between peak and valley events
that occurred consecutively as pairs.
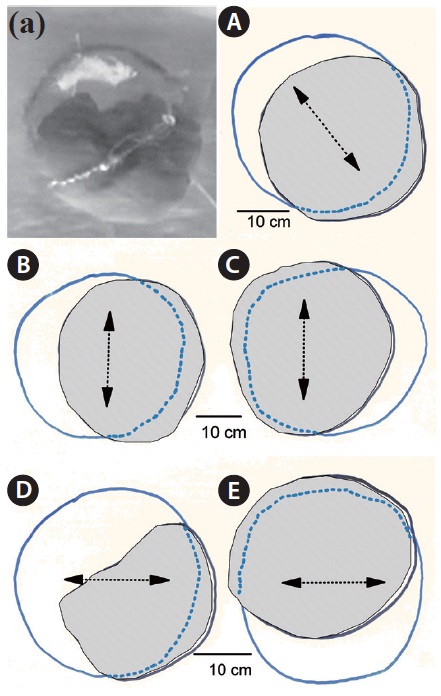
Fig. 5 presents the shaking motion of the cod-end due to the oscillating cap-like canvas. The motion at the center-rear of the cod-end (with and without the oscillating canvas) was previously presented in Fig. 2. As shown in Fig. 5, the moving angle of the shaking motion varied by the position of the oscillating disk at the rear of the cod-end, and was categorized as mainly horizontal, vertical, or diagonal. Vertical shaking motion was observed when the oscillating canvas was attached to distort to the left or right, while horizontal shaking motion was observed when the oscillating canvas was attached to distort upwards or downwards. A diagonal shaking motion was observed when the oscillating canvas was attached to distort in a diagonal direction.
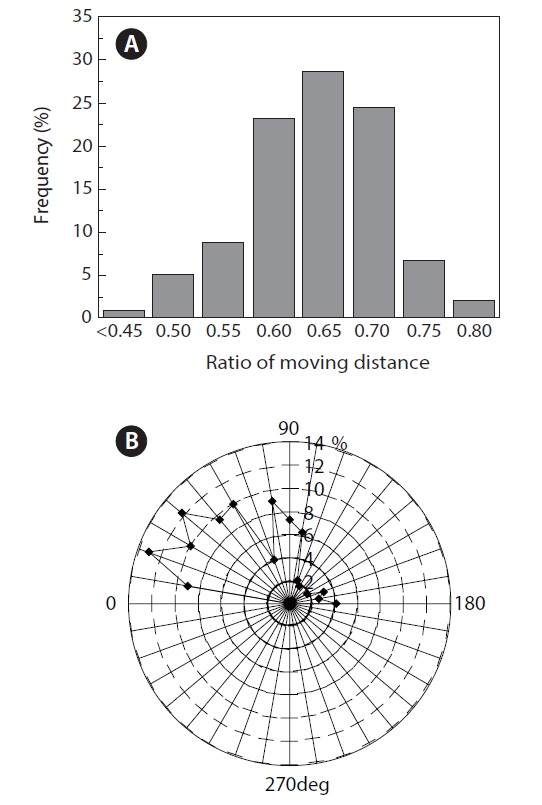
The moving distance, moving angle, and period of the shaking motion were irregular with time due to the turbulent flow and unevenness of the position of the oscillating disk. For example, the ratio of the moving distance to the diameter of the rear cod-end ring,
The main features of the codend motion without shaking canvas as steady case (S) and with shaking canvas by shaking direction from Fig. 5A through 5E
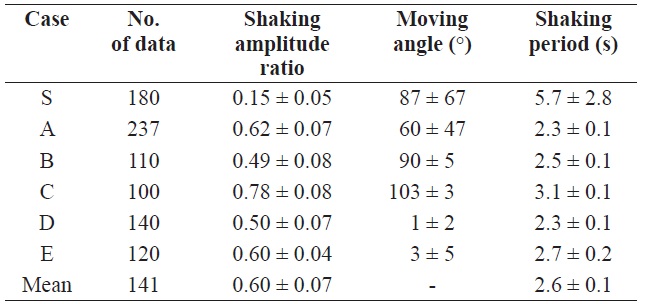
diagonal shaking in Fig. 5A, is shown in Fig. 6A, and the effect of changing the upper moving angle by 10° is shown in Fig. 6B for a total of 237 periods. The moving distance and moving angle followed a normal distribution, except the moving angle did not have a normal distribution during diagonal shaking. The main features of the shaking motion of the cod-end, shown in Fig. 5, can be described in terms of the variation in the moving distance and moving angle with the period, as shown in Table 2.
The shaking amplitude ranged from 50-80% of the rear diameter of the model cod-end, and the shaking period ranged from 2.3-3.1 s in all cases. The amplitudes of cases C and E were larger than those of cases B and D, while the periods of cases C and E were longer than those of cases B and E, respectively. A weak but significant relationship was observed between amplitude and period (
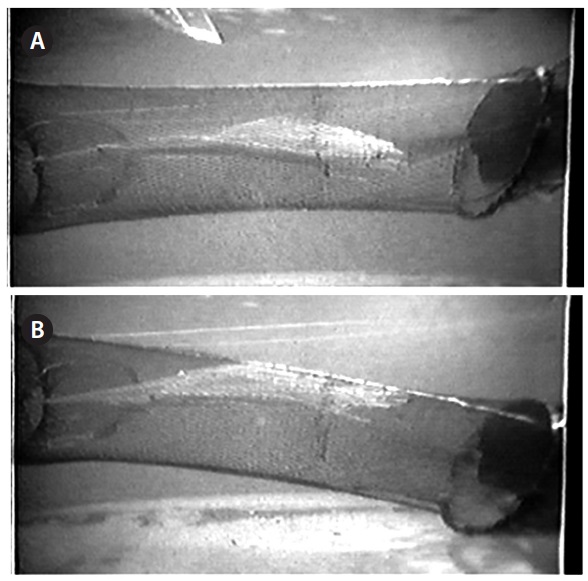
The vertical shaking motion caused by both the oscillating canvas and the fluttering net panel was well represented in the lateral view of the cod-end, as shown in Fig. 7, which indicates the upward and downward motion. The fluttering net panel reached the upper panel of the cod-end in Fig. 7A, while a small clearance appeared between it and the lower
panel of the cod-end in Fig. 7B due to the difference in the shaking amplitude and period. Table 3 lists the clearance and amplitude of the fluttering net panel, and the amplitude of the shaking motion of the rear of the cod-end, for both vertical and horizontal shaking motions.
The upper and lower clearances of the fluttering net panel were smaller at a flow velocity of 0.8 m/s compared to 0.6 m/s, but the amplitude of the fluttering net panel and the shaking motion of the rear cod-end were larger (
[Table 3.] Main features of shaking motion of the codend with fluttering net panel
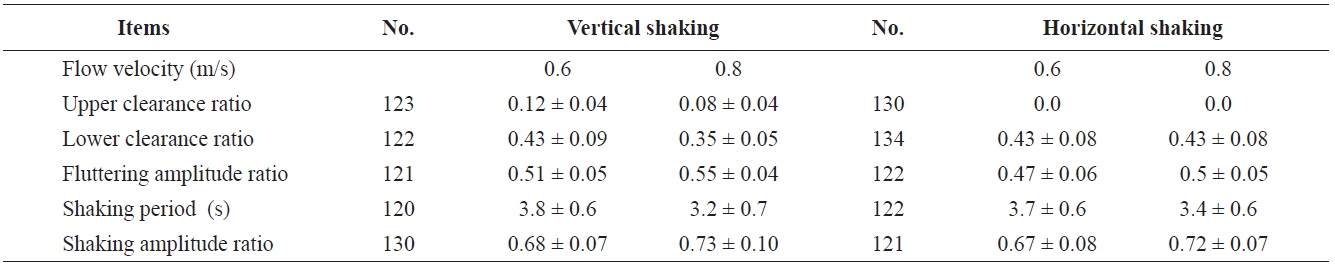
Main features of shaking motion of the codend with fluttering net panel
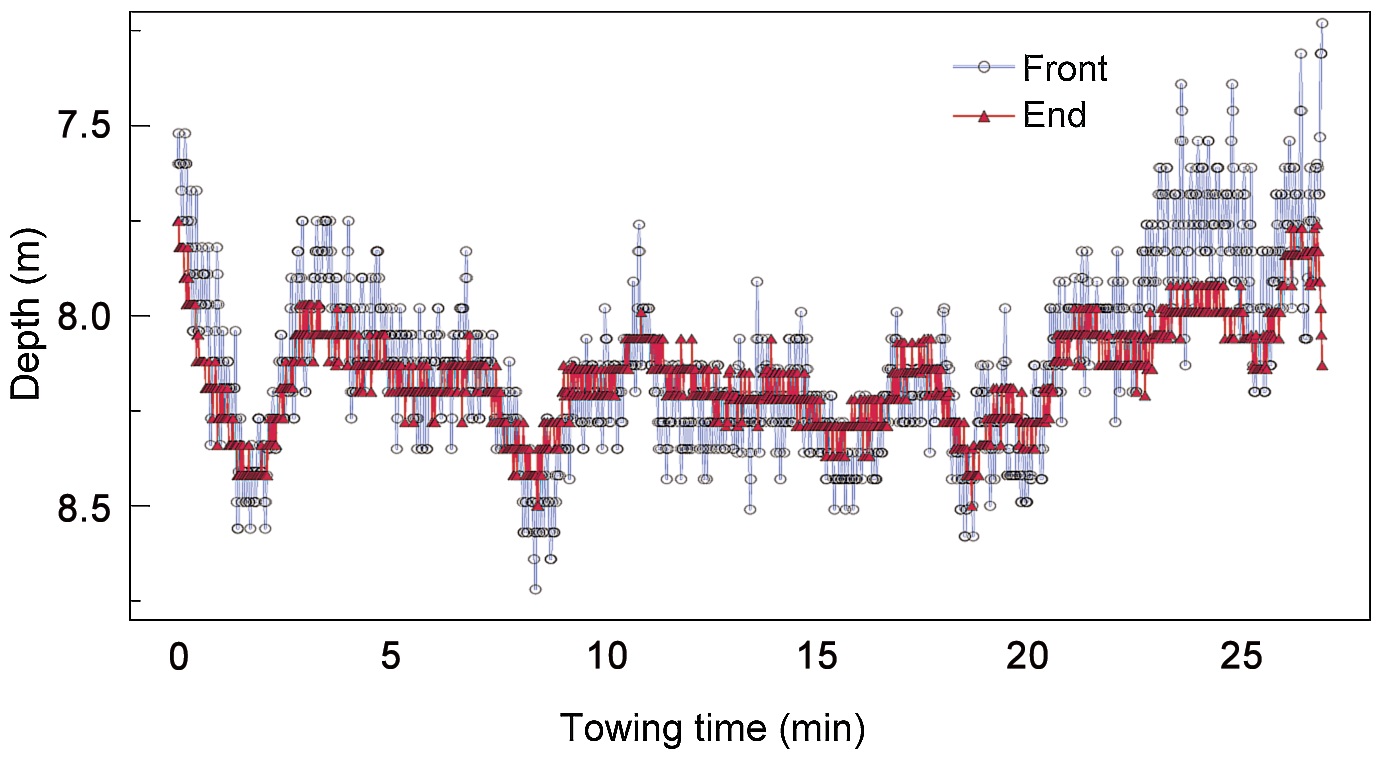
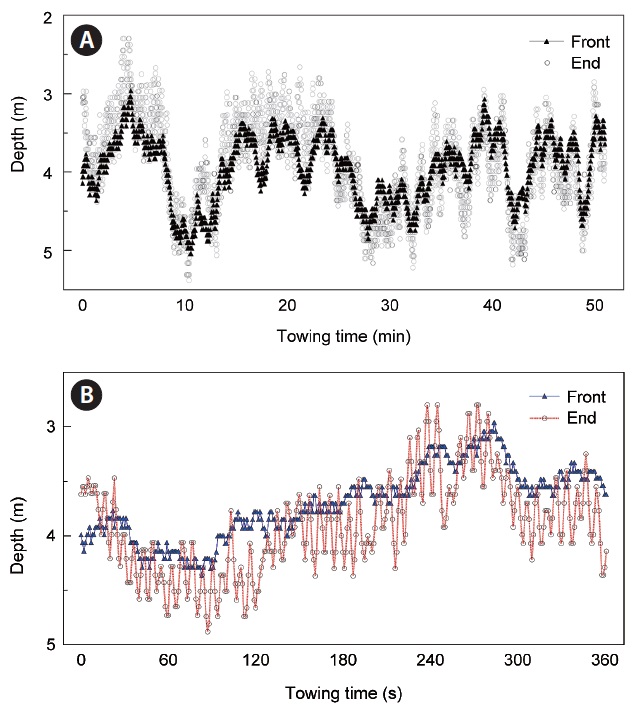
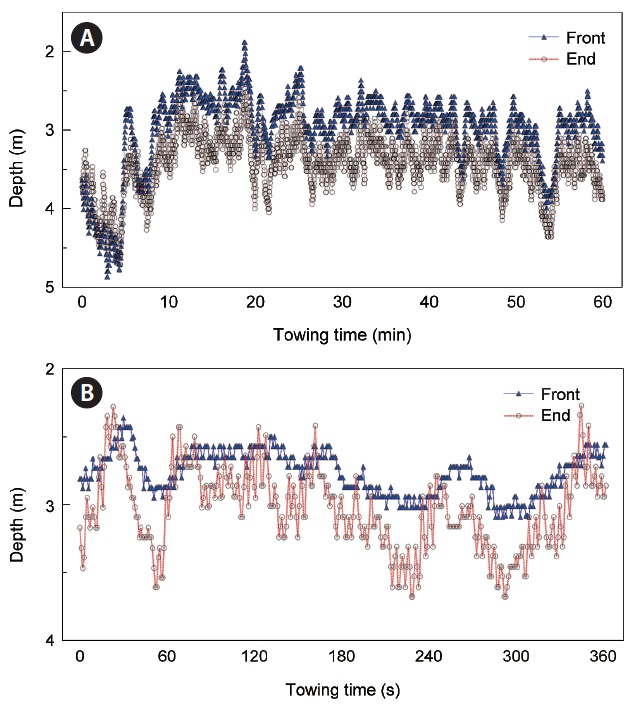
Figs. 8 and 9 present the changes in depth at the front and rear of the cod-end over time during the field towing experiments for a towing speed of 2.3 knots, and Fig. 10 presents these results for a towing speed of 3.4 knots. The fluctuations were greater at the rear of the cod-end. Trials 6 to 9 produced larger depth variations at the front of the cod-end than trials 2 to 5 did. The main reasons for variation in depth at the front cod-end were wave motion and ship motion, because 1.5-m waves were encountered during trials 6 to 9.
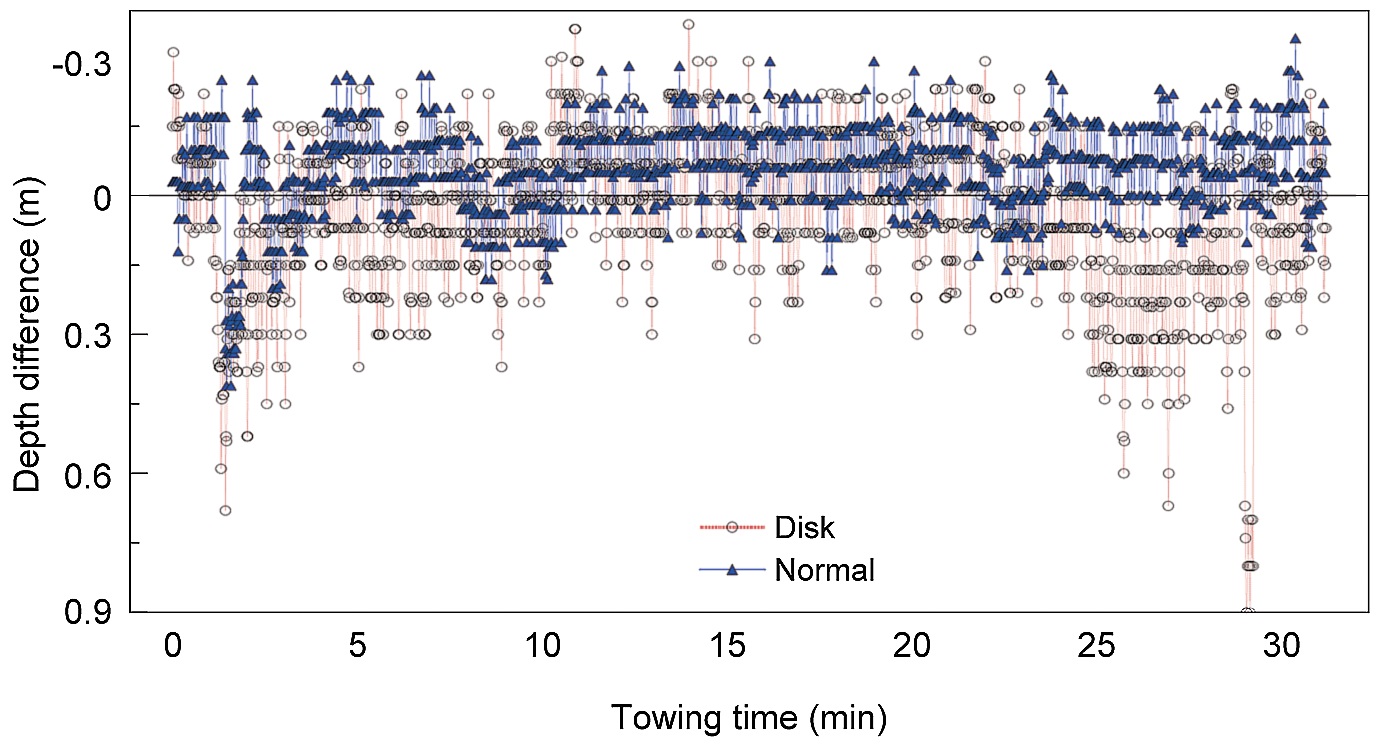
The shaking motion at the rear of the cod-end was determined based on the difference between the front and end depths; Fig. 11 which compares cases with and without the oscillating canvas. The depth difference without the oscillating
canvas was less than half that with the oscillating canvas.
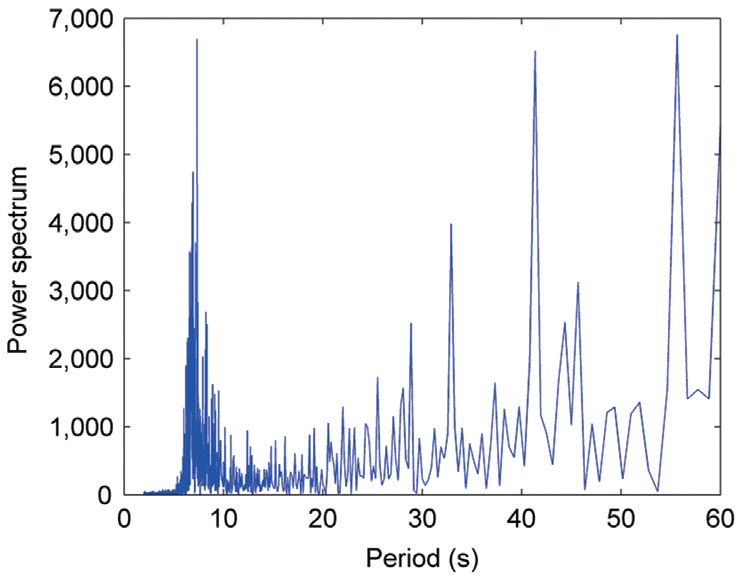
The shaking motion at the rear of the cod-end relative to the main body of the cod-end was derived based on the depth difference between the front and rear of the cod-end, as shown previously in Fig. 4. Fig. 12 presents a period analysis of the depth difference using an FFT for trial 5 when the towing speed was 2.3 knots. This case had several peaks, ranging from 7 s to longer than 40 s in length, and all significant periods were at least a few minutes. The periodicity also widely dispersed in other trials, as indicated by the FFTs,
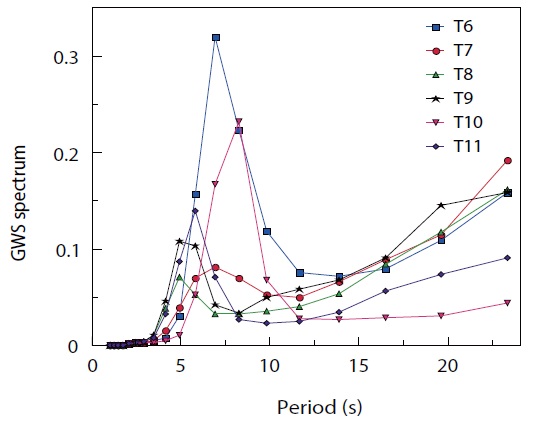
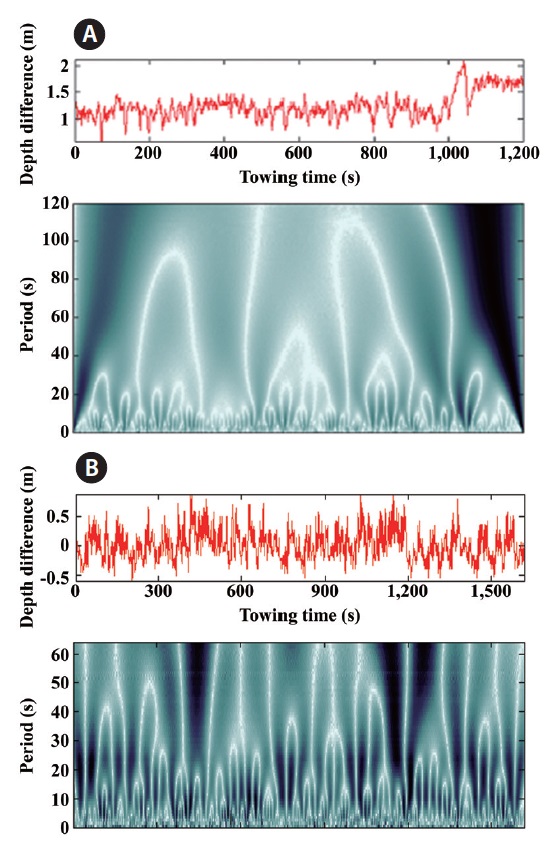
Mexican-hat wavelet analysis was used to visually assess changes in periods with time; Fig. 13 presents the results for trial 4 with a towing speed of 2.3 knots, and for trial 8 with a towing speed of 3.4 knots. Based on the results of the eight trials, the overall pattern of the period band from the wavelet spectrum clearly revealed a shorter period for the plume (sprig-like shape) of 5-7 s, followed by a longer period (limblike shape connecting many branches) of 40-60 s. Fig. 14 presents the global Morlet wavelet spectra as period profiles for
trials 6-9: the dominant period of the shaking motion for these trials was 5-7 s within a 30-s range, whereas periods were widely dispersed for trials 2-5, with no dominant peak period.
The main shorter shaking period and amplitude of the cod-end were also investigated using an event analysis, as shown in Table 4. The shaking amplitude at a towing speed of 2.3 knots was slightly greater than that at a towing speed of 3.4 knots (
[Table 4.] Period and amplitude of shaking codend in depth difference by event analysis

Period and amplitude of shaking codend in depth difference by event analysis
0.5. Thus, the periods of the shaking motion obtained from the towing experiments were similar whether they were assessed using event analysis or global wavelet analysis methods.
The shaking motion of the model cod-end in the tank was generated by two fixed bridles at the front of the cod-end, while the shaking motion in the towing experiments was generated by two longer towlines. The actual tension and shape at the end of the body net at the front of a real cod-end could be different than what was used in this study. This basic study was conducted to investigate the feasibility of using an active stimulating method to enhance fish escapement; more research using real fishing gear is needed.
A comparison of the results of model tests (see Tables 2 and 3) and sea trials (see Table 4) revealed that the shaking amplitudes in the field experiments were equal to or less than those in the tank tests, while the shaking periods in the field experiments were twice as long as those in the tank test. The length scale of the model cod-end was 4:1 (5.2:1.3 m), although the towing point was not assessed due to the different methods used in the tank and field tests. Also, the velocity scale of the two speeds tested in the tank and at sea was ~2 (at 2.3 knots, 1.2:0.6 m/s and at 3.4 knots, 1.7:0.8 m/s). Therefore, the time ratio between the model and prototype, as defined by Tauti (1934), was ~2, based on the ratio of the length scale to the velocity scale, 4:2. Accordingly, the scale time ratio of 2 matched well with the approximately doubled results in field tests compared with tank tests. Additionally, the period of the shaking motion was increased by the ratio of the net length to diameter, and decreased by the towing velocity, which affected the drag or lift.
The main force that generated the shaking motion of the cod-end was the lift, which could be varied by the area and shape of the oscillating canvas. All tank experiments and sea trials used the same fixed position for the canvas (see Fig. 5B), generating a similar cod-end motion. A similar shaking motion was observed when the diameter of the oscillating canvas was 1.0 or 1.5 m during the sea trials, so this motion could possibly be reproduced using actual fishing gear. However, a theoretical analysis of the shaking motion, and observations during sea trials using a real trawler, should be conducted to verify the shaking effects.
Previously, tank experiments were performed using a fluttering net panel and the same model cod?end (Kim and Whang, 2010; Kim, 2011). The most effective stimulus for juvenile seabream or halibut escapement occurred when the amplitude of the fluctuations was 0.6 times the cod?end diameter and the period of the fluctuations was 3 s. At full scale with a net height of 1 m, for example, swimming fish positioned even at the middle of the net could be oriented 20 cm from the upper net panel for an upward shaking motion or lower net panel for a downward shaking motion. For an approach distance of less than 20 cm, strong visual cues combined with a flapping motion with a period of 7 s could be used to disturb the optomotor response of the fish and increase escapement (Kim et al., 2008). A stimulus due to the shaking motion could be expected at an approach speed deduced from the period and the amplitude. The mean approach speed was estimated at about 7 cm/s for both the model and prototype cod-end, which is slower than the swimming speed of fish.
Further field investigations will be required to assess how escape aided by a shaking cod-end affects juvenile fish in terms of stress, including survival rates after escape. The effects of a shaking cod-end on fish escapement considering fish swimming mechanics in turbulent flow (Liao, 2007; Webb and Cotel, 2010) should be also investigated using both tank experiments and sea trials. Other issues to consider include the possibility that the shaking motion of the rear of a codend (caused by a shaking disk) might also be affected by an imbalance in the lifting force over time, combined with an angle similar to the rotation of a rope kite (Kim, 2010). In future research, we also plan to investigate the shaking motion described by the amplitude and period of an oscillating canvas, as well as the effects of the canvas size and attachment position, to determine the optimum conditions affecting fish escapement.