검색 전체 메뉴
PDF
맨 위로
OA 학술지
Establishment and Characterization of Permanent Cell Lines from Oryzias dancena Embryos
  • 비영리 CC BY-NC
  • 비영리 CC BY-NC
ABSTRACT
Establishment and Characterization of Permanent Cell Lines from Oryzias dancena Embryos
KEYWORD
Oryzias dancena , Blastula , Permanent cell line , Characterization
  • Introduction

    Cells derived from multicellular organisms provide a more convenient and detailed analytic system than those using whole organisms. Establishing permanent cell lines in vitro, either spontaneously or intentionally (Freshney, 2010), makes possible identification of the molecular mechanisms underlying a variety of biological functions, as these cell lines provide a readily available, stable and reproducible system for analyzing identical cells that genetically resemble the original tissues and species (Bols et al., 1994; Smith, 2006). Indeed, cell lines established from insects, amphibians, fish, experimental and livestock animals, as well as humans, have been used in many different types of biological studies such as drug discovery, toxicology, functional studies for genes and proteins, cancer research, and tissue engineering (Smagghe et al., 2009; Lakra et al., 2011; Sinzelle et al., 2012; Stacey, 2012). In fish, the first established cell line, RTG-2, was derived from Salmo gairdneri gonads (Wolf and Quimby, 1962), leading to the reported establishment of a total of 283 cell lines as of 2011 (Lakra et al., 2011). However, these cell lines are not sufficient to provide for the demands of scientific and industrial research and development due to the limited number of species used. Thus, the requirement for the development of additional species- specific cell lines has been being suggested continuously.

    Here, we have focused on marine medaka, Oryzias dancena, which has many advantages as an experimental model fish, similar to Japanese medaka O. latipes. This fish can spawn daily depending on the environmental conditions, shows rapid growth and a short generation time, and is easy to manage on a laboratory scale (Cho et al., 2010). More importantly, as one of the euryhaline species, they can acclimate to a wide range of salinity from fresh water to seawater (Inoue and Takei, 2003; Cho et al., 2010). Despite these advantages of O. dancena as an experimental model, establishment of a cell line from this species has not yet been reported. Therefore, in this study, we tried to establish permanent cell lines from O. dancena embryos and subsequently characterized the established cell lines within the framework of the morphology, growth and chromosomal normality for further use.

    Materials and Methods

      >  Fish

    Marine medaka O. dancena, the embryo donor used for establishing permanent cell lines, was maintained in the Laboratory of Cell Biotechnology, Pukyong National University (Busan, Korea). Fish were maintained at 25℃ and 5 ppt salinity throughout the experiments. Fish were fed an artificial diet of flounder larvae (EWHA, Busan, Korea). Nile tilapia Oreochromis niloticus, used as the serum donor, was maintained in the hatchery of Pukyong National University.

      >  Preparation of fish serum

    Fish serum was isolated from Nile tilapia O. niloticus grown to >20 cm in length, after anesthetization in water containing 0.3 mg/mL lidocaine hydrochloric acid (Duksan, Ansan, Korea) and 1 mg/mL sodium bicarbonate (Daeshinpharm Co. Ltd., Seoul, Korea). The blood was collected from the tail vein of O. niloticus using 10-mL syringes soaked with 0.5 M ethylenediaminetetraacetic acid (EDTA; USB Co., Cleveland, OH, USA). Collected blood was chilled on ice and centrifuged at 3,500 g for 15 min. The supernatant was removed to new tubes and incubated overnight at 4℃. After one additional centrifugation at 3,500 g for 30 min, the supernatant was heat-inactivated at 56℃ for 30 min, filtered through a 0.1-μm syringe filter and stored at ?20℃ until use.

      >  Preparation of embryo extract

    For the preparation of embryo extract from O. dancena, 400-1,000 blastula embryos were collected and homogenized. The homogenate was subjected to three freeze-thaw cycles in liquid nitrogen and a 37℃ water bath and centrifuged at 3,500 g for 30 min at 4℃. The supernatant was additionally centrifuged at 18,000 g for 30 min at 4℃, which resulted in three layers. The middle layer contained the embryo extract, which was retrieved, sterilized by filtration through a 0.1 μm syringe filter and stored at ?20℃ until use.

      >  Isolation and culture of blastomeres from blastula embryos

    Embryos (8-20) developed to the early or late blastula stage were rinsed with 70% ethanol for 10 s to prevent microbial contamination, and washed three times in Dulbecco’s phosphate-buffered saline (DPBS; Gibco, Grand Island, NY, USA). The developmental stage of embryos was identified using the method of Song et al. (2009). Briefly, the early blastula stage occurs 7 h 45 min-9 h after fertilization, while the late blastula stage occurs 9 h-11 h 30 min after fertilization. The embryos were subsequently ruptured by fine needles in a petri dish and the scattered blastomeres were transferred to a centrifuge tube after removing the eggshells. After centrifugation, isolated blastomeres were cultured on 0.1% gelatin (Sigma-Aldrich, St. Louis, MO, USA)-coated tissue culture plates (48 multi-well plate; SPL Life Sciences, Pocheon, Korea) with Dulbecco’s Modified Eagle’s Medium (Gibco) supplemented with 4.5 g/L D-glucose, 20 mM HEPES, 1% (v/v) non-essential amino acids (Gibco), 15% (v/v) fetal bovine serum (FBS; Cellgro, Manassas, VA, USA), 1% (v/v) fish serum, embryo extract (50, 100, or 150 μg/mL), 1% (v/v) penicillin-streptomycin mixture (Gibco), 10 ng/mL recombinant human basic fibroblast growth factor (bFGF; Gibco), 100 μM β-mercaptoethanol (Gibco), 2 nM sodium selenite (Sigma-Aldrich), and 1 mM sodium pyruvate (Gibco). The embryo extract concentration was fixed at 50 μg/mL after seven passages. All cell culture was conducted using the culture medium above, unless stated otherwise. The cells were cultured in a 28℃ incubator with an air atmosphere and sub-cultured every 2 or 3 days when they reached 80-90% confluency.

      >  Measurement of growth rate

    To determine growth rates, 2 × 10⁴ cells per well were seeded in 0.1% gelatin-coated 48-well culture plates filled with culture medium and cultured for 10 days in a 28℃ incubator with air atmosphere. Culture medium was changed every 3 days after first change at day 1 of culture. From day 1 to 10 of culture, proliferating cells were counted daily with a hemocytometer (Marienfeld, Lauda-Konigshofen, Germany) after detachment by 0.05% trypsin-EDTA (Gibco). This experiment was repeated three times in a independent manner.

      >  Karyotype analysis

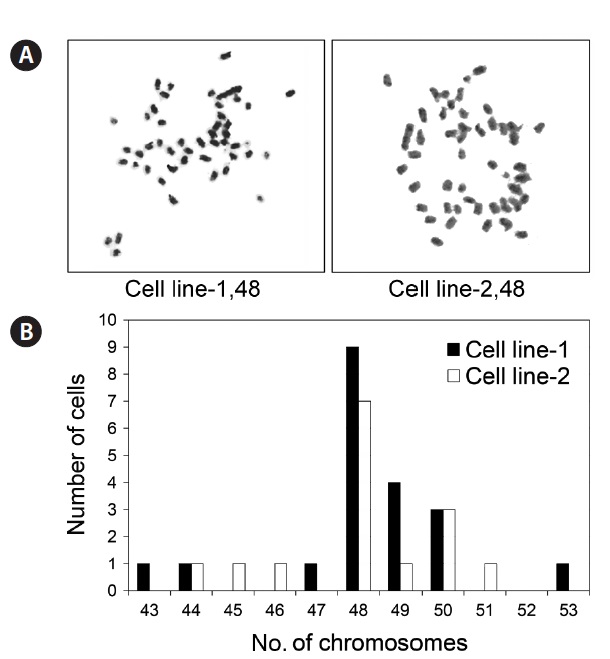
    The cells were washed in DPBS and treated with a 0.075 M KCl (Sigma-Aldrich) solution for 10 min at 28℃. The swollen cells were fixed with a cold fixative solution of 3:1 methanol (Sigma-Aldrich) and acetic acid (Sigma-Aldrich) changed three times by centrifugation at 400 g for 5 min. Metaphase chromosomes were spread onto ethanol-treated slides and stained with Giemsa’s solution containing 10% (v/v) KARYOMAX Giemsa stain (Gibco) in Gurr’s buffer (Gibco). After washing in distilled water, the slides were air-dried and chromosomes counted.

      >  Clonogenicity test

    A total of 3,600 cells were initially seeded on 60-mm tissue culture plates (SPL Life Sciences) in culture medium for 10 days under an air atmosphere at 28℃. The medium was replaced every 3 days and clonally expanded colonies counted at the end of culture.

      >  Growth rates according to medium composition

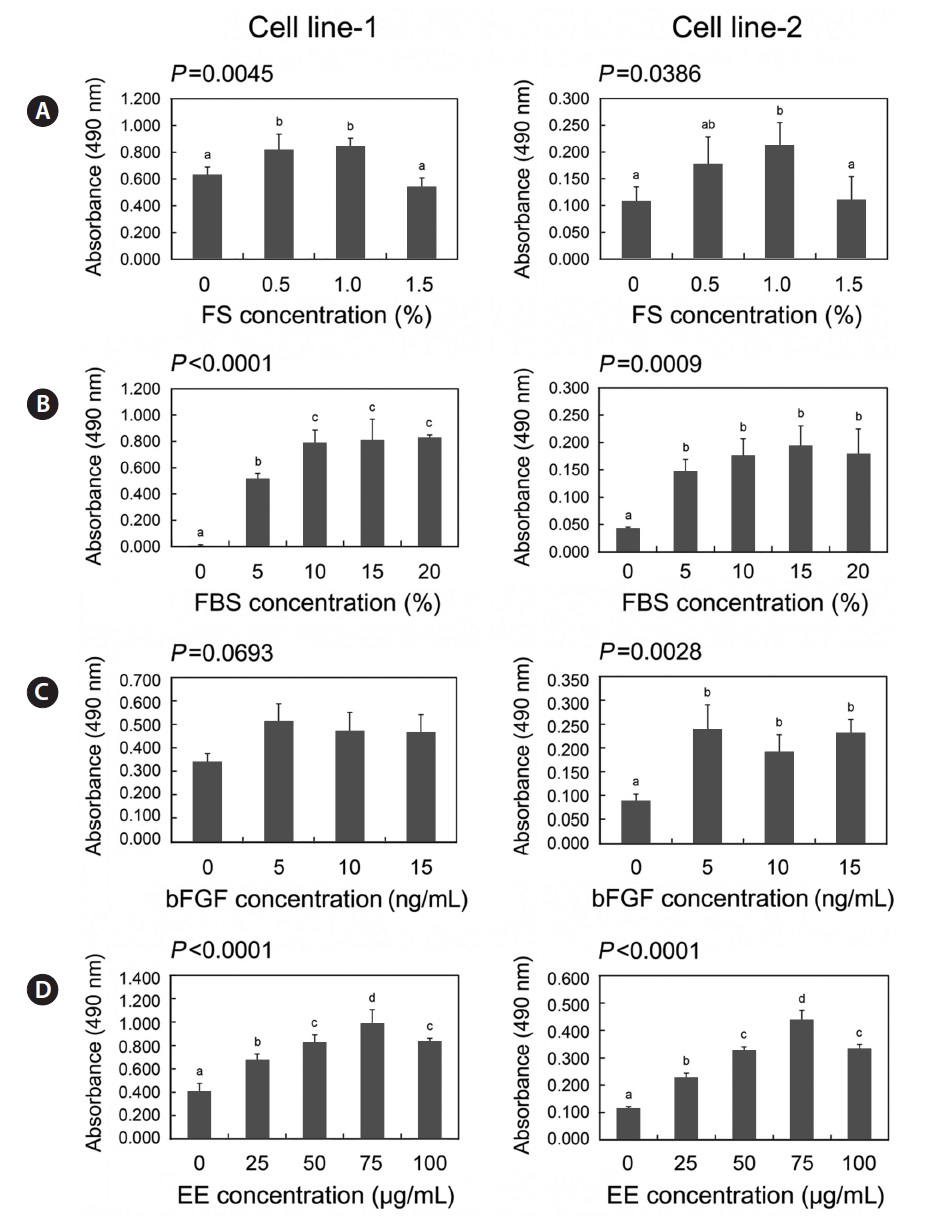
    To evaluate the growth reactivity of cells to culture medium supplements, 1,000 cells/well were cultured in a 0.1% gelatincoated 96-well culture plate with culture medium supplemented with various concentrations of fish serum (0, 0.5, 1, and 1.5%), FBS (0, 5, 10, 15, and 20%), bFGF (0, 5, 10, and 15 ng/ mL), or embryo extract (0, 25, 50, 75, and 100 μg/mL). After 6 days of culture, the viability of cultured cells was assayed using the cell counting kit-8 (Dojindo, Kushu, Japan), according to the manufacturer’s instructions.

      >  Statistical analyses

    The Statistical Analysis System (SAS) software was used to analyze the numerical data. When an analysis of variance (ANOVA) identified a significant primary effect, treatments were subsequently compared by the least-square or Duncan’s method. P < 0.05 were regarded as indicative of significant differences.

    Results

      >  Establishment of permanent cell lines

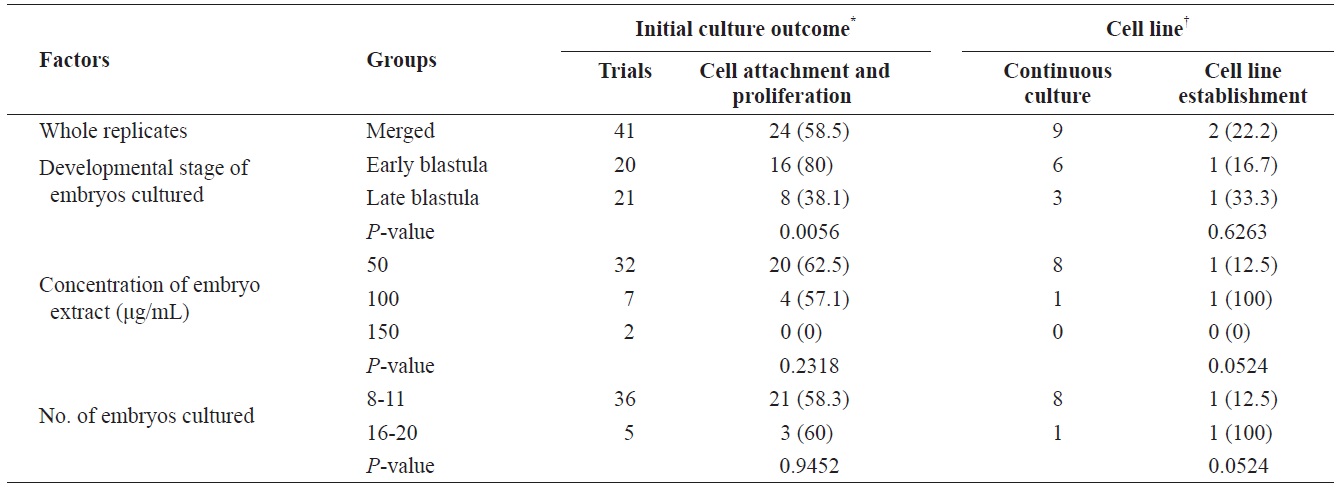
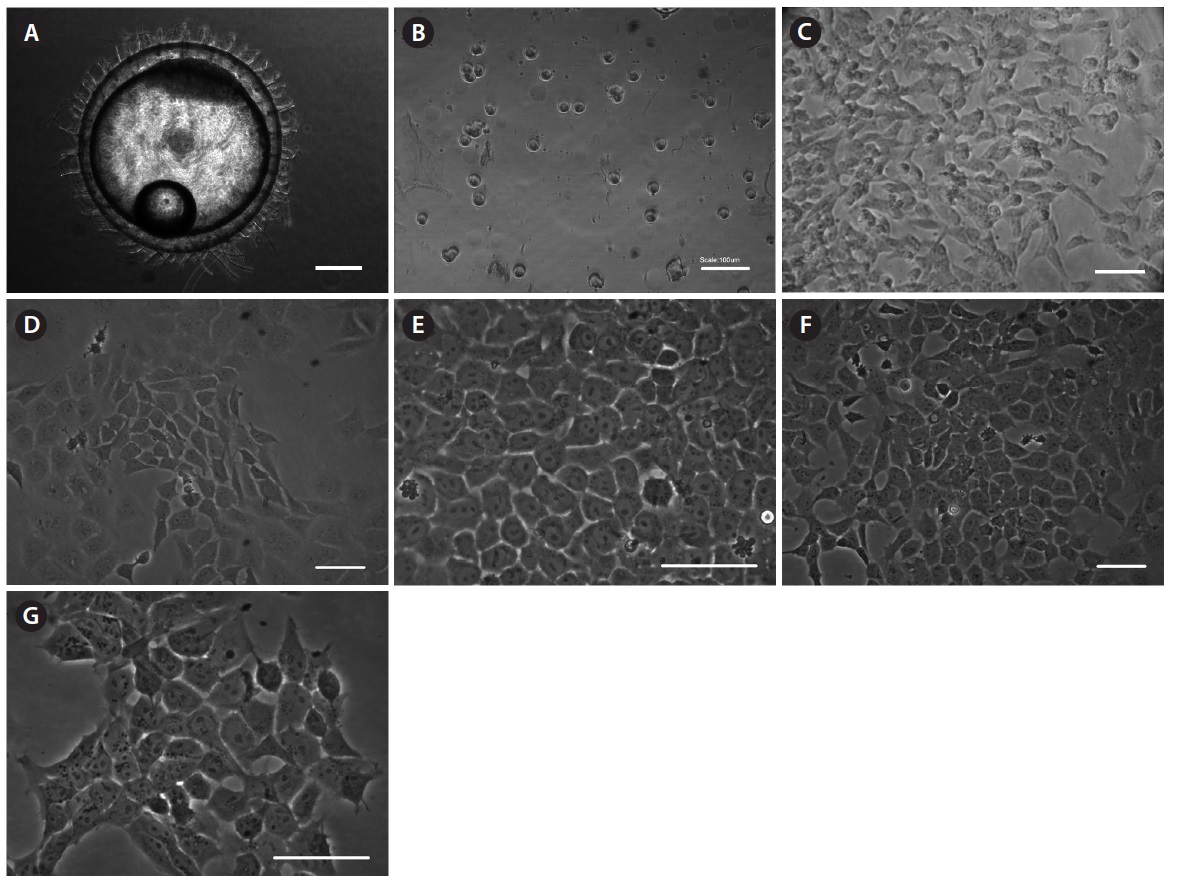
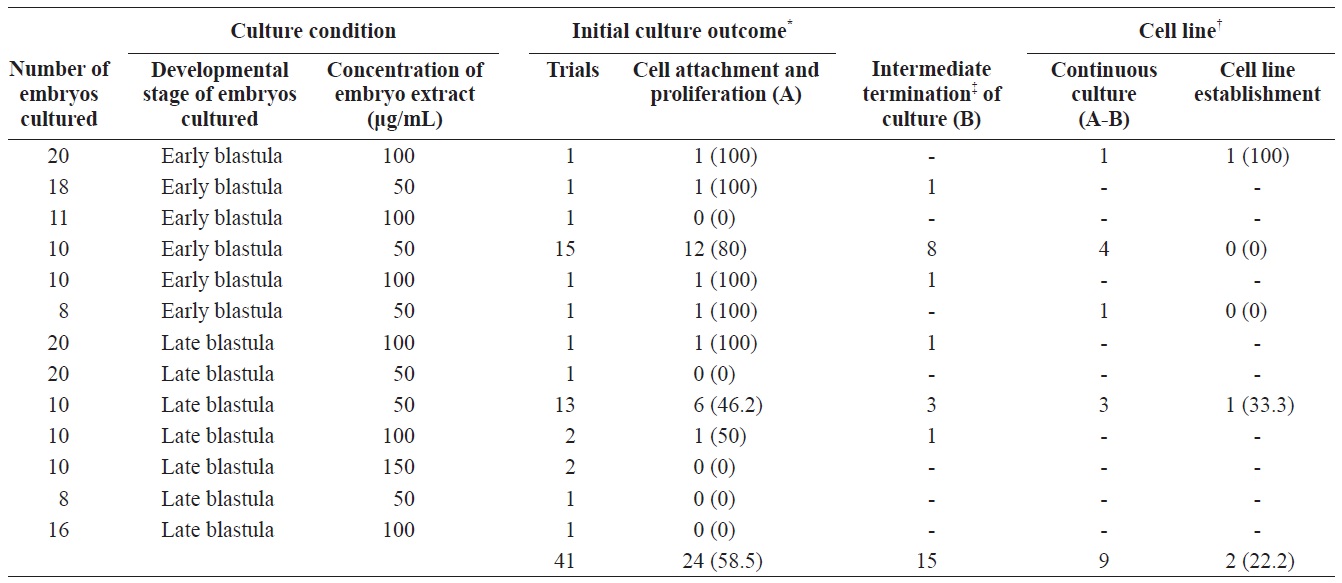
    To establish permanent cell lines, we isolated blastomeres from developing embryos (Fig 1A and 1B). Isolated blastomeres from early or late blastula of a number of embryos were cultured under different conditions. As shown in Table 1, in 24 (58.5%) of 41 trials, the formation of primary cells was observed from cultured embryonic cells, and these cells proliferated sufficiently for subculture after 7 days (Fig. 1C). Nine of these trials were continuously cultured without intermediate termination, while all but two cases failed to induce immortalization. We found that the developmental stage of embryos was a key factor contributing to primary cell attachment and proliferation during initial culture (Table 2). A higher frequency of success was detected when blastomeres from early blastulas were used, compared to late blastulas (80 vs. 38.1%, P = 0.0056). As a result, two permanent cell lines were established from 41 trials, a success rate of 4.9%. These two cell lines were stably passaged 152 and 121 times, which corresponds to 332 and 293 days, respectively, and showed the typical morphology of in vitro cultured cells with a clear cell outline, a distinct nucleus, and one or two nucleoli (Fig. 1D-1G).

      >  Growth properties of permanent cell lines

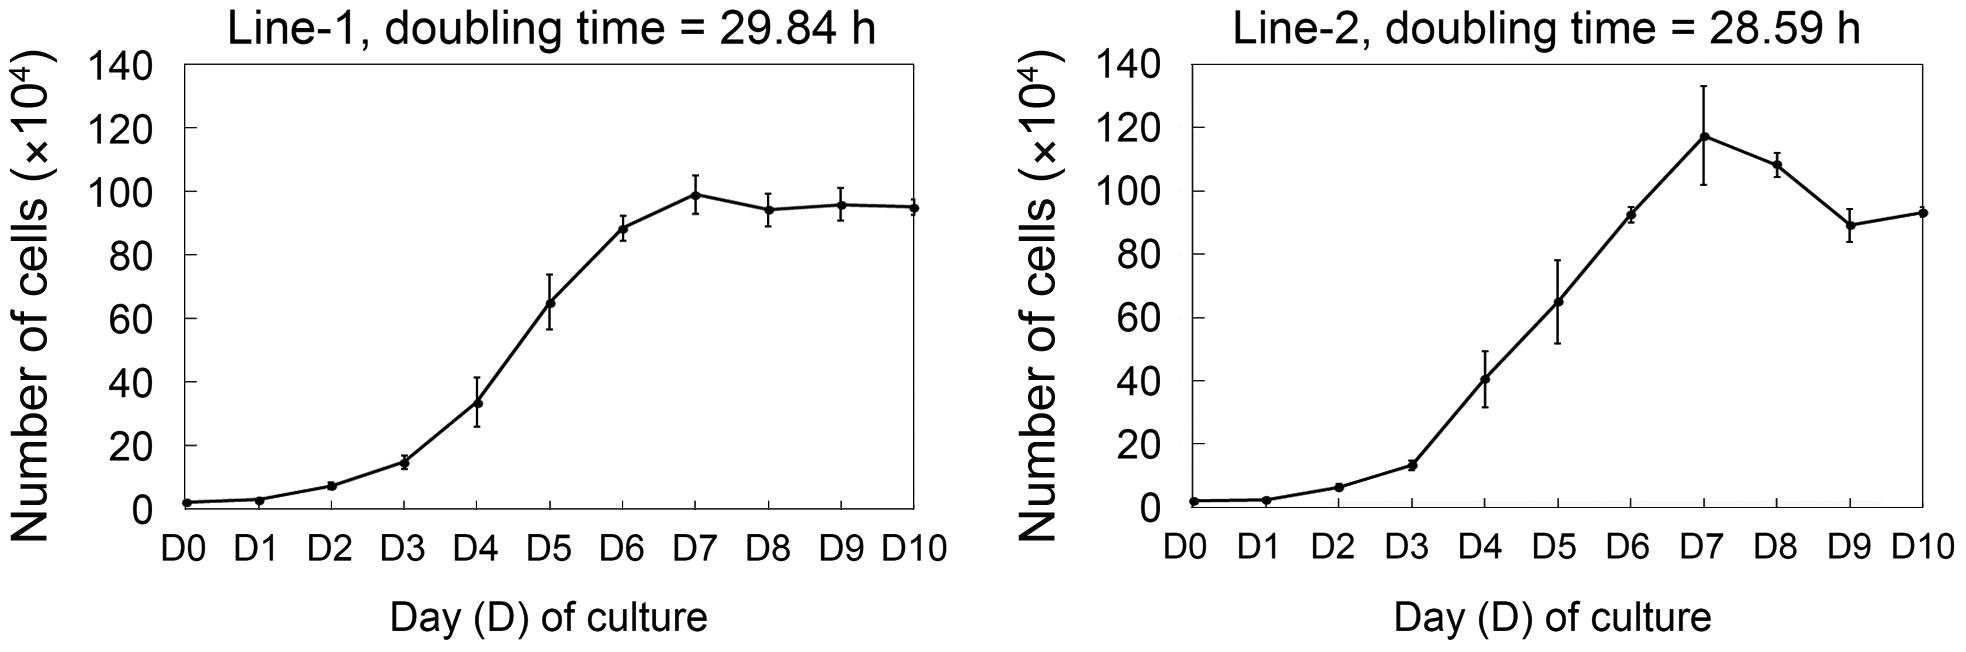
    The growth curves of established cell lines are shown in Fig. 2. Cell line 1 had a doubling time of 29.84 h and cell

    [Table 1.] Culture outcome of embryonic cells from blastula stage embryos

    label

    Culture outcome of embryonic cells from blastula stage embryos

    [Table 2.] Factors affecting initial culture outcome of embryonic cells

    label

    Factors affecting initial culture outcome of embryonic cells

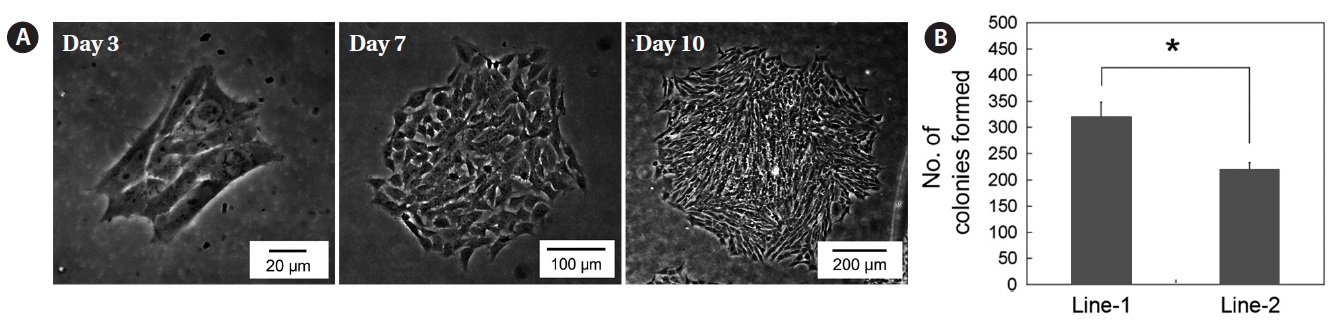
    line 2 had a doubling time of 28.59 h. To determine whether these cell lines could expand clonally, the cells were cultured at a low density (127 cells/cm2) and colonies formed by clonal expansion were identified and counted. As shown in Fig. 3A, small colonies derived from single cells were identified on day 3 of culture and these colonies grew continuously. The total number of colonies on day 10 of culture was significantly different between the two cell lines―clonogenicity was higher in cell line 1 than cell line 2 (327 ± 27.8 vs. 220 ± 12.2, P = 0.0046) (Fig. 3B).

      >  Chromosomal normality

    To evaluate the chromosomal normality of the established cell lines, metaphase chromosomes were prepared and the chromosomes in each cell counted. As shown in Fig. 4, a proportion of cell population bearing the normal number of 48 chromosomes was 45% and 46.7% in cell line 1 and 2, respectively.

      >  Growth responses to different media supplements

    As a part of optimization of culture conditions, we assessed the growth response to the following medium supplements: fish serum, FBS, bFGF, and embryo extracts. As shown in Fig. 5, removal of each supplement from the medium resulted in significant inhibition of the growth of both cell lines (P < 0.05), except for bFGF treatment in cell line 1. High concentrations (1.5%) of fish serum had detrimental effects on cell growth compared to lower concentrations (0.5% and 1%) (Fig. 5A). FBS concentrations >10% and >5% were sufficient to support growth of cell lines 1 and 2, respectively (Fig. 5B). The growth responses to bFGF treatment differed between the two cell lines. No significant difference in the growth of cell line 1 was detected among the bFGF treatment groups, while significant growth stimulation of cell line 2 was detected with

    >5 ng/mL bFGF (Fig. 5C). Embryo extracts stimulated growth of both cell lines in a dose-dependent manner; however 100 μg/mL inhibited the growth of both cell lines (Fig. 5D).

    Discussion

    We have shown that cell lines from marine medaka O. dancena embryos can be established and grow stably during long-term in vitro culture. In addition, we assessed the morphology, growth rate, karyotype, clonogenicity, and growth response to major medium supplements for further application of the established cell lines.

    To establish permanent cell lines from embryonic cells at the blastula stage, the number and developmental stage of the embryos, as well as the embryo extract concentration, were varied and cell attachment, proliferation, and cell line establishment subsequently evaluated. We found that the developmental stage of embryos, as either early or late blastulas, was a key factor in the attachment and proliferation of cultured embryonic cells. This may a consequence of the midblastula transition, which results in dramatic changes in embryonic cells, such as cell cycle elongation, desynchronization of cells, zygotic transcription, and commencement of cell motility (Newport and Kirschner, 1982; Kane and Kimmel, 1993, Dalle Nogare et al., 2009). Early blastula cells exhibit rapid proliferation rate due to repeating S and M phases without a gap period, which may aid in attachment and proliferation in extraordinary environments. The number of embryos in initial culture is another important factor that affects cell density, which plays a critical role in the regulation of the function and differentiation of many cell types (Limoli et al., 2004; Portela et al., 2010; Yi et al., 2010). Based on our results, more than 10 embryos/well of a 48-well plate provided sufficient primary cells to establish permanent cell lines from embryos. Embryo extracts are regarded as a key factor regulating the cell cycle and cell potency; indeed, 50 μg/mL was sufficient for initial cell culture and maintenance. Our data suggested that the event of cellular transformation of cultured embryonic cells into immortal state occurred at a frequency of 22.2% (two lines from nine primary cultured cells) in a spontaneous manner. However, it is unknown whether the immortalization rate involved these factors due to a lack of replicates; therefore, further studies are necessary.

    The ability of a single cell to grow to form a colony is a phenotypic marker of transformed cells, which possess the capacity for unlimited division and lose density limitation of proliferation (Franken et al., 2006; Freshney, 2010). In this study, 9% of the cells from cell line 1 and 6% from cell line 2 possessed clonogenicity, confirming that the two established cell lines underwent successful spontaneous transformation to be permanent cell lines. In addition to the phenotypic changes, we identified a high frequency of chromosomal abnormality (53.3-55%) in the established cell lines, which has been associated with cellular transformation (Rao et al., 2006; Thibodeaux et al., 2009; Stepanenko and Kavsan, 2012). Genetic mutations in cell cycle, survival, or apoptosis regulatory genes under suboptimal culture conditions can induce chromosomal instability and cellular transformation (Li et al., 2010; Thompson and Compton, 2010; Weiss et al., 2010). Nevertheless, the selection of cells with chromosomal normality and subsequent optimization of culture conditions enables use of a normal cell population, if required.

    For the culture of established cell lines, culture medium was supplemented with the following four components: fish serum, FBS, bFGF, and embryo extracts, which promote proliferation (Collodi and Barnes, 1990; Boilly et al., 2000; Freshney, 2010). Knowledge of the dependence of the cell lines on these factors makes it possible to evaluate cellular properties and optimize culture conditions. The growth of the two established cell lines was influenced by all four factors, with the exception of bFGF. This suggests that, in spite of the acquisition of the ability to grow continuously, these two cell lines retained normal processes in terms of handling signals from exogenous growth factors, which can be destroyed by cellular transformation (Eagle et al., 1970; Li et al., 1989). We also found that the two established cell lines had different growth performances in this experiment, despite similar responses to the medium supplements. Such differences are not matched with the result that showed similar growth rates between two cell lines, which may have been due to differences in the cell density used between two experimental sets. The initial cell density for the growth rate experiments was 31,454 cells/cm2 while it was 2,600 cells/cm2 for the experiments of growth responses to main media supplements. This suggests that cell line 2 was more susceptible to culture environments at a low cell density than cell line 1, which is supported by the significantly lower clonogenicity of cell line 2 compared to cell line 1.

    We targeted blastomeres from blastula-stage embryos to generate permanent cell lines in this fish species. Blastomeres at this stage have the potential to develop into many types of cells and tissues (Nilsson and Cloud, 1992; Hong et al., 1998). Thus, cell lines established from blastomeres at the blastula stage might have a developmental potential similar to that of the original blastomeres. The establishment of such cell lines, called embryonic stem (ES) cells or ES-like cells, has been reported (Hong et al., 1996; Bejar et al., 2002; Yi et al., 2009; Hong et al., 2011). These cell types are good models for investigation of cellular and genetic events during in vitro and in vivo development (Wobus and Boheler, 2005). Our protocols for cell line establishment followed that of haploid ES cell establishment, with slight modifications (Yi et al., 2010), which suggest that the cell lines established in this study may retain developmental potential, which should be further investigated. Intensive studies about such aspects will be able to help to evaluate and utilize those characteristics.

    In conclusion, we have described the basic characteristics of two permanent cell lines derived from the embryos of O. dancena, a euryhaline species that is a good model fish. These cell lines can be utilized as a basic tool for cell-based investigation of the unique feature of this fish species as well as developmental process, after being further characterized.

참고문헌
  • 1. Bejar J, Hong Y, Alvarez MC 2002 An ES-like cell line from the marine fish Sparus aurata: characterization and chimaera production. [Transgenic Res] Vol.11 P.279-289 google cross ref
  • 2. Boilly B, Vercoutter-Edouart AS, Hondermarck H, Nurcombe V, Le Bourhis X 2000 FGF signals for cell proliferation and migration through different pathways. [Cytokine Growth Factor Rev] Vol.11 P.295-302 google cross ref
  • 3. Bols NC, Barlian A, Chirino-Trejo M, Caldwell SJ, Goegan P, Lee LEJ 1994 Development of a cell line from primary cultures of rainbow trout, Oncorhynchus mykiss (Walbaum), gills. [J Fish Dis] Vol.17 P.601-611 google cross ref
  • 4. Cho YS, Lee SY, Kim DS, Nam YK 2010 Tolerance capacity to salinity changes in adult and larva of Oryzias dancena, a euryhaline medaka. [Korean J Ichthyol] Vol.22 P.9-16 google
  • 5. Collodi P, Barnes DW 1990 Mitogenic activity from trout embryos. [Proc Natl Acad Sci U S A] Vol.87 P.3498-3502 google cross ref
  • 6. Dalle Nogare DE, Pauerstein PT, Lane ME 2009 G2 acquisition by transcription-independent mechanism at the zebrafish midblastula transition. [Dev Biol] Vol.326 P.131-142 google cross ref
  • 7. Eagle H, Foley GE, Koprowski H, Lazarus H, Levine EM, Adams RA 1970 Growth characteristics of virus-transformed cells: maximum population density, inhibition by normal cells, serum requirement, growth in soft agar, and xenogeneic transplantability. [J Exp Med] Vol.131 P.863-879 google cross ref
  • 8. Franken NA, Rodermond HM, Stap J, Haveman J, van Bree C 2006 Clonogenic assay of cells in vitro. [Nat Protoc] Vol.1 P.2315 google cross ref
  • 9. Freshney RI 2010 Culture of Animal Cells: A Manual of Basic Technique and Specialized Applications. google
  • 10. Hong N, Li Z, Hong Y 2011 Fish stem cell cultures. [Int J Biol Sci] Vol.7 P.392-402 google cross ref
  • 11. Hong Y, Winkler C, Schartl M 1996 Pluripotency and differentiation of embryonic stem cell lines from the medakafish (Oryzias latipes). [Mech Dev] Vol.60 P.33-44 google cross ref
  • 12. Hong Y, Winkler C, Schartl M 1998 Efficiency of cell culture derivation from blastula embryos and of chimera formation in the medaka (Oryzias latipes) depends on donor genotype and passage number. [Dev Genes Evol] Vol.208 P.595-602 google cross ref
  • 13. Inoue K, Takei Y 2003 Asian medaka fishes offer new models for studying mechanisms of seawater adaptation. [Comp Biochem Physiol B Biochem Mol Biol] Vol.136 P.635-645 google cross ref
  • 14. Kane DA, Kimmel CB 1993 The zebrafish midblastula transition. [Development] Vol.119 P.447-456 google
  • 15. Lakra WS, Swaminathan TR, Joy KP 2011 Development, characterization, conservation and storage of fish cell lines: a review. [Fish Physiol Biochem] Vol.37 P.1-20 google cross ref
  • 16. Li L, Orlando J, Chen JK 1989 Growth factor requirements of normal and polyomavirus middle T gene transformed REF52 cells in serum-free medium: indications of a reduced vasopressin requirement and its relationship to the control of phosphatidylinositol metabolism. [Exp Cell Res] Vol.183 P.229-238 google cross ref
  • 17. Li M, Fang X, Baker DJ, Guo L, Gao X, Wei Z, Han S, van Deursen JM, Zhang P 2010 The ATM-p53 pathway suppresses aneuploidy-induced tumorigenesis. [Proc Natl Acad Sci U S A] Vol.107 P.14188-14193 google cross ref
  • 18. Limoli CL, Rola R, Giedzinski E, Mantha S, Huang TT, Fike JR 2004 Cell-density-dependent regulation of neural precursor cell function. [Proc Natl Acad Sci U S A] Vol.101 P.16052-16057 google cross ref
  • 19. Newport J, Kirschner M 1982 A major developmental transition in early Xenopus embryos: I. characterization and timing of cellular changes at the midblastula stage. [Cell] Vol.30 P.675-686 google cross ref
  • 20. Nilsson EE, Cloud JG 1992 Rainbow trout chimeras produced by injection of blastomeres into recipient blastulae. [Proc Natl Acad Sci U S A] Vol.89 P.9425-9428 google cross ref
  • 21. Portela VM, Zamberlam G, Price CA 2010 Cell plating density alters the ratio of estrogenic to progestagenic enzyme gene expression in cultured granulosa cells. [Fertil Steril] Vol.93 P.2050-2055 google cross ref
  • 22. Rao K, Alper O, Opheim KE, Bonnet G, Wolfe K, Bryant E, O’Hara Larivee S, Porter P, McDougall JK 2006 Cytogenetic characterization and H-ras associated transformation of immortalized human mammary epithelial cells. [Cancer Cell Int] Vol.6 P.15 google cross ref
  • 23. Sinzelle L, Thuret R, Hwang HY, Herszberg B, Paillard E, Bronchain OJ, Stemple DL, Dhorne-Pollet S, Pollet N 2012 Characterization of a novel Xenopus tropicalis cell line as a model for in vitro studies. [Genesis] Vol.50 P.316-324 google cross ref
  • 24. Smagghe G, Goodman CL, Stanley D 2009 Insect cell culture and applications to research and pest management. [In Vitro Cell Dev Biol Anim] Vol.45 P.93-105 google cross ref
  • 25. Smith CL 2006 Mammalian cell culture. [Curr Protoc Mol Biol] P.28.0.1-28.0.2 google cross ref
  • 26. Song HY, Nam YK, Bang IC, Kim DS 2009 Embryogenesis and early ontogenesis of a marine medaka, Oryzias dancena. [Korean J Ichthyol] Vol.21 P.227-238 google
  • 27. Stacey G 2012 Current developments in cell culture technology. [Adv Exp Med Biol] Vol.745 P.1-13 google
  • 28. Stepanenko AA, Kavsan VM 2012 Immortalization and malignant transformation of eukaryotic cells. [Cytol Genet] Vol.46 P.96-129 google cross ref
  • 29. Thibodeaux CA, Liu X, Disbrow GL, Zhang Y, Rone JD, Haddad BR, Schlegel R 2009 Immortalization and transformation of human mammary epithelial cells by a tumor-derived Myc mutant. [Breast Cancer Res Treat] Vol.116 P.281-294 google cross ref
  • 30. Thompson SL, Compton DA 2010 Proliferation of aneuploid human cells is limited by a p53-dependent mechanism. [J Cell Biol] Vol.188 P.369-381 google cross ref
  • 31. Weiss MB, Vitolo MI, Mohseni M, Rosen DM, Denmeade SR, Park BH, Weber DJ, Bachman KE 2010 Deletion of p53 in human mammary epithelial cells causes chromosomal instability and altered therapeutic response. [Oncogene] Vol.29 P.4715-4724 google cross ref
  • 32. Wobus AM, Boheler KR 2005 Embryonic stem cells: prospects for developmental biology and cell therapy. [Physiol Rev] Vol.85 P.635-678 google cross ref
  • 33. Wolf K, Quimby MC 1962 Established eurythermic line of fish cells in vitro. [Science] Vol.135 P.1065-1066 google cross ref
  • 34. Yi M, Hong N, Hong Y 2009 Generation of medaka fish haploid embryonic stem cells. [Science] Vol.326 P.430-433 google cross ref
  • 35. Yi M, Hong N, Hong Y 2010 Derivation and characterization of haploid embryonic stem cell cultures in medaka fish. [Nat Protoc] Vol.5 P.1418-1430 google cross ref
OAK XML 통계
이미지 / 테이블
  • [ Fig. 1. ]  Establishment of permanent cell lines from the blastomeres of blastula embryos. (A) Blastula embryo 9 h after fertilization. (B) Blastomeres dissociated from the embryos. (C) Embryonic cells cultured for 7 days. (D) Morphology of cell line-1 at 152th subculture (corresponding to 332 days of culture). (E) Magnified image of cell line-1. (F) Morphology of cell line-2 at 121th subculture (corresponding to 293 days of culture). (G) Magnified image of cell line-2. Scale bars: A = 200 μm, B = 100 μm, C-G = 50 μm.
    Establishment of permanent cell lines from the blastomeres of blastula embryos.
(A) Blastula embryo 9 h after fertilization. (B) Blastomeres dissociated from the
embryos. (C) Embryonic cells cultured for 7 days. (D) Morphology of cell line-1 at 152th
subculture (corresponding to 332 days of culture). (E) Magnified image of cell line-1. (F)
Morphology of cell line-2 at 121th subculture (corresponding to 293 days of culture). (G)
Magnified image of cell line-2. Scale bars: A = 200 μm, B = 100 μm, C-G = 50 μm.
  • [ Table 1. ]  Culture outcome of embryonic cells from blastula stage embryos
    Culture outcome of embryonic cells from blastula stage embryos
  • [ Table 2. ]  Factors affecting initial culture outcome of embryonic cells
    Factors affecting initial culture outcome of embryonic cells
  • [ Fig. 2. ]  Growth rate of two permanent cell lines. Total 2 × 10⁴ cells were initially seeded on culture plates and cell number was daily counted during 10 days. Doubling times of each cell line were 29.84 h and 28.59 h in cell line-1 and cell line-2, respectively. The experiments were conducted three times in independent manner and the values were expressed as mean ± SD.
    Growth rate of two permanent cell lines. Total 2 × 10⁴ cells were initially seeded on culture plates and cell number was daily counted during 10
days. Doubling times of each cell line were 29.84 h and 28.59 h in cell line-1 and cell line-2, respectively. The experiments were conducted three times in
independent manner and the values were expressed as mean ± SD.
  • [ Fig. 3. ]  Clonogenicity of permanent cell lines. The cells were grown at low density (127 cells/cm2) during 10 days and the colony formation in both aspects of morphology and capability was examined. (A) Representative images showing clonal expansion. Two cell lines showed a similar growth pattern in morphology but only images of cell line-1 were depicted in this figure. (B) Number (mean ± SD) of colonies formed at the end of the culture. Cell line- 1 showed higher capability to grow in the manner of clonal expansion than line-2. Asterisk indicates significant difference between cell line-1 and -2 (*P = 0.0046).
    Clonogenicity of permanent cell lines. The cells were grown at low density (127 cells/cm2) during 10 days and the colony formation in both
aspects of morphology and capability was examined. (A) Representative images showing clonal expansion. Two cell lines showed a similar growth pattern
in morphology but only images of cell line-1 were depicted in this figure. (B) Number (mean ± SD) of colonies formed at the end of the culture. Cell line-
1 showed higher capability to grow in the manner of clonal expansion than line-2. Asterisk indicates significant difference between cell line-1 and -2 (*P =
0.0046).
  • [ Fig. 4. ]  Chromosomal normality of two permanent cell lines. Metaphase chromosomes of each cell were prepared on side glass and the number of chromosomes was counted after Giemsa staining. (A) Images of the cells containing normal chromosome number (n = 48) from both cell lines. (B) Number of the cells containing normal or abnormal number of chromosomes. The rate of the cells that had normal chromosome number was 45% and 46.7% in cell line-1 and -2, respectively.
    Chromosomal normality of two permanent cell lines. Metaphase
chromosomes of each cell were prepared on side glass and the number
of chromosomes was counted after Giemsa staining. (A) Images of the
cells containing normal chromosome number (n = 48) from both cell
lines. (B) Number of the cells containing normal or abnormal number of
chromosomes. The rate of the cells that had normal chromosome number
was 45% and 46.7% in cell line-1 and -2, respectively.
  • [ Fig. 5. ]  Growth responses of cell lines to main media supplements. Two cell lines were grown in culture medium in which different concentrations of fish serum (FS) (A), fetal bovine serum (FBS) (B), basic fibroblast growth factor (bFGF) (C), or embryo extracts (EE) (D) were added and their growth activities were measured after 6 days of culture. Withdrawal of each factor induced significant growth inhibition except for one case of bFGF treatment in cell line-1. In case of FS and EE, high concentration rather lowered growth activities of both cell lines. All data are mean ± SD of three independent experiments. a-dDifferent letters indicate significant differences, P < 0.05.
    Growth responses of cell lines to main media supplements. Two cell lines were grown in culture medium in which different concentrations of fish serum (FS) (A), fetal bovine serum (FBS) (B), basic fibroblast growth factor (bFGF) (C), or embryo extracts (EE) (D) were added and their growth activities were measured after 6 days of culture. Withdrawal of each factor induced significant growth inhibition except for one case of bFGF treatment in cell line-1. In case of FS and EE, high concentration rather lowered growth activities of both cell lines. All data are mean ± SD of three independent experiments. a-dDifferent letters indicate significant differences, P < 0.05.
(우)06579 서울시 서초구 반포대로 201(반포동)
Tel. 02-537-6389 | Fax. 02-590-0571 | 문의 : oak2014@korea.kr
Copyright(c) National Library of Korea. All rights reserved.