The infiltration of rainfall into the surface soil is governed by the temporarily changing hydraulic variables, such as the infiltration rate, capillary fringe, moisture content, and unsaturated/ saturated hydraulic conductivity. Hydraulic conductivity (K) is one of the main factors affecting subsurface infiltration and groundwater flow. K values can be estimated through pumping, slug, injection, and laboratory permeability tests in addition to a grain-size analysis. When determining the K values through various tests, investigators are often faced with the task of choosing an appropriate K estimate in order to represent the field condition. Pumping tests are often considered superior to laboratory tests because the former reflects more reliable field settings [1,2]; however, this type is costly and requires lengthy periods of time. K value determination by the grain-size analysis reflects neither the horizontal nor vertical aquifer properties [3] and is generally less reliable than pumping tests, owing to the distortion of the texture in the in situ medium [4]. Nonetheless, K values of this method have been recognized for their relation to the grain size distribution [5]. Moreover, the grain-size analysis is an economical method for determining K values of aquifers in order to simulate groundwater flow and solute transport [6], and it is also not considerably dependent on geometry and hydraulic boundaries [7]. Several empirical relationships between K and effective grain size are used to determine K values (e.g., [6-11]). Boadu [12] estimated K by using methods based on the grain size distribution, fractal dimension, entropy of distribution, porosity, soil density, and fine-grain content. Although many grain-size distribution methods can be used to determine the K value of unconsolidated sediments, each method has its limitations [4]. Odong [13] evaluated the empirical formulae of the grain-size distribution and obtained the best overall estimation of K from Kozeny-Carman formula, followed by the Hazen formula.
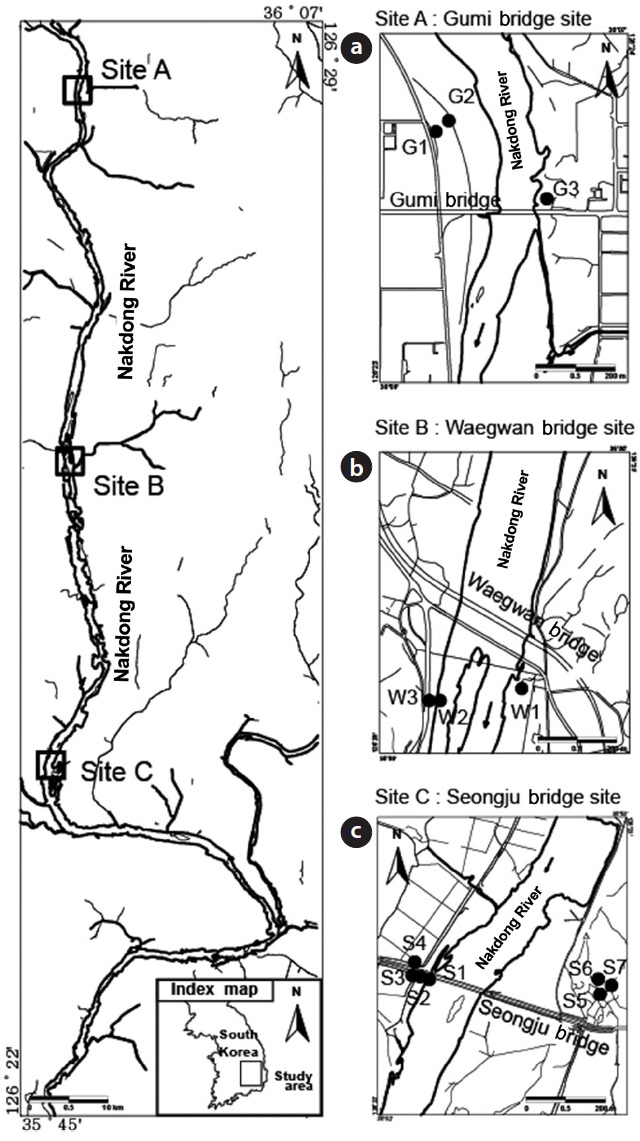
In this study, K values were estimated by using a grain-size analysis of fluvial deposits adjacent to the middle Nakdong River in Gyeongbuk Province, South Korea, at three sites, including the Gumi, Waegwan, and Seongju bridges (Fig. 1). The K values from upstream to downstream and at the right and left river banks were compared by using the empirical formulae of Hazen [8], Slichter [9], Kozeny [10], Beyer [11], Sauerbrei (cited in [14]), and Pavchich [15]. Subsequently, the results of the grain-size analysis were compared with those of pumping and slug test analyses.
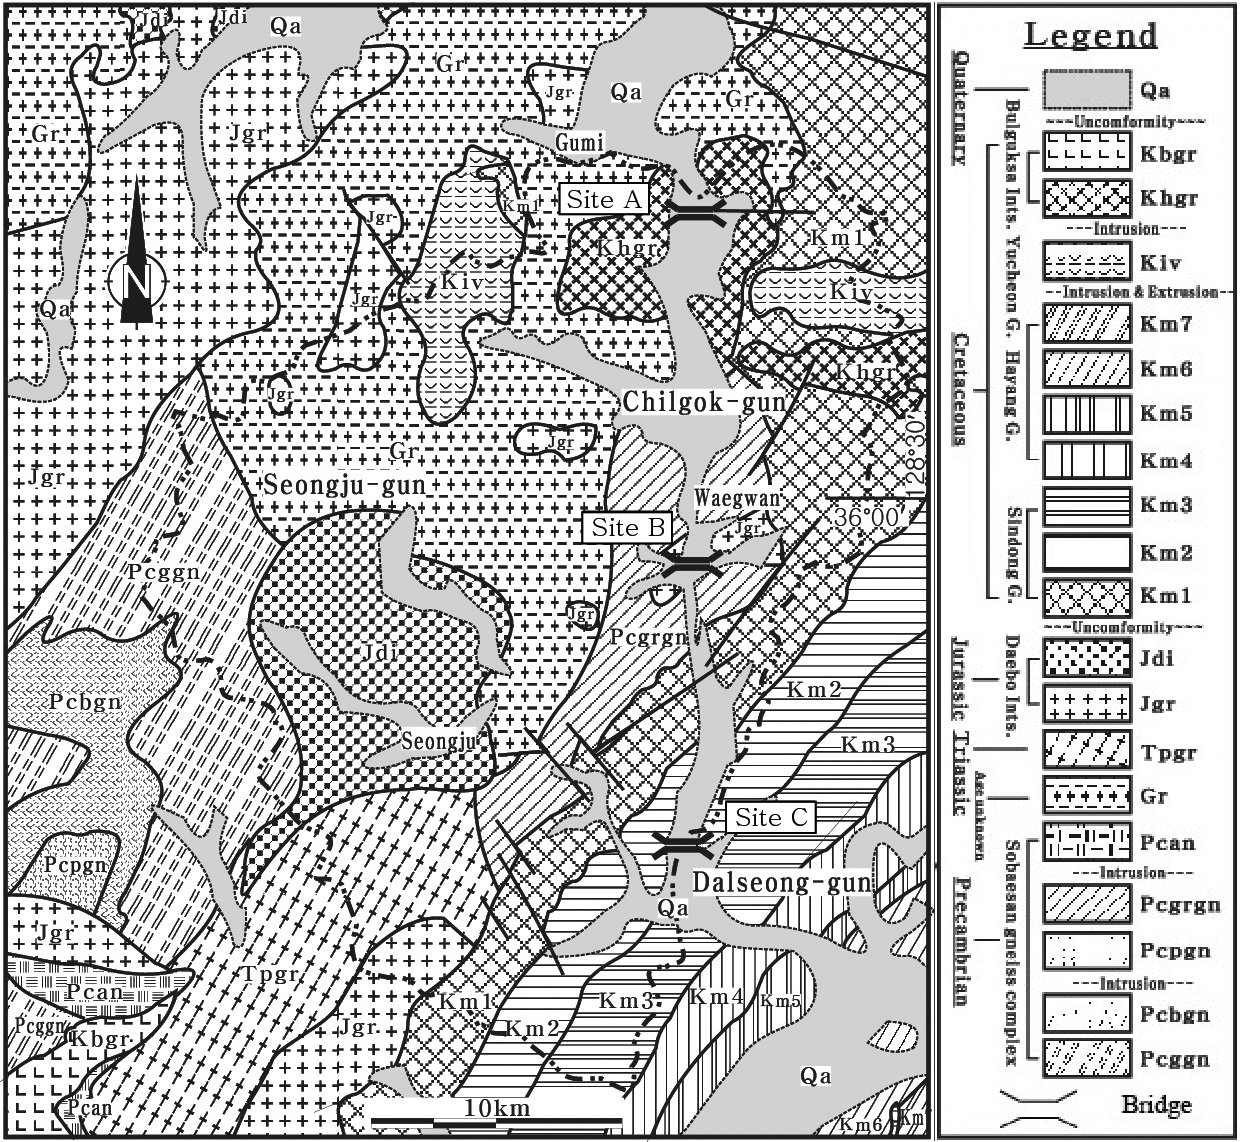
The regional geology near the study sites is represented by the following rocks; granogneiss of the Precambrian Sobaeksan Complex; granite of undetermined age; Triassic porphyritic
granite; Jurassic Daebo intrusive diorite and granite; Cretaceous sedimentary rocks of the Sindong Group composed in ascending order by the Nakdong, Hasandong, and Jinju formations belonging to the Gyeongsang Supergroup; the Creataceous Yucheon Group, which contains andesitic volcanic rocks also belonging to the Gyeongsang Supergroup; Cretaceous Bulguksa intrusive biotite granite; and Quaternary alluvium, which unconformably overlies all of the rocks [16,17] (Fig. 2). The fracture system around the study sites occurs in NE and NNE directions, which is similar to the flow of the main Nakdong River and tributaries. The deposition of sediment may reflect the grain sizes of the sedimentary rocks.
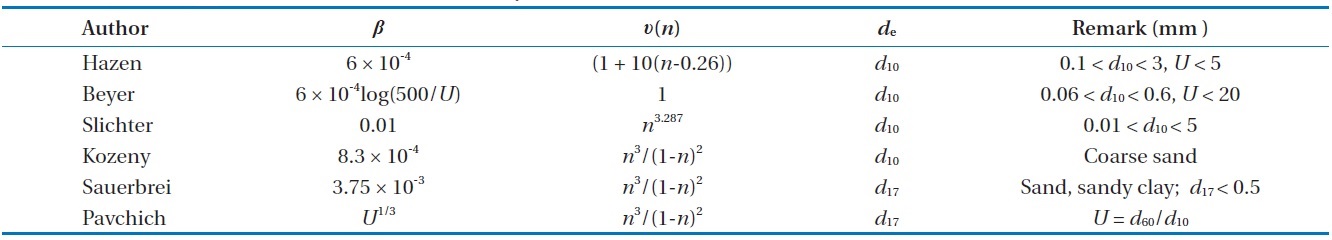
K (ms-1) by using the general empirical equation from the grain-size analysis [18] is:
where C is equal to
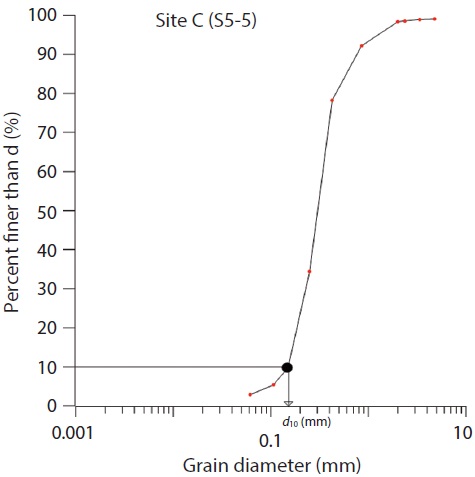
and g is the acceleration of gravity (9.8 ms-2). In addition, the kinematic viscosity of groundwater, ν, is 1.167 × 10⁻⁶ m2s-1at 14℃ and 1.080 × 10⁻⁶ m2s-1 at 17℃, depending on the groundwater temperature of the boreholes. β is a dimensionless factor depending on the fabrics, grain shapes, composition and anisotropic porous media. υ(n) is the porosity function. The porosity (dimensionless), n, was determined by using the empirical formula reported by Vukovic and Soro [18] from the equation, n = 0.255 (1 + 0.83U), where U (= d60/d10) is the uniformity coefficient. Effective grain size (mm), de, corresponds to the percentage (e = 10 or 17) of fine particles by weight on the grain-size distribution curve (Fig. 3).
The coarse and fine fractions were segregated by using a No. 200 (0.075 mm) sieve. The coarse particles were subsequently measured by using 10 sieves of 0.074?4.760 mm, whereas the fine particles were measured by using a hydrometer [19].
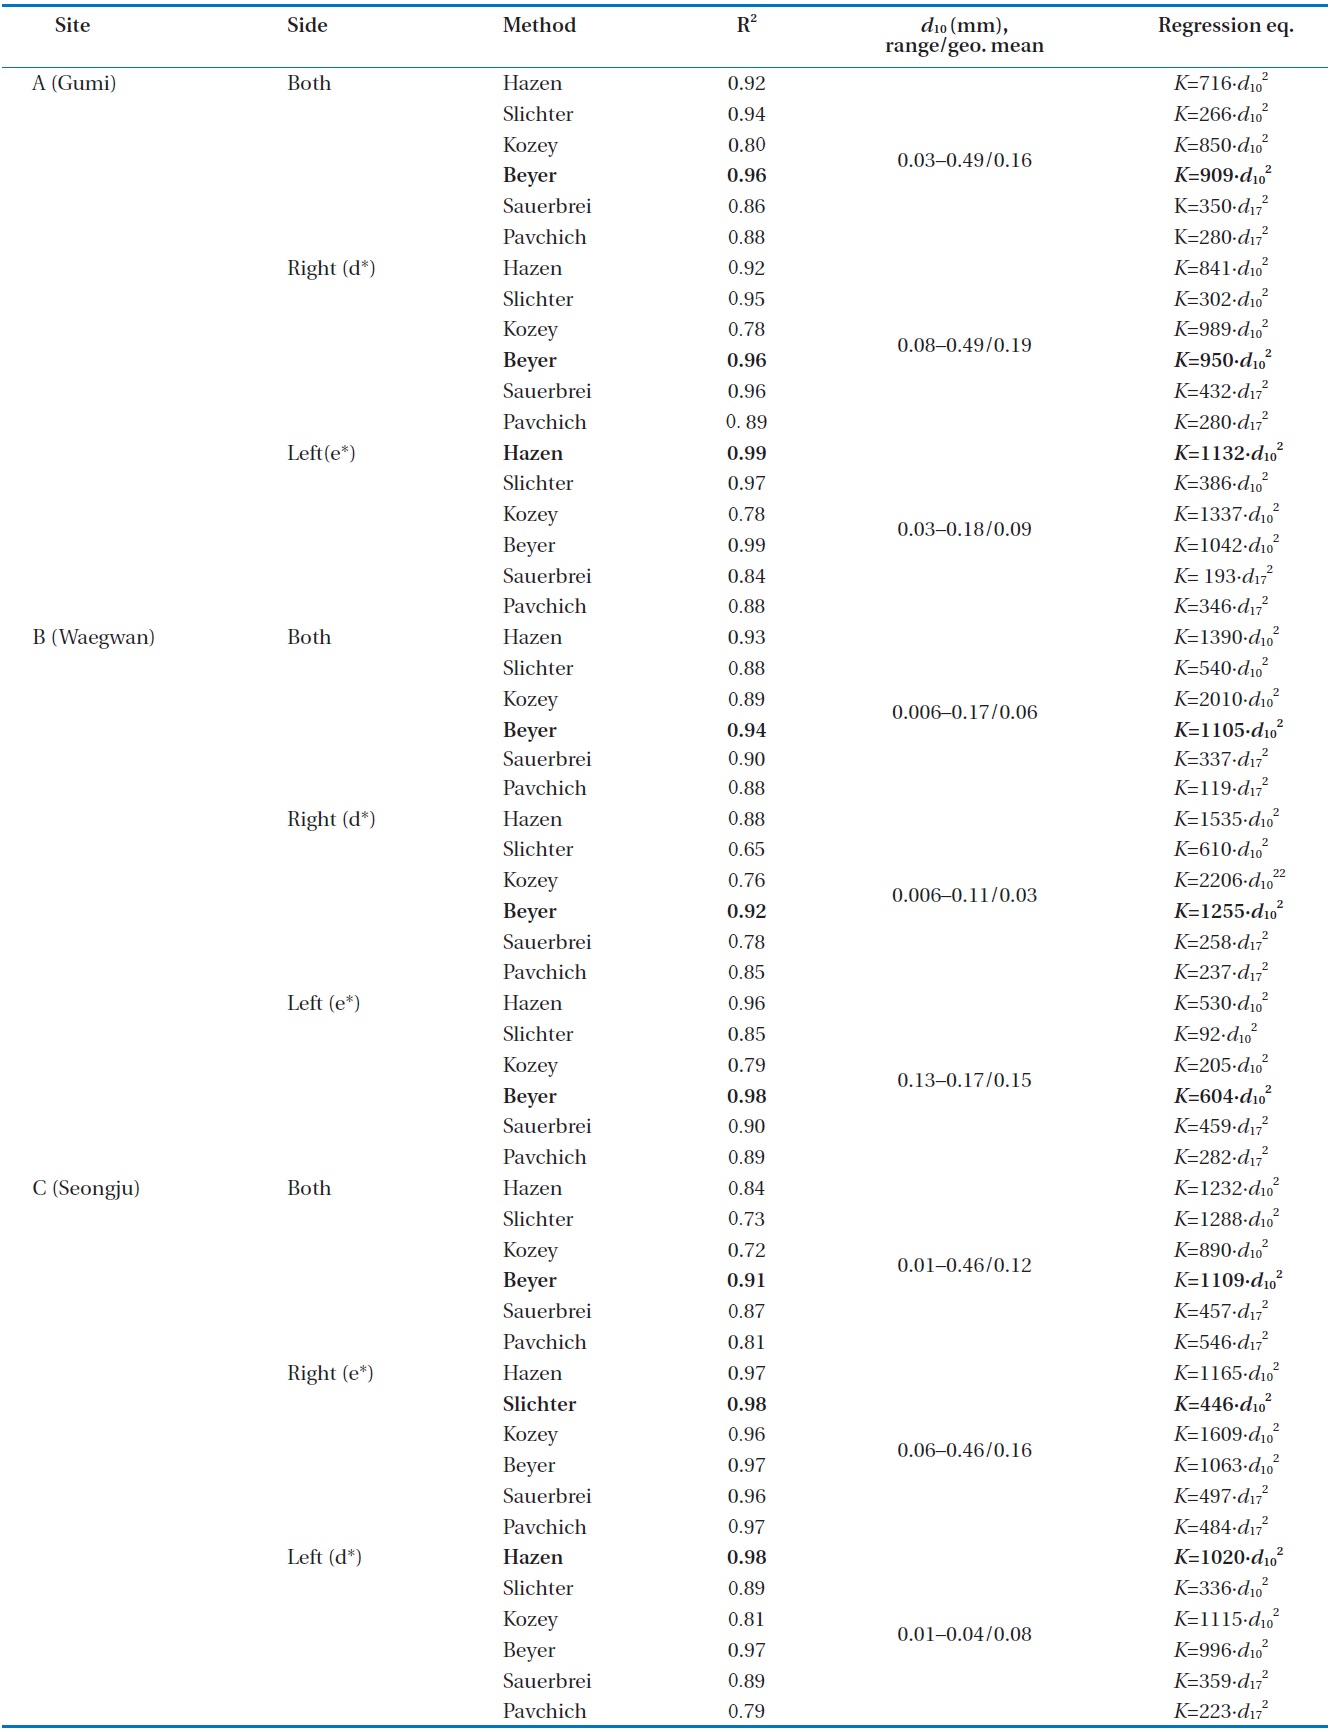
The K values were determined by using Eq. (1) on the basis of different parameters proposed by Hazen [8], Beyer [9], Slichter [10], Kozeny [11], Sauerbrei (cited in [14]), and Pavchich [15] (Table 1). The Hazen [8] formula is suitable under the condition that d10 ranges from 0.1 to 3 mm with a coefficient of uniformity (U) less than 5. The Beyer [9] formula is recommended for particles of both 0.06 < d10 < 0.6 mm and 1 < U < 20 [18]. The Kozeny [11] formula is adequate for large size sand. The Sauerbrei (cited in [14]) formula is commonly used for large particles within 0.5 mm, and the Slichter [10] formula is used for particles of 0.01< d10 < 5 mm.
Pumping tests were conducted on four pumping wells (W1, S2, S3, and S7) at a discharge rate of 14 m3d-1. The water levels at the pumped wells were measured by using pressure transducers in l-s increments; the measurement range of 10 m (Diver; Eijkelkamp Co., Giesbeek, The Netherlands). The pumping test analysis interpreted by the image theory determined the Nakdong
River as a constant head boundary. Transmissivity (T) was determined by using the best fitted model reported by Theis [20]. K was then obtained by dividing T by the saturated thickness of the fluvial deposits at the pumped wells. Slug tests were performed in 11 wells (G1, G2, G3, W1, S1, S2, S3, S4, S5, S6, and S7) and were analyzed with three unconfined aquifer solutions of Hvorslev [21], Bouwer and Rice [22], and the Kansas Geological Survey [23,24]. In the slug tests, a solid dummy with a length of 1.3m and diameter of 0.035 m was injected and removed to instantaneously raise and drop the groundwater levels. The displacement of groundwater levels were automatically measured by a data logger with a range of 10 m (Diver, Eijkelkamp Co.) until the recovery of its initial level (4.1?9.2 m); this was interpreted by AQTESOLV ver. 3.0 (HydroSOLVE Inc., Reston, VA, USA).
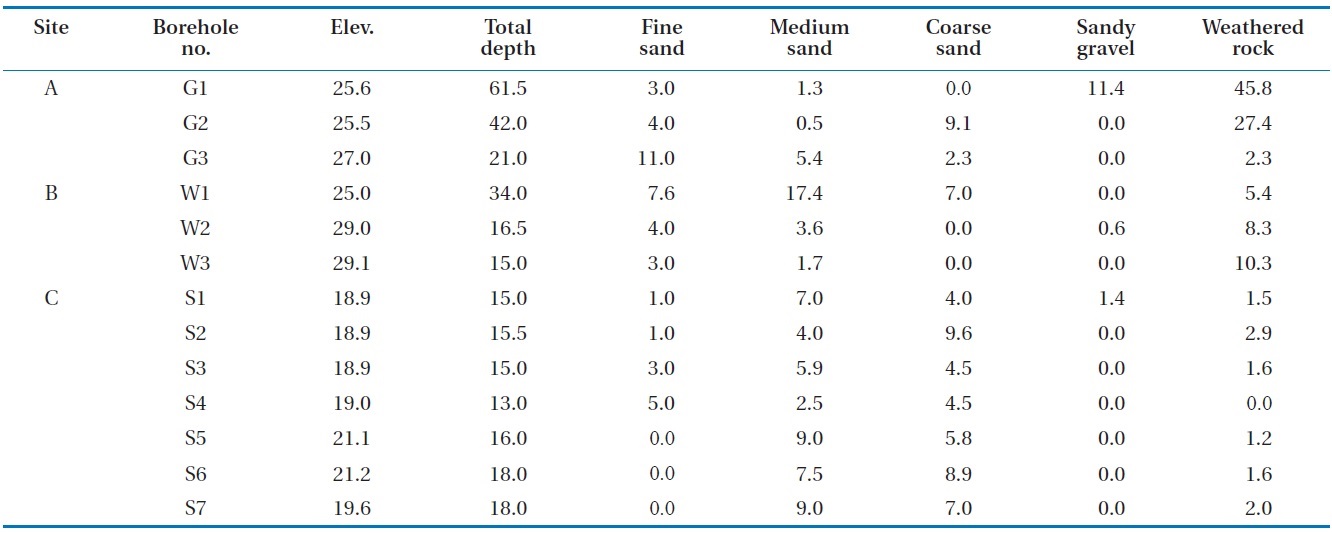
The lithologies of fluvial deposits at the three sites were determined on the basis of the drilling information and particle-size distribution (Table 2). According to the data of three boreholes (G1?G3), the geology at the Gumi bridge site (site A) is composed of fine sand, medium sand, coarse sand, and sandy gravel layers along with the weathered zone of Cretaceous sedimentary Nakdong Formation from the ground surface. The average thicknesses of fine sand, medium sand, and coarse sand layers are 6.0, 2.4, and 5.7 m, respectively. Borehole data (W1?W3) of the fluvial deposits at the Waegwan bridge site (site B) revealed fine sand, medium sand, coarse sand, and sandy gravel layers along with Cretaceous sedimentary Nakdong Formation from the ground surface. The average thicknesses of fine sand, medium sand, and coarsesand layers are 4.9, 7.6, and 6.4 m, respectively. The Nakdong Formation exists as a small body enclosed by Cretaceous biotite granite at Gumi bridge and Jurassic granite at Waegwan
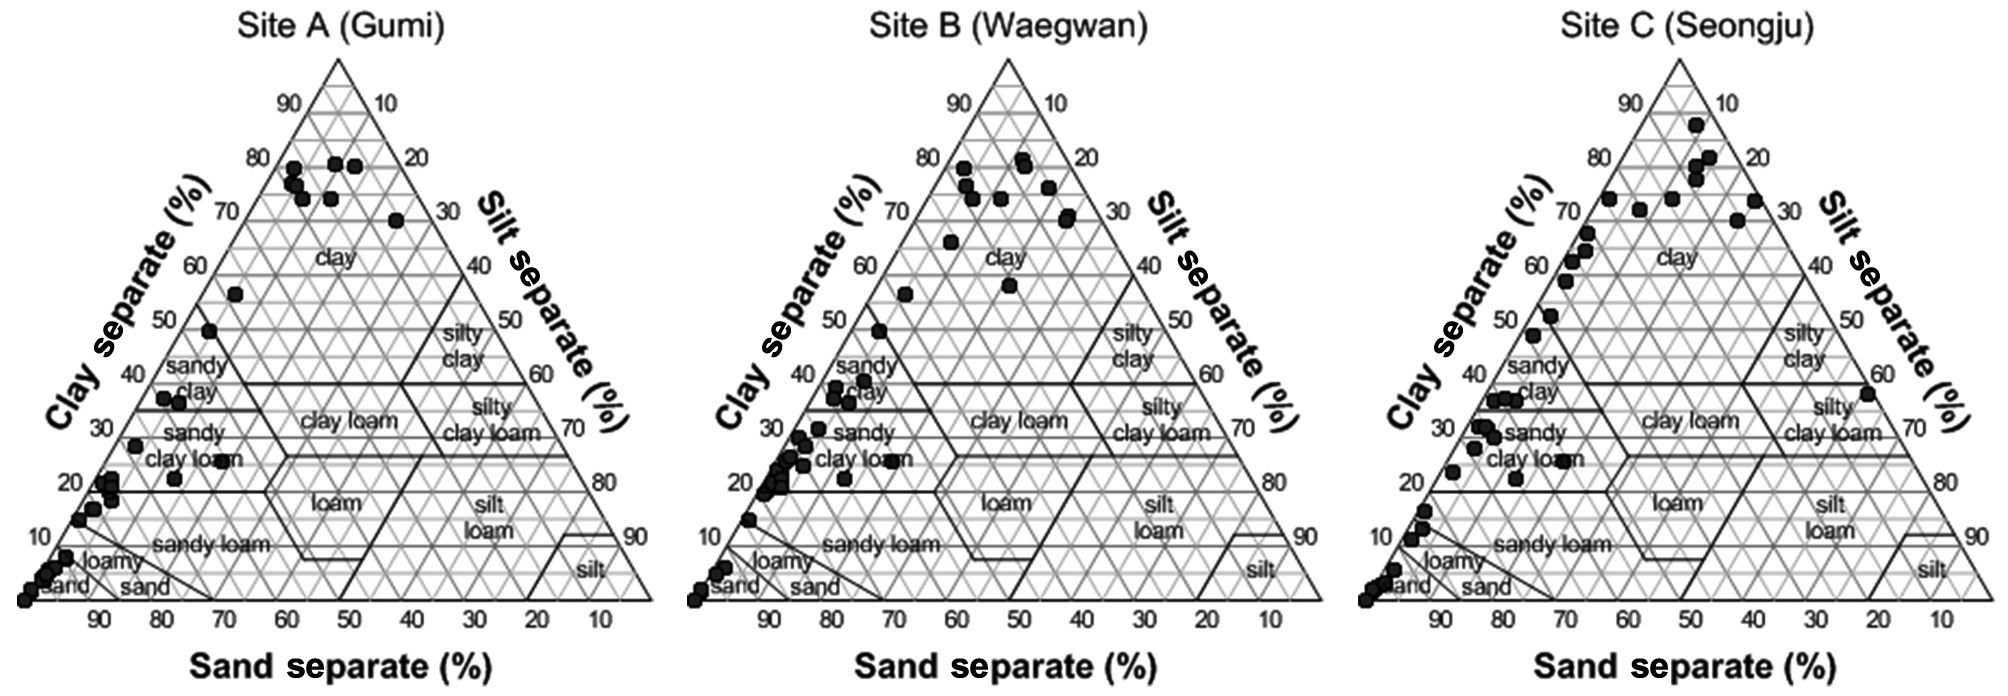
bridge. The data of seven boreholes (S1?S7) in the fluvial deposits at the Seongju bridge site (site C) revealed fine sand, medium sand, coarse sand, sandy gravel layers as well as weathered zone of Cretaceous sedimentary Hasandong Formation from the ground surface. The average thicknesses are 2.5, 6.4, and 17.8 m for fine sand, medium sand, and coarse sand layers, respectively. By the textural classification of the fluvial deposits at sites A, B, and C, the clay portion increases and the silt portion decreases from the upstream (site A) to the downstream (site C) [25] (Fig. 4). As noted in Fig. 4, fluvial deposits have a texture of sand to sandy clay at site A, sandy loam to clay at site B, and silty clay loam to clay at site C.
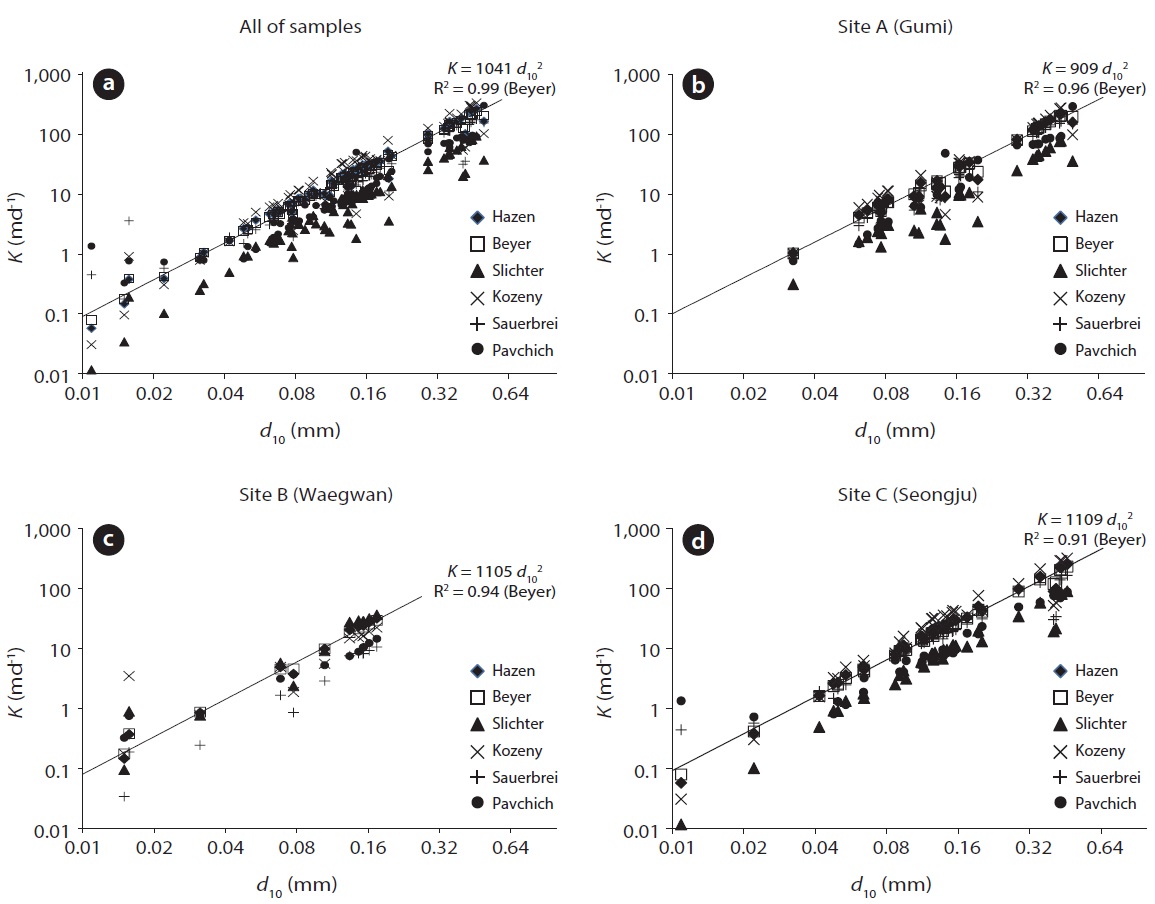
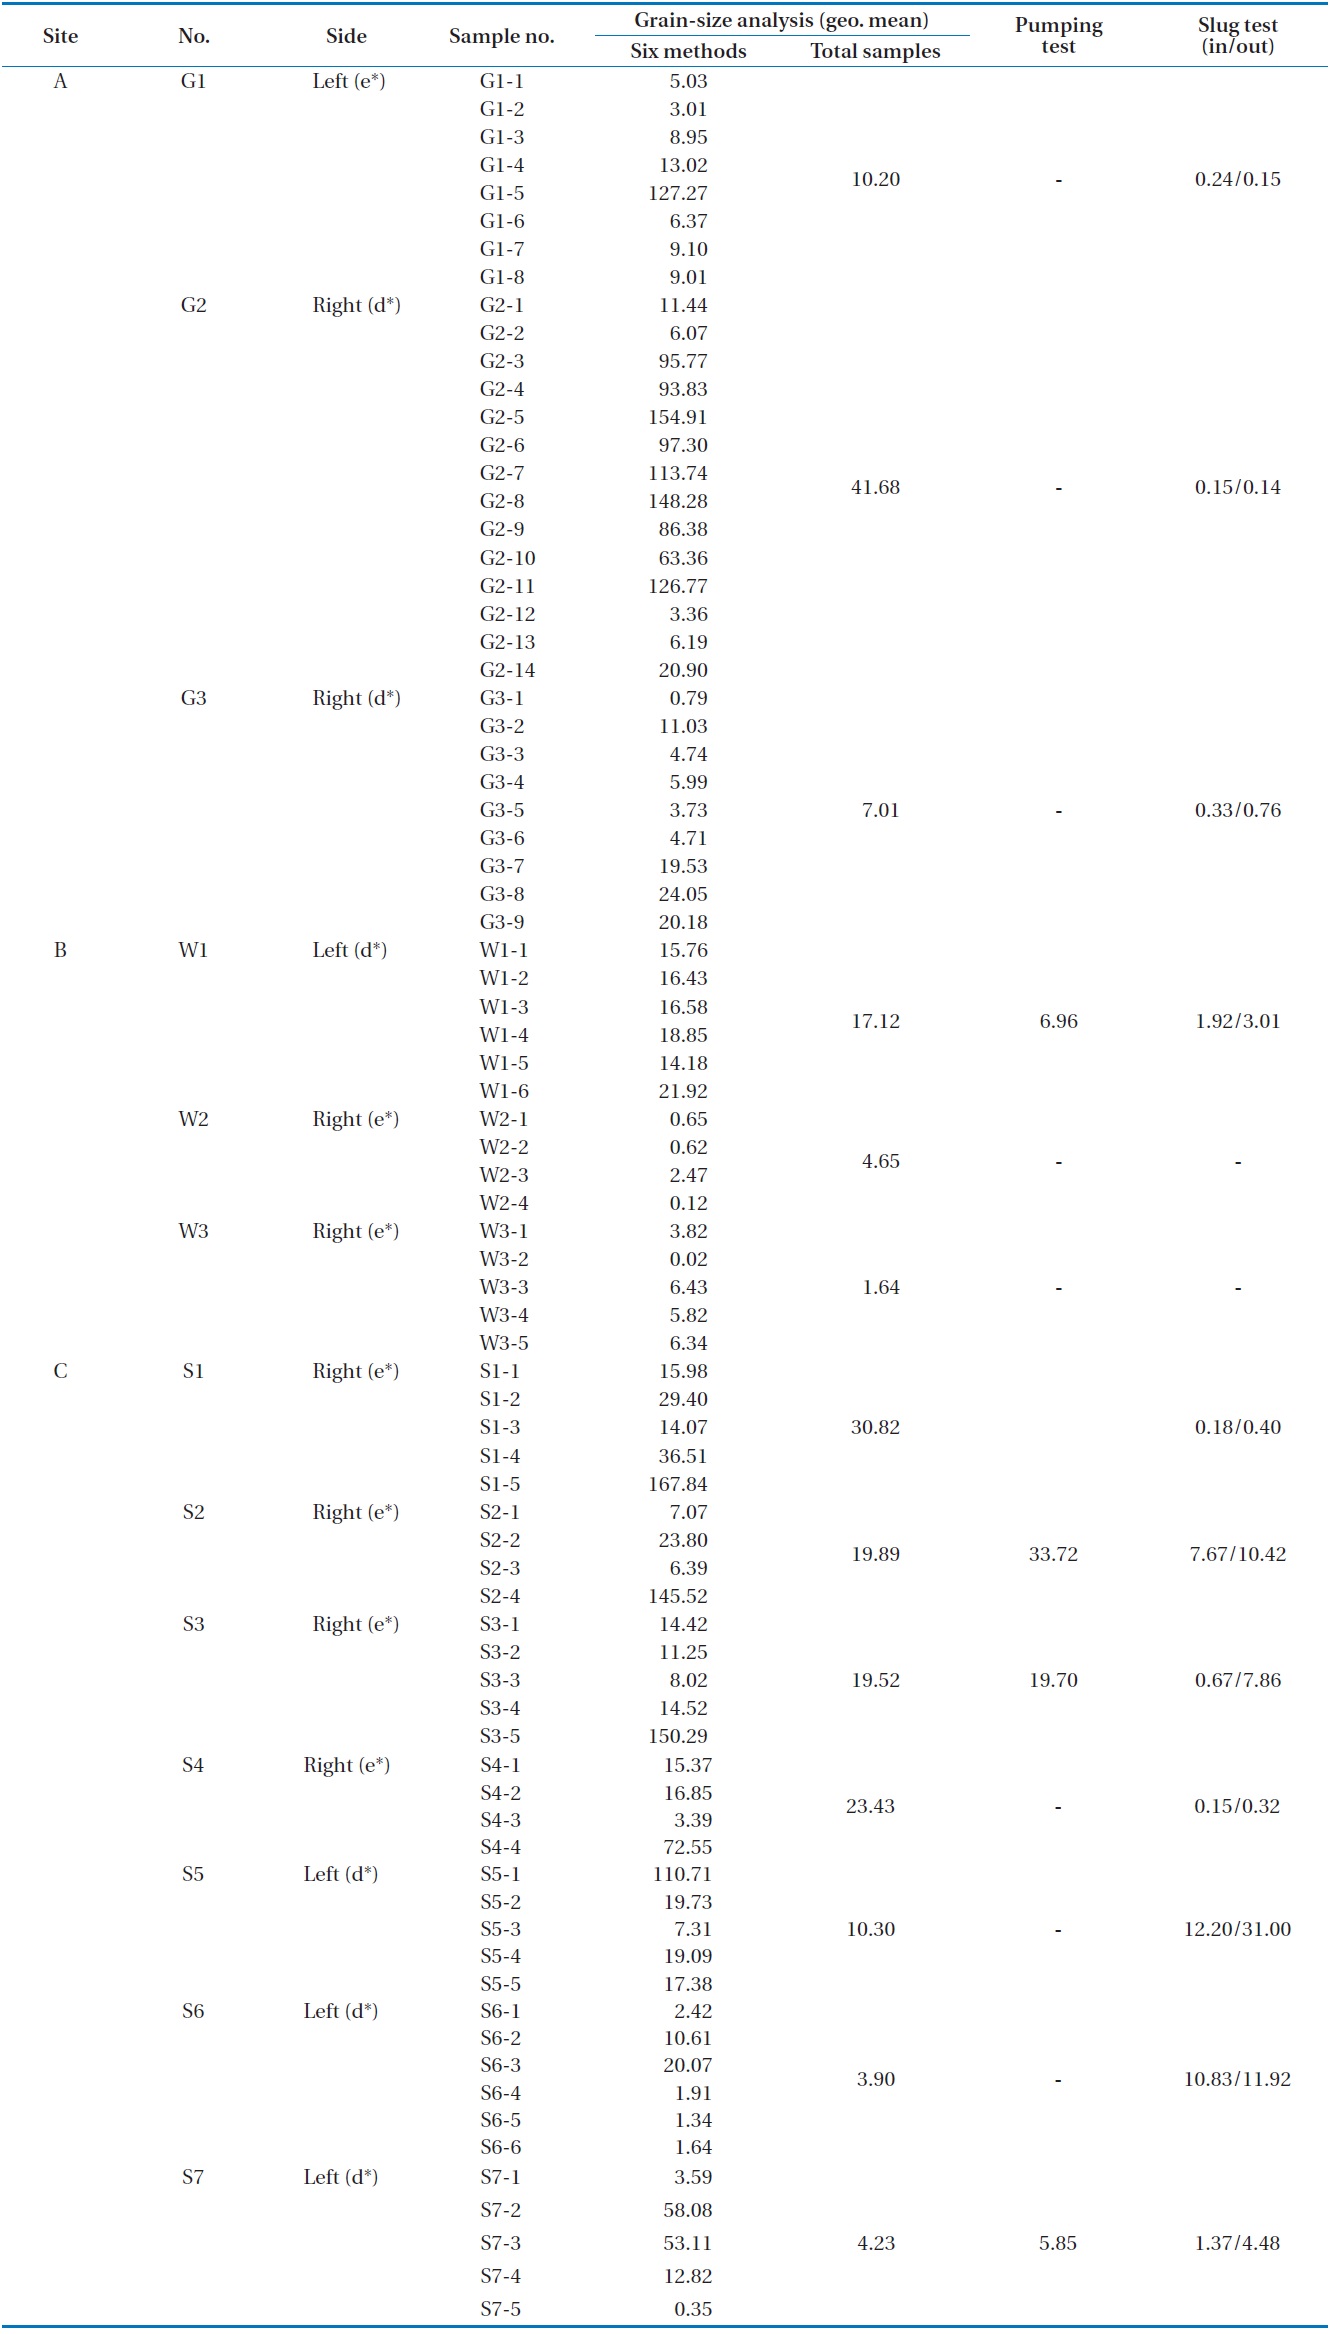
Eighty fluvial deposit samples from 13 boreholes (G1?G3, W1?W3, and S1?S7) were used for the grain-size analysis. The K values were determined by using the empirical relationships proposed by Hazen [8], Beyer [9], Slichter [10], Kozeny [11], Sauerbrei (cited in [14]), and Pavchich [15]. By using the six empirical formulae, the linear regression of K values versus the effective grainsize (d10) on the logarithmic scale produced markedly high correlation coefficients (Table 3). Moreover, the Beyer [9] method demonstrated the highest correlation coefficient at these sites. This good relationship between K values and d10 is
supported by the study of Salarashayeri and Siosemarde [26] in which d10 is a more dominant factor for the determination of K values compared to other particle sizes.
Fig. 5 shows the relationship of K values versus d10 on the loglog scale graph with the best regression line at each site. On the figure, the variation in K values with grain sizes from upstream to downstream of the Nakdong River slightly decreases with the increase of smaller particle portion. The range of K values was mostly larger on the erosion side than that on the deposition side. The d10 at sites A, B, and C were 0.20, 0.10, and 0.16 mm, respectively. The mean K values and d10 mostly decrease from upstream to downstream, with an exception at site B, owing to the increase in thickness of coarse sand.
A comparison of K values of the left and right banks at site A revealed 7.01 md-1 at borehole G3 on the left bank, and 10.20 md-1 at G1 and 41.68 md-1 at G2 on the right bank. At site B, K values were 17.12 md-1 at W1 on the left bank and 4.65 md-1 at W2, and 0.77 md-1 at W3 on the right bank. At site C, K values ranged from 3.90 md-1 (S6) and 10.30 md-1 (S5), with an average of 5.40 md-1 on the left bank, and from 19.52 md-1 (S3) to 30.82 md-1 (S1), with an average of 23.19 md-1 on the right bank. Therefore, coarser particles and higher K values were observed at the erosion side of
the river (left banks of sites A and B, and right bank of site C) than those at the deposition side, because the river flows with higher energy at the erosion side than that at the deposition side.
At the Gumi bridge site (A), K values of the fine sand layer ranged from 3.30 to 6.07 md-1 with a geometric mean of 4.29 md-1; K values of the medium sand layer ranged from 8.05 to 17.99 md-1 with a geometric mean of 10.67 md-1, and the geometric mean of K values of the coarse sand layer ranged from 67.6 to 91.5 md-1 with a geometric mean of 74.9 md-1. At the Waegwan bridge site (B), K values of the fine sand layer ranged from 0.27 to 0.60 md-1 with a geometric mean of 0.46 md-1, and K values of the medium sand layer ranged from 6.43 to 17.12 md-1 with a geometric mean of 10.49 md-1. At the Seongju bridge site (C), K values of the fine sand layer ranged from 0.19 to 21.03 md-1 with a geometric mean of 4.36 md-1; K values of the medium sand layer ranged from 12.82 to 89.62 md-1 with a geometric mean of 30.26 md-1, and the K values of the coarse sand layer ranged from 6.39 to 167.84 md-1 with a geometric mean of 24.96 md-1. The geometric mean of K (17.28 md-1) of the Gumi bridge site was the largest compared with 4.21 md-1 and 11.10 md-1 of the Waegwan bridge and Seongju bridge sites, respectively. This finding indicates that the coarse sand layer is thicker at the Gumi bridge than at the Waegwan and Seongju bridge sites.
The results of the grain-size analysis were compared with those of the pumping tests on four boreholes of site B (W1) and site C (S2, S3, and S7). Slug test analysis on eleven boreholes of site A (G1, G2, and G3), site B (W1), and site C (S1, S2, S3, S4, S5, S6, and S7) are shown in Table 4. The geometric means of the K values of each layer at each site were converted to that of total saturated thickness in order to compare the results of the pumping test analysis. At site B at borehole W1, the K value (17.32 md-1) was approximately 2.5 times larger than that of the K value determined by the pumping test (6.96 md-1). At site C, the K value (19.89 md-1) was smaller than that determined by the pumping test (33.72 md-1) at borehole S2; the K value (19.52 md-1) was similar to that determined by the pumping test analysis (19.70 md-1) at borehole S3. Further, the K value (4.23 md-1) was slightly smaller than that determined by the pumping test analysis (5.85 md-1) at borehole S7etric K means determined by the injection slug testing ranged from 0.15 md-1 (S4) to 12.20 md-1(S5); those by withdrawal slug testing ranged from 0.15 md-1 (G1) to 31 md-1 (S5) (Table 4). The K values determined by the injection slug testing were slightly smaller than those indicated by the withdrawal slug testing. This result may attribute to pore clogging in fine grains surrounding the borehole during the slug injection into the borehole in addition to the re-opening of pores during slug withdrawal [3]. The lower K values compared to those from other methods might be derived from the disturbance of sediment around the boreholes or by the clogging of the boreholes [27]. Further, the lower K values from the slug tests might be explained by an incomplete well development and then by a large undeveloped portion of the screen with a limited
Prenpermeable zone [24]. However, in these study sites, the K values of the slug tests were significantly lower than those of the grainsize analysis. The slug test represents the uppermost fine sand layer because water response due to the slug only reached the fine sand section of the fluvial deposits [3].
This study estimated K values, which were determined through the analyses of grain-size, pumping test, and slug test, by using eighty samples from fluvial deposits at Gumi, Waegwan, and Seongju bridge sites along the Nakdong River from upstream to downstream. The grain-size analysis was executed based on the formulae of Hazen, Beyer, Slichter, Kozeny, Sauerbrei, and Pavchich. Distinctly strong relationships between K values and d10 were obtained from the six formulae and the shape factor C ranged from 446 to 1255 (Table 3). In particular, the Beyer (R2 = 0.91?0.98), Hazen (R2 = 0.84?0.99) and Slichter (R2 = 0.65?0.98) methods showed an even stronger relationship [9,10]. On the basis of the linear regression line of the K values and d10 on the log-log scale, the K values from upstream (7.1?41.68 md-1 with d10 = 0.09?0.19 mm) to downstream (3.90?30.82 md-1 with d10 = 0.08?0.16 mm) slightly decreased, indicating an increasing tendency of the percentage of smaller particles. Furthermore, the range of the effective grain sizes was mostly larger at the erosion side (0.09?0.16 mm with a geometric mean of 0.13 mm) than that at the deposition side (0.03?0.19 mm with a geometric mean of 0.08 mm).
In addition, the results of the grain-size analysis were also compared with those determined by the pumping tests at four boreholes (W1, S2, S3, and S7) and slug tests at eleven boreholes (G1, G2, G3, W1, S1, S2, S3, S4, S5, S6, and S7). The K values of the slug tests (0.15?31.00 md-1) lower than those of the grain-size analysis (1.64?41.68 md-1) and pumping test (5.85?33.72 md-1) represent the uppermost fine sand layer because the water response due to the slug only reached the fine sand section of the fluvial deposits.
Even if there exists differences in the K values by using the grain-size analyses, pumping tests and slug tests, the grain-size analysis may be used as an effective auxiliary tool to determine the K values of fluvial deposits because the K values by the grainsize analyses are positioned between the K values of the pumping tests and those of the slug tests.


![Geological map of the study area, slightly modified from [16, 17].](http://oak.go.kr/repository/journal/12493/E1HGBK_2013_v18n3_129_f002.jpg)
![Textural classification of fluvial deposits at sites A, B, and C [25].](http://oak.go.kr/repository/journal/12493/E1HGBK_2013_v18n3_129_f004.jpg)