Marine radars are affected by sea and rain clutters, which can make target discrimination difficult. The clutter standard deviation and improvement factor are applied using multiple parameters―moving speed of radar, antenna speed, angle, etc. When a radar signal is processed, a Data Matrix Bank (DMB) filter can be applied to remove sea clutters. This filter allows detection of a target, and since it is not affected by changes in adjacent clutters resulting from a multi- target signal, sea state clutters can be removed. In this paper, we study the level for clutter removal and the method for target detection. In addition, we design a signal processing algorithm for marine radars, analyze the performance of the DMB filter algorithm, and provide a DMB filter algorithm design. We also perform a DMB filter algorithm analysis and simulation, and then apply this to the DMB filter and cell-average constant false alarm rate design to show comparative results.
Marine radars with an S-band of 3 GHz and X-band of 10 GHz are currently used worldwide. However, marine radars are significantly affected by sea and rain clutters, so difficulties emerge when attempting to discriminate targets from the clutters. Therefore, precise detection technology is needed for target classification; in other words, marine radars need to correctly distinguish between targets and clutters. A number of methods are currently available to do this; for example, marine radars can remove low frequency clutters by applying Gaussian distribution in the marine radar environment. Nevertheless, improvements in marine radar target detection capabilities are still needed to tackle the high clutter region, but successfully overcoming marine radar signal processing problems requires, high computing capacity and large amount of memory.
The cell-average constant false alarm rate (CA-CFAR) algorithm continuously calculates the average value based on previously measured values. However, the CA-CFAR is inefficient in the case of small size targets and nonmoving Doppler. And it also experiences difficulties in target detection with high frequency clutters. The CA-CFAR is also inefficient in cases where large changes in noise occur. In this paper, we propose a Data Matrix Bank (DMB) filter algorithm for improving target detection and clutter removal. The wave height of the sea state can be represented by the size of the standard used to measure wave height, as shown in Table 1. The sea states shown in Table 1 are used by the World Meteorological Organization. Sea state can be classified depending on the Douglas scale, Hydrographic Office scale, and Beaufort scale. Wind speed is affected by the clutter size. The distance depends on how far and how fast the wind blows, how it advances, and the impact has [1].
[Table 1.] Sea states used by the World Meteorological Organization [2]
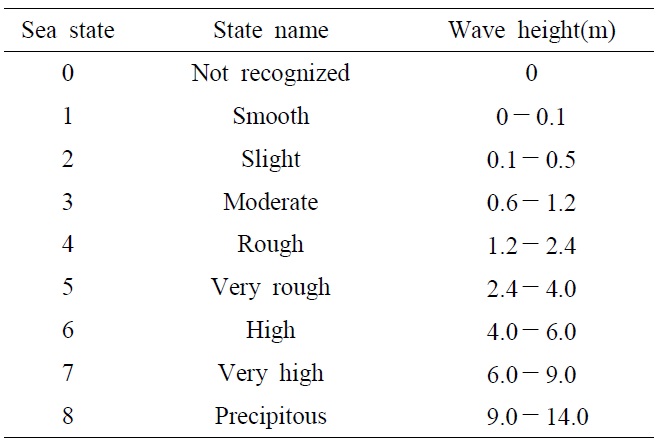
Sea states used by the World Meteorological Organization [2]
[Table 2.] Clutter standard deviation (SD) of sea clutter [3]
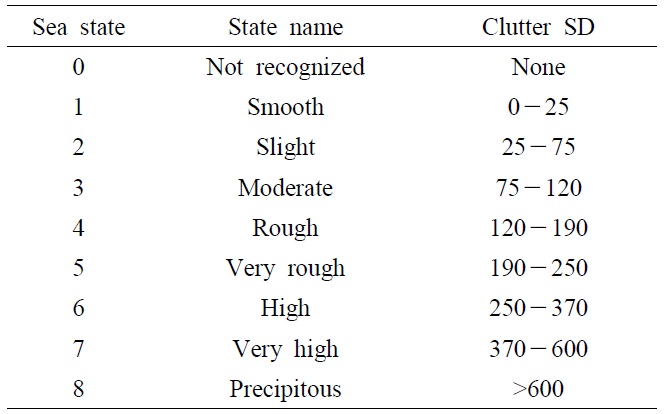
Clutter standard deviation (SD) of sea clutter [3]
Table 2 represents the clutter spectrum hitting the surface of sea, which reflects the standard deviation of the clutter spectrum. The CFAR algorithm has a fixed threshold that determines this simply by considering only the noise level of the surrounding clutters. The CFAR can have a variable adaptive threshold depending on the environment. The adaptive threshold CFAR isative of the CA-CFAR; and the order statistics constant false alarm rate (OS-CFAR). The CA-CFAR consumes a lot of memory because it works by calculating around the average. Detection performance is greatly lowered because it may occur, for example, in situations such as when an adjacent interference target is present with multiple targets. Clutter removal performance will be degraded in accordance with changes that depend on the target size signal and noise. Here, a DMB filter is proposed to resolve these problems.
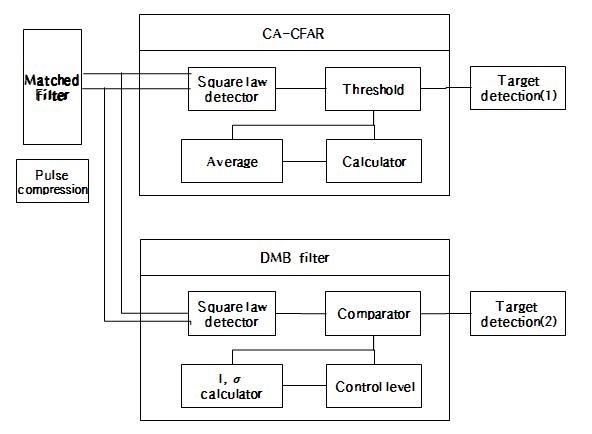
We added a comparator and database in Fig. 2 to allow a more systematic decision of the real targets. The database, consisting of improvement factors and standard deviations for sea and rain clutters, was established using verified results referred from [2-5]. Tables 1 ? 5 show these data that clarify the clutters used in this work. The amplitudes of targets become larger than those of the clutters presented in our previous work [6] due to the more accurate algorithm used in the present work. Therefore, any targets can be detected more accurately using the improved DMB algorithm which therefore represents an enhancement of our previous work [6].
The improvement factor and the clutter standard deviation can be obtained using the return frequency from sea. The Doppler frequency changes the clutter standard deviation along with the moving speed of the radar, antenna speed, angle, etc. The IEEE definition of an improvement factor (I) reads: the signal-to-clutter power ratio at the output of the clutter filter divided by the signal-to-clutter power ratio at the input to the clutter filter, averaged uniformly over all target radial velocities of interest. The improvement factor can be expressed as in Eq. (1) [7].
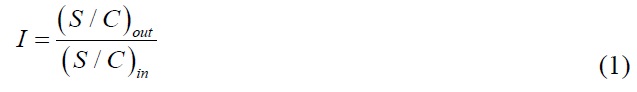
where

where
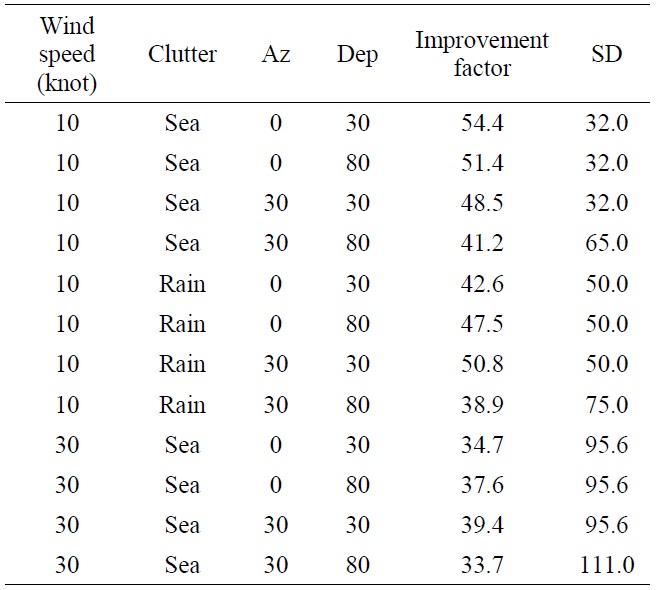
Basic modes [4, 5]
[Table 4.] Low speed modes [4, 5]
Low speed modes [4, 5]
[Table 5.] High speed modes [4, 5]
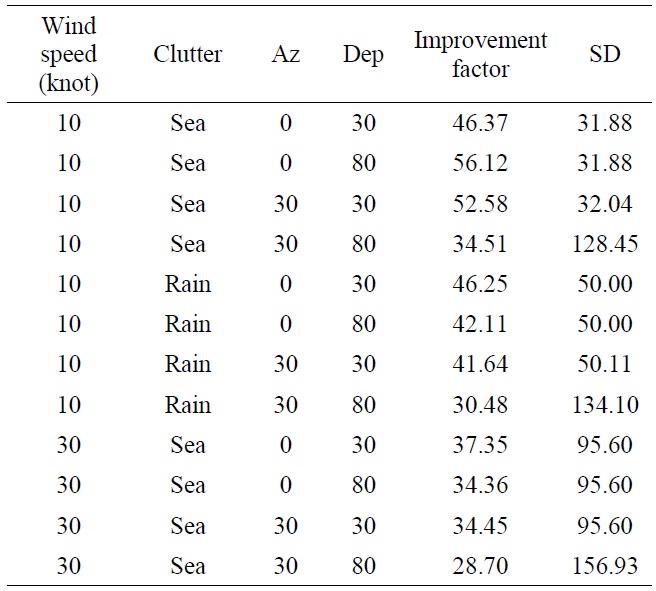
High speed modes [4, 5]
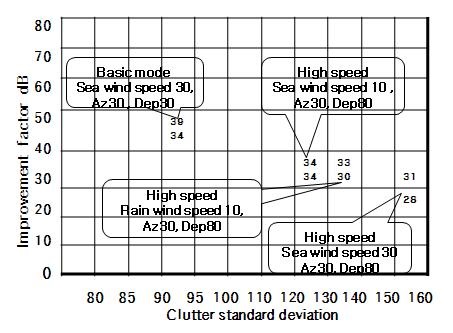
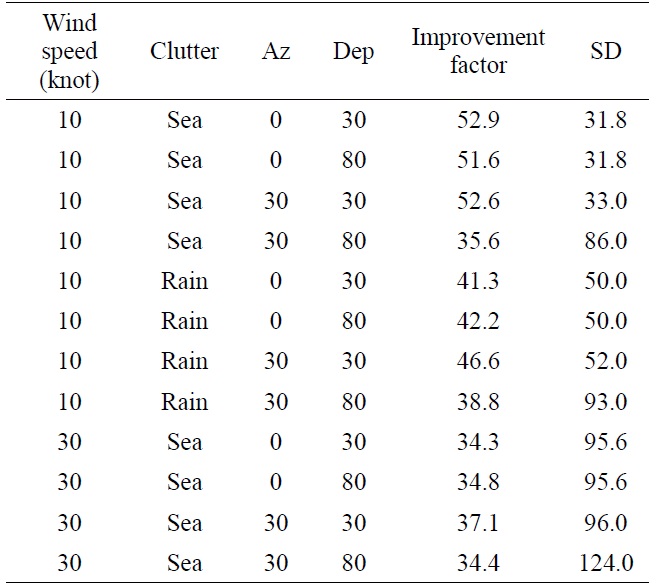
Marine radars generally have basic, low speed, and high speed modes. Tables 3?5 show that the low speed mode has a small clutter standard deviation, but the high speed mode has an increasing clutter standard deviation, while the size of improvement factor is constant [8,9]. When the angle of antenna (depression) is 30°, the clutter standard deviation is kept almost constant. When the angle of the antenna (depression) is increased to 80°, the clutter standard deviation somewhat increases by about 30 to 40.
The DMB filter, a new target detection technology, is proposed for this study. It uses an I?
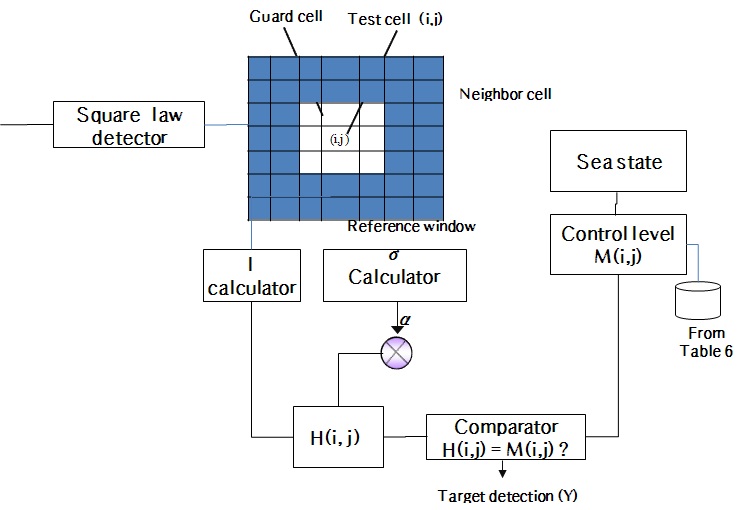
A DMB filter block diagram is shown in Fig. 2. The DMB filter uses the improvement factors and clutter standard deviations both from measured data and pre-calculated data base as in Table 6. The DMB filter is configured to compare
[Table 6.] Values for the DMB MAP database (sea) [4]
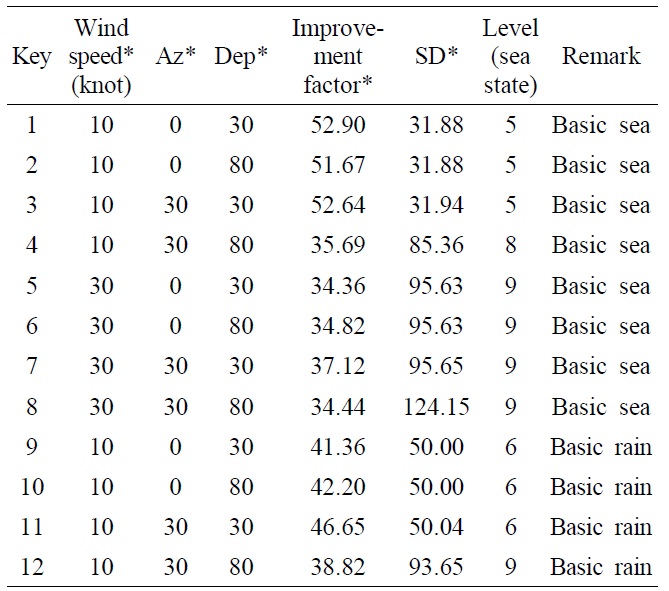
Values for the DMB MAP database (sea) [4]
The data indicated with * in Table 6 are brought from Tables 3?5 showing sea and rain clutters. These data are used for comparison with results using the DMB method proposed in this work. The key no. 1 to 7 are measures of sea clutters. The key no. 8 to 12 are measures of rain clutters. The level (=sea state) is classified using standard deviation as seen in Table 2 (the key value for the properties of the clutter stored attribute value is used to verify the data for one record or one unit clutter. A single record or a data retrieval clutter is one of the means used to vefy the primary key).
1.1 Reference Window
The reference window in Fig. 2 shows a two-dimensional data vector of a range of cells measured at a specific time. The guard cell is data located next to the test cell. The neighbor cells are data located next to the guard cell, indicated in grey in Fig. 2.
1.2 Improvement Factor (I) and Clutter Standard Deviation (σv) Calculator
Eq. (3) shows

Where
1.3 Sea State
The user selects the target for detection. The user should select the type of clutter to get rid of the radar clutters.
1.4 Control Level
The control level is determined by the target value for improvement factor and clutter standard deviation by the user. The antenna speed, the speed of radar, the moving speed of radar, the speed of wind, the antenna azimuth angle, and the depression angle are also used for deciding this level.
1.5 Comparator
The control level is compared with
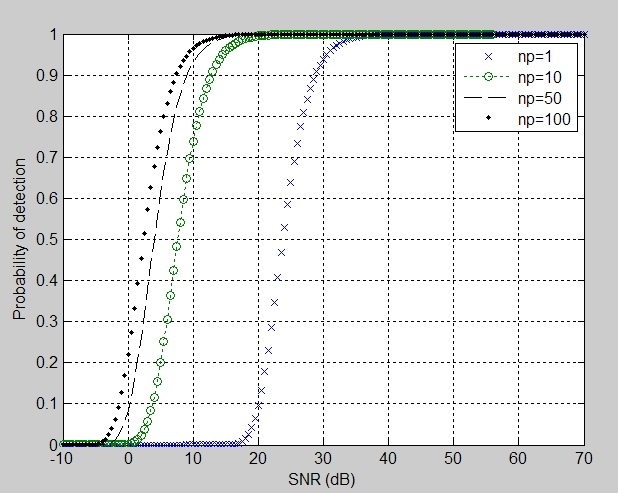
The probabilities of detection and false alarm are calculated to indicate how to obtain the correct values from the following procedures. The probability of detection (expected value of
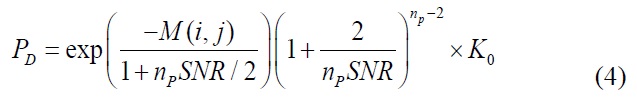
where
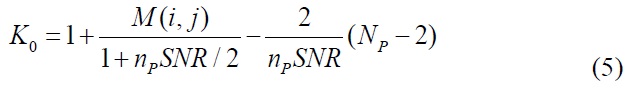
Where
Radar specifications are applied in order to validate the approach proposed in this paper as shown in Table 7, with the performance of the semiconductor solid state power amplifier radar. The radar specifications in Table 7 are decided by following the procedures in applying synthetic targets and a clutter matched filter.
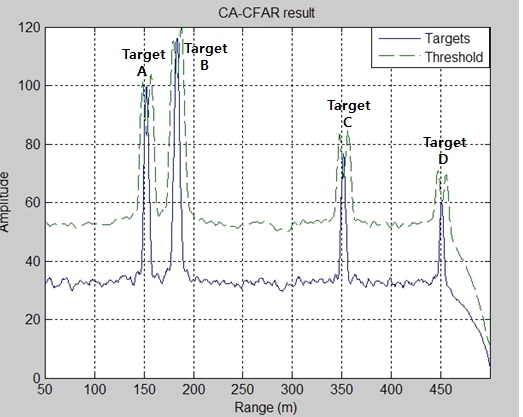
First, a conventional CFAR target detection is used for comparison in Fig. 5. Target detection is used to calculate
[Table 7.] Design specifics of the proposed radar
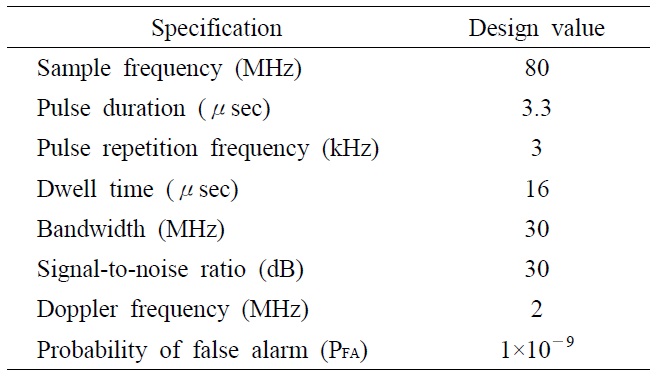
Design specifics of the proposed radar
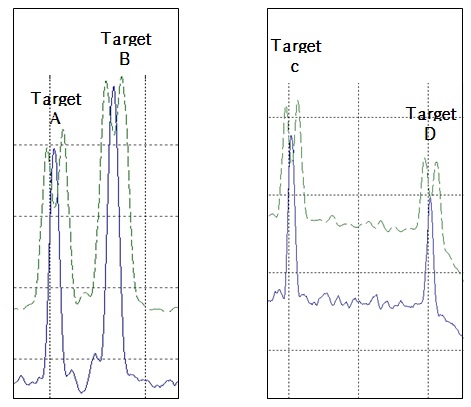
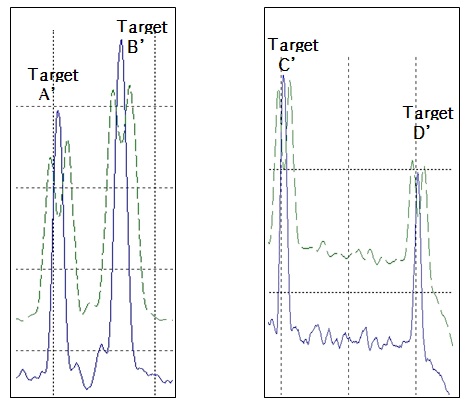
The target detection in CA-CFAR is weak as shown in Fig. 6, which shows that detection is very difficult because of the adjacent targets. The average of magnitude of the surrounding cells is lower than the threshold, as illustrated in Fig. 6. Fig. 7 enlarges the target surroundings based on CA-CFAR, where all targets are below the threshold.
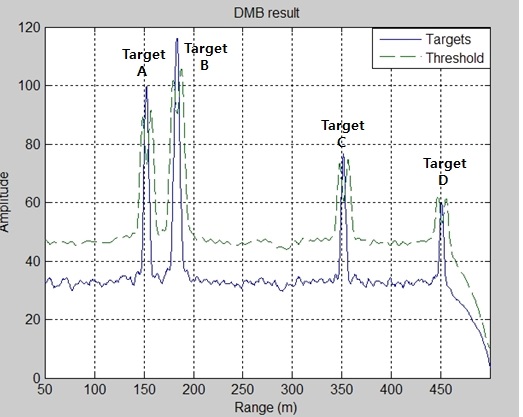
Fig. 8 shows simulation results based on the proposed DMB filter. The DMB filter makes target detection possible, as shown in Fig. 8. Fig. 9 also shows target surroundings for the DMB filter, which makes the targets detectable since the targets are above the threshold.
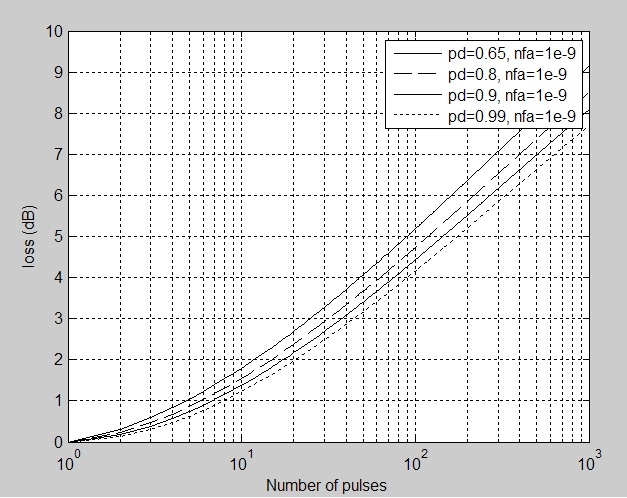
Fig. 8 shows the performance of the proposed DMB filter. In order to remove any clutter from moving targets, we have to store the data in a standard DMB filter database. The improvement factor and clutter standard deviation are calculated, and used to perform clutter removal and target detection. Target detection is easy in a high sea level and high-frequency components of clutter can be detected at the same time. This method does not consume much memory, and can detect a target using the clutter signal. The probability of detection and loss rate for this DMB filter are shown in Figs. 3 and 4. The DMB filter works well in removing the effects interference signals of adjacent cells from multiple environments, as shown in Fig. 8.
Sea waves and rain are studied in order to remove clutter and to determine better methods for target detection. The DMB filter is unaffected by multi-target signal changes in the adjacent signal. Detection is accurate, as shown by mathematical theory and through a simulation. Marine radar performance ensures a highly capable DMB filter algorithm for signal processing, algorithm design, and simulation. The designed radar specifications using the DMB filter and CA-CFAR algorithm are applied to compare the performance indicators. A significantly improved performance is observed over CA-CFAR target detection when applying the proposed DMB filter.

![Sea states used by the World Meteorological Organization [2]](http://oak.go.kr/repository/journal/12474/E1ELAT_2013_v13n3_151_t001.jpg)
![Clutter standard deviation (SD) of sea clutter [3]](http://oak.go.kr/repository/journal/12474/E1ELAT_2013_v13n3_151_t002.jpg)
![Basic modes [4, 5]](http://oak.go.kr/repository/journal/12474/E1ELAT_2013_v13n3_151_t003.jpg)
![Low speed modes [4, 5]](http://oak.go.kr/repository/journal/12474/E1ELAT_2013_v13n3_151_t004.jpg)
![High speed modes [4, 5]](http://oak.go.kr/repository/journal/12474/E1ELAT_2013_v13n3_151_t005.jpg)

![Values for the DMB MAP database (sea) [4]](http://oak.go.kr/repository/journal/12474/E1ELAT_2013_v13n3_151_t006.jpg)