A new explanation, using exponential functions, is given for the S-shaped functional relation between the mean citation score and the proportion of top 10% (and other percentages) publications for the 500 Leiden Ranking universities. With this new model we again obtain an explanation for the concave or convex relation between the proportion of top 100θ% publications, for different fractions of θ.
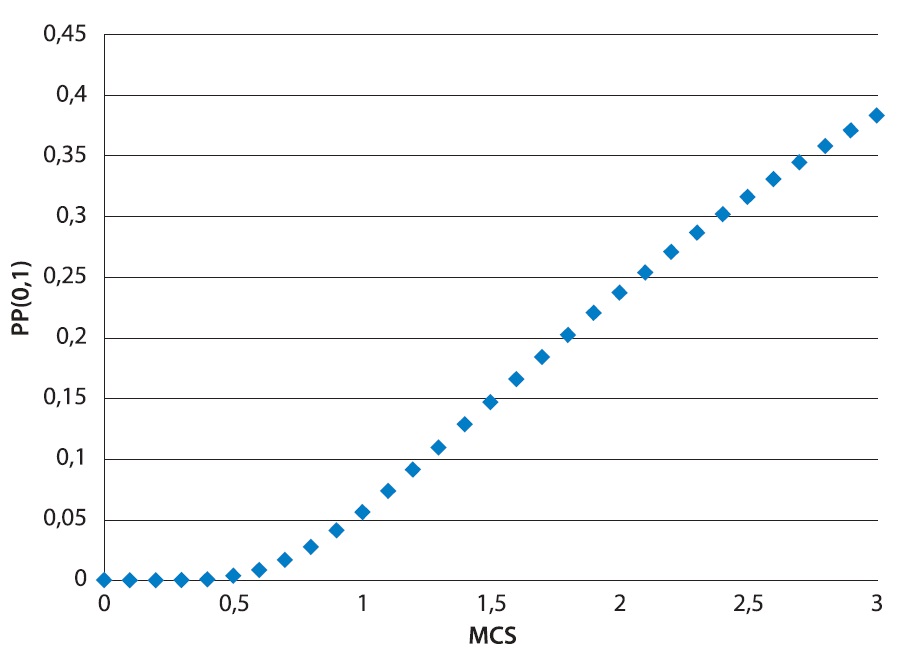
For 500 universities (from 41 countries) from the Leiden Ranking 2011/2012 one observes in Waltman et al. (2012) the relation between the mean normalized citation score (MNCS) and the proportion of top 10% publications (PPtop10%).
Upon specifying a field, MNCS is the mean number of citations of the publications of a university in this field (normalized in several ways ? see Waltman et al.). PPtop10% is the proportion (fraction) of the publications of a university in this field that, compared with other publications in this field, belong to the top 10% most frequently cited.
In Waltman et al. one finds an S-shaped relation between PPtop10% and MNCS: first convex then concave (see their Fig. 2). Allowing some other percentages, Waltman et al. find a convex relation between PPtop10% (as abscissa) and PPtop5% (as ordinate) and a concave relation between PPtop10% (as abscissa) and PPtop20% (as ordinate) ? again see their Fig. 3.
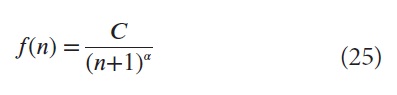
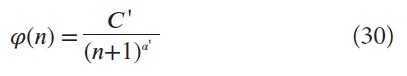
In Egghe (2013) we explained all these regularities using the shifted Lotka function
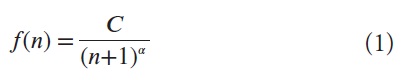
where C > 0,
where
For general fractions
where
From this model we proved, for any fractions
which is an explanation of the convex and concave graphs in Waltman et al.: concave if
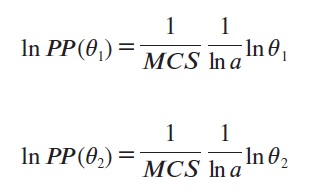
In this paper the same problems are studied: explaining the S-shaped relationship between MCS and PP (
where
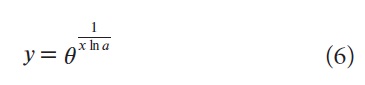
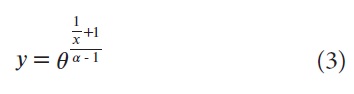
which is a clearly different function when compared with (3). But also this regularity explains the one found (empirically) in Waltman et al. since (6) is also Sshaped.
Remarkably, in the third section, using (6) for two fractions
The paper closes with a conclusion and open problems section.
2. EXPLANATION OF THE RELATION BETWEEN MCSAND PP(θ)
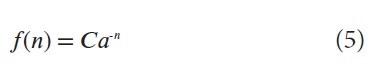
As indicated in the introduction we use the exponential function
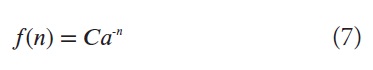
denoting the continuous version of the number of publications with
For a university we use the exponential function
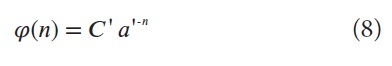
(
As noted by one referee, the fact that, per university, we use (8) with
Denote by
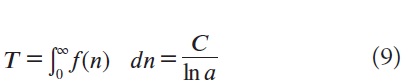
(since
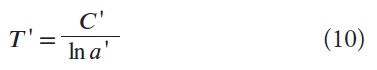
Denote by
which is easily seen using partial integration, by the fact that
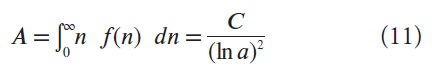
Similarly we have
By definition of MCS, being the average number of citations per publication of a university, we have
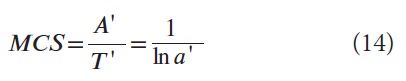
, using (10) and (13).
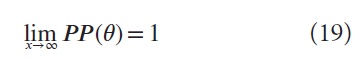
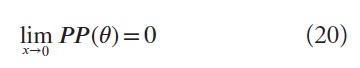
We first determine
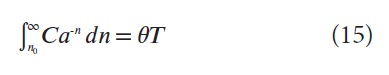
From (15) it follows that
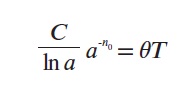
and by (9) we have
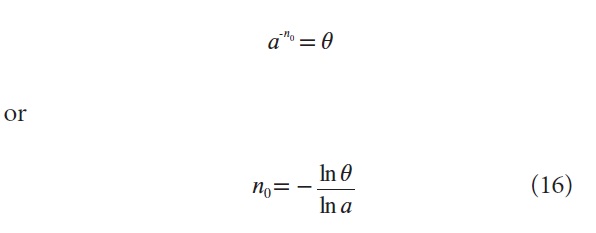
which is a positive number because 0<
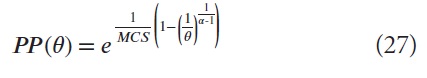
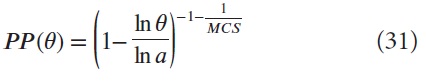
Then the university proportion in these top 100
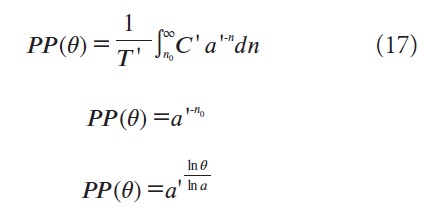
(by (16))
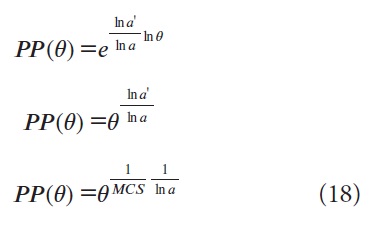
(by (14)) or the function (6). This is an increasing function (since 0<
and
The number
3. EXPLANATION OF THE RELATION BETWEEN ANY TWO VALUES OF PP(θ1) AND PP(θ2)
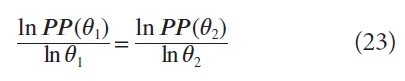
For any two fractions
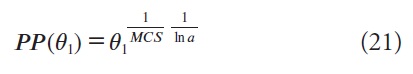
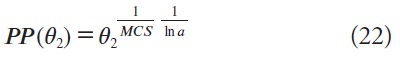
Hence
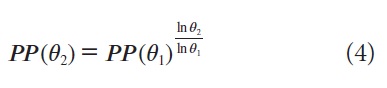
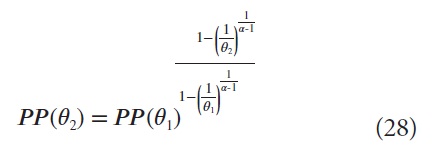
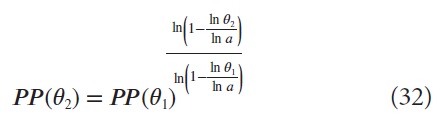
from which it follows that for any two fractions
hence
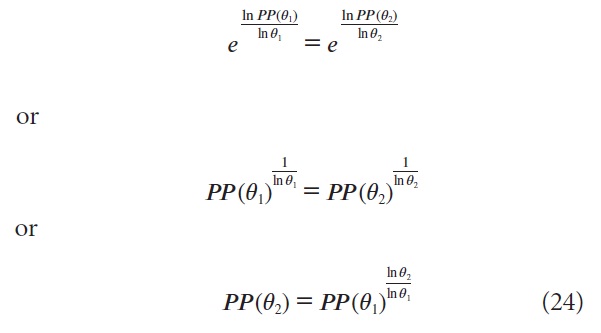
which is (4).
As already remarked in the introduction, this relation is the same as the one found in Egghe (2013) where the shifted Lotka function was used, a remarkable fact!
We have derived that (since 0<
So (24) is valid when
We take
(
(
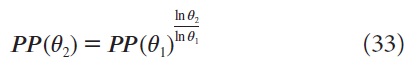
From the method in this section we find, for any two fractions
which is, clearly, not the function (24).
We take
(
(
From the method in this section we find, for any two fraction
which is, clearly, not the function (24).
4. CONCLUSIONS AND SUGGESTIONS FOR FURTHER RESEARCH
Experimental regularities in Waltman et al. (2012) are proved mathematically in this paper. Using the exponential function we proved the S-shaped functional relation between the mean citation rate and the proportion of top 100
With this new model we could reprove the function (obtained in Egghe (2013))
for the relation between two
The importance of this paper is that the assumption of a simple exponential function (5) leads to an explanation of several regularities in Waltman et al.
We state as an open problem: can the S-shape in Waltman et al. for the relation between the mean citation rate and the proportion of top 100
Also the following is an open problem: characterise the functions