The present investigation aimed at examining if post-cancer treatment with a potentized homeopathic drug, Condurango 30C, which is generally used to treat oesophageal cancer, could also show an ameliorating effect through apoptosis induction on lung cancer induced by benzo[a]pyrene (BaP) in white rats (Rattus norvegicus).
Lung cancer was induced after four months by chronic feeding of BaP to rats through gavage at a dose of 50 mg/kg body weight for one month. After four months, the lung-cancer-bearing rats were treated with Condurango 30C for the next one (5th), two (5th-6th) and three (5th-7th) months, respectively, and were sacrificed at the corresponding time- points. The ameliorating effect, if any, after Condurango 30C treatment for the various periods was evaluated by using protocols such as histology, scanning electron microscopy (SEM), annexinV-FITC/PI assay, flow cytometry of the apoptosis marker, DNA fragmentation, reverse transcriptase-polymerase chain reaction (RT-PCR), immunohistochemistry, and western blot analyses of lung tissue samples.
Striking recovery of lung tissue to a near normal status was noticed after post-cancerous drug treatment, as evidenced by SEM and histology, especially after one and two months of drug treatment. Data from the annexinV-FITC/PI and DNA fragmentation assays revealed that Condurango 30C could induce apoptosis in cancer cells after post-cancer treatment. A critical analysis of signalling cascade, evidenced through a RT-PCR study, demonstrated up-regulation and down-regulation of different pro- and anti-apoptotic genes, respectively, related to a caspase-3-mediated apoptotic pathway, which was especially discernible after one-month and two- month drug treatments. Correspondingly, Western blot and immunohistochemistry studies confirmed the ameliorative potential of Condurango 30C by its ability to down-regulate the elevated epidermal growth factor receptor (EGFR) expression, a hallmark of lung cancer.
The overall result validated a positive effect of Condurango 30C in ameliorating lung cancer through caspase-3-mediated apoptosis induction and EGFR down-regulation.
Lung cancer is a leading cause of death worldwide. Among different types of lung cancers, non-small-cell lung cancer (NSCLC) is the most common type (85%) [1]. Cigarette smoking is the primary cause of lung cancer. Benzo[a]pyrene (BaP) is a prototype of the polycyclic aromatic hydrocarbons (PAHs) found in cigarette smoke; it induces lung tumors [2]. BaP can increase cell proliferation and DNA adduct formation to induce lung cancer [3]. Surgical resection is the only treatment for patients with stage I or II NSCLC whereas patients with later stages are treated with combinations of surgery, chemotherapy, and radiation therapy, all of which have significant side effects [4].
Apart from conventional therapies, complementary and alternative medicines (CAMs) are now being used to combat cancer because of their lesser toxic side effects [5]. Homeopathic medicines are being used as major alternatives for various ailments, including cancer. Earlier we reported the anti-cancer potentials of different potentized homeopathic drugs like Chelidonium 30C and Lycopodium 30C in ameliorating hepato-carcinogenesis in mice [6, 7] and of Lycopodium 5C and 15C against HeLa cells
Most anti-cancer therapeutic agents exert their effect by inducing apoptosis, necrosis, and/or autophagy in cancer cells [9]. Apoptosis is characterized by several cellular changes, including formation of plasma membrane blebbing, chromatin condensation and DNA fragmentation. The members of the Bcl-2 family are central regulators of the intrinsic apoptotic pathway that governs mitochondrial outer membrane permeabilization, the release of cytochrome-c, and the activations of apaf-1, caspase-9, -3, and poly (ADP-ribose) polymerase (PARP) [10].
The homeopathic drug
Inbred healthy white Wistar rats (
A randomized set of 42 rats was used for each time-point. Each set of rats was sub-divided into 7 different groups consisting of 6 rats in each group:
Group 1, Normal: animals received food and water
Group 2, olive-oil fed: animals received normal food and water supplemented with olive oil (solvent of BaP),
Group 3, placebo fed: normal animals received a drug vehicle (30% ethyl alcohol as a placebo) orally once daily for 1, 2 and 3 months, respectively, after cancer development in BaP-fed rats,
Group 4, only drug-treated: normal animals received Condurango 30C orally once daily for 1, 2 and 3 months, respectively, after four months of cancer development,
Group 5, Carcinogen (BaP)-treated: animals received BaP orally 2 days (Tuesday and Friday) a week for 1 month and then a normal diet and water,
Group 6, BaP+placebo-treated: animals received a placebo orally once daily for 1, 2 and 3 months, respectively, after development of lung cancer,
Group 7, BaP+Condurango 30C-treated: animals received Condurango 30C orally once daily for 1, 2 and 3 months, respectively, after development of lung cancer.
The experimental data were collected after 1 (5th), 2 (6th) and 3 (7th) months to investigate the possible efficacy of Condurango 30C. At the ends of the experimental periods, the animals were sacrificed humanely by cervical dislocation.
2.3. Preparations and administrations of BaP and Condurango 30C
BaP (dissolved in olive oil) at a dose of 50 mg/kg body weight was fed to each rat through gavage [4]. Condurango 30C was supplied by Boiron Laboratory, Lyon, France. One ml of Condurango 30C was diluted with 20 ml of double-distilled water to make the stock solution, and each rat was fed 0.06 ml orally from the stock at a time with the aid of a fine pipette [13].
2.4. Scanning electron microscopy (SEM) and histology of lung
Lung samples were fixed with 2.5% glutaraldehyde, dehydrated with graded acetone (50%-100%) and observed by using an S530-Hitachi SEM instrument (Department of University Science Instrumentation Centre, Burdwan University) after gold coating [14]. Formalin-fixed lung sections (5μm) from each group were stained with hematoxylin-eosin double staining [15] and were evaluated by using a light microscope.
2.5. Lung cell perfusion, annexinV-FITC/PI, DNA fragmentation, and caspase-3 activation assays
The lung tissues were minced within 2% Roswell Park Memorial Institute-1640 media (Himedia, India), and the lung epithelial cells were flushed gently using a hypodermic syringe. The media-containing cells were spun down at 1,000 G, and the supernatant-containing lung epithelial cells were used for further study [14].
The rate of apoptosis of the perfused cells (3 x 10⁷cells/well) was assessed by using AnnexinV- fluorescein isothiocyanate/propidium iodide (FITC/PI) through flow cytometry (FACS Callibur, BD Bioscience, USA) [16]. DNA was extracted by using the conventional phenol?chloroform method, was separated in 2% agarose gel and was visualized under an UV transilluminator. Perfused lung cells were incubated with caspase-3 primary and FITC-tagged secondary antibodies (Santa Cruz Biotechnology, USA). Caspase-3 (Cas-3) activity was analyzed by using flow cytometry (Callibur, BD Bioscience, USA).
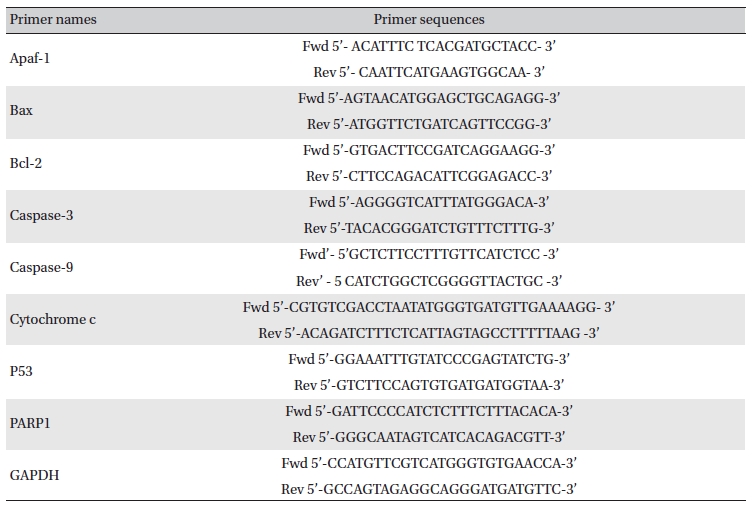
Lung and liver tissues were homogenized, and homogenates were collected after centrifugation [16]. Total RNA was extracted from each lung by using trizol (Himedia, India), and expressions of different apoptotic genes were analyzed by using semi-quantitative RT-PCR [17]. The primer sequences are presented in (Table 1) The band intensities were analyzed densitometrically by using Image J software (Germany).
[Table. 1] Primer names and sequences

Primer names and sequences
An immunohistochemical study was performed [18] with caspase-3 and epidermal growth factor receptor (EGFR) primary antibodies and HRP-conjugated secondary antibodies (Santa Cruz Biotechnology, USA). Haematoxylin was used to counterstain for observation under a light microscope (Leica, Germany).
The expressions of EGFR and PARP1 were analyzed by using Western blots [16]. The band intensities were analyzed densitometrically by using Image J software (Germany).
Data were analyzed, and the signi?cance of the differences between the mean values was determined by using the one-way analysis of variance (ANOVA) with Fisher’s least significant difference (LSD) post-hoc tests with the SPSS 14 software (SPSS Inc, Chicago, IL, USA). Statistical significance was considered at *
3.1. SEM and histology of lung
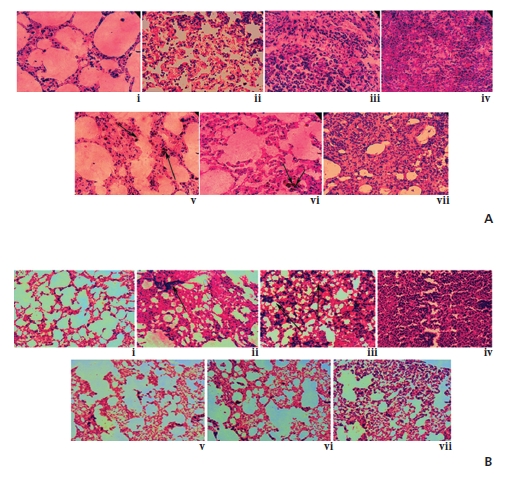
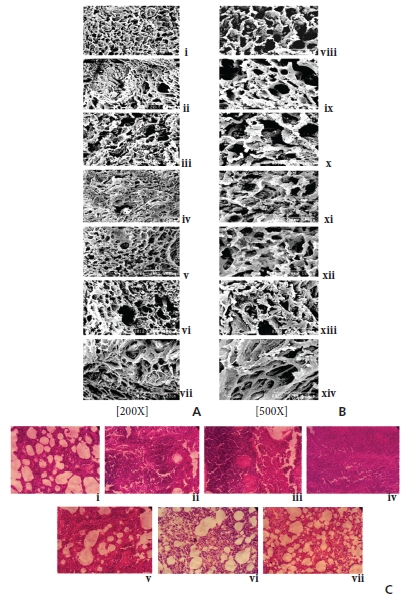
The typical tissue arrangement was observed in the normal lung, but architectural distortion of the pulmonary microvasculature with narrow alveolar spaces was observed in a cancerous lung, which gradually increased with time. Noticeably, alveolar spaces gradually became broader, specifically at the 5th and the 6th month fixation intervals of drug treatment, thus indicating the tissue damage-repair activity of Condurango 30C (Fig 1)A, B, C).
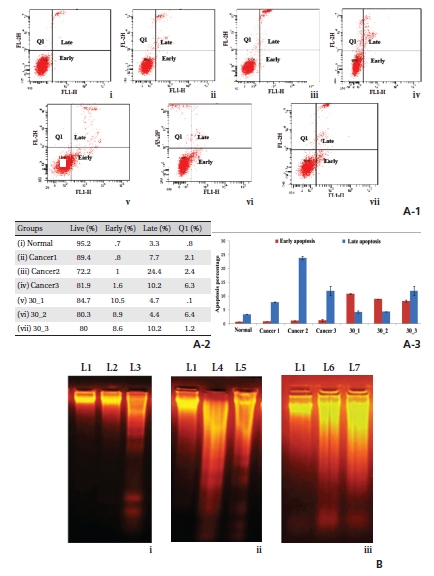
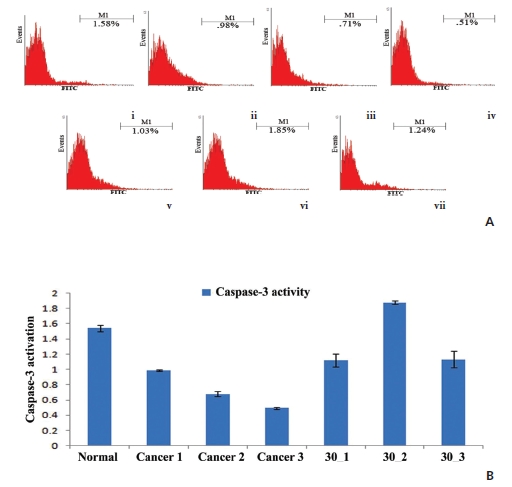
Apoptotic cell death is accompanied by surface exposure of phosphatidylserine (PS) in the plasma membrane, which can be detected by using AnnexinV. (Fig 2)A-1 reveals a time-dependent increase of apoptosis, especially at the 5th and the 6th month fixation intervals. Percentages of cells are shown in Fig. 2A-2 table. Standard deviations (Fig. 2A-3) of early and late apoptosis clearly demonstrate the percentages of cells that undergo apoptosis.
DNA-smearing was found in cancerous lung samples at the three-month time point. However, a gradual increase in DNA fragmentation was observed in drug-treated groups, especially at the 5th and the 6th month intervals, indicating the cells’ journey towards apoptosis (Fig 2)B).
(Fig 3)A shows an increased level of caspase-3 after post-cancerous-drug treatment, specifically at the 5th and the 6th month intervals, which may suggest that a time-bound action of the drug to increase the caspase-3 activation in cancerous lungs remains maximal, at least, in the first two-month interval, to trigger apoptosis. The standard deviation of the caspase-3 activation (Fig 3)B) supports the conclusion stated above.
3.5. Semi-quantitative RT-PCR and localization of protein distribution by immunohistochemistry
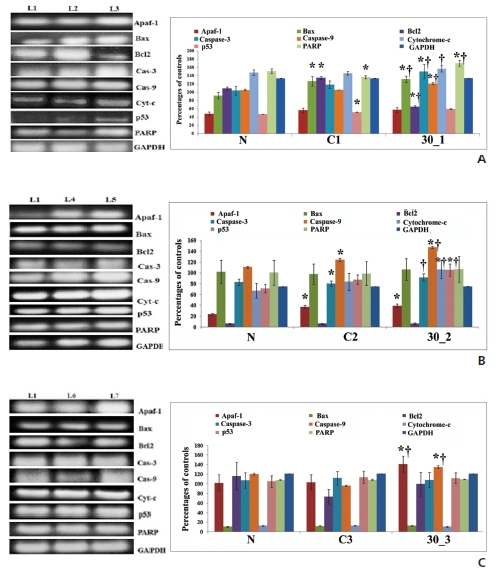
RT-PCR results confirmed a significant difference in the expressions of different pro- and anti-apoptotic genes between normal and cancerous and between cancerous and drug-treated groups, especially at the 5th and the 6th month time points. (Fig 4)A, B, C). Appearance of caspase-3, indicated by black spots in drug treated sections, demonstrated caspase-3-mediated apoptosis induction, especially at the 5th and the 6th month intervals (Fig 5)A).
EGFR is normally over-expressed in 80% NSCLC [19]. Figure 5B clearly shows a decreased level of EGFR expression after drug treatment, especially at the 5th and the 6th months, but a dramatic increase at the 7th month, indicating that the drug did not ameliorate cancerous progression during the last month interval, possibly due to excessive growth of lung tumors.
3.6. Protein expression by-Western blot
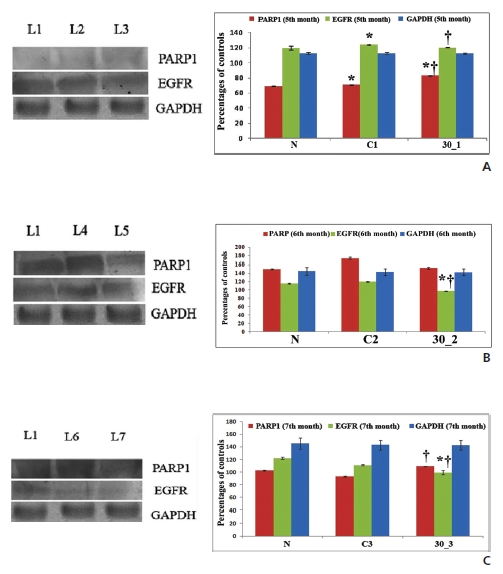
We found a more decreased expression of EGFR in drug-treated lung proteins than in cancerous samples, especially at the 5th and the 6th month fixation intervals, which supported the immunohistochemical data. Thus, Condurango 30C further proved to have anti-EGFR activity in NSCLC by inhibiting uncontrolled cell growth (Figs. 6A, B, C).
The increased expression of PARP1 is indicative of cells undergoing apoptosis (Fig 6)A, B, C). At the 6th month interval of drug treatment, although the PARP1 expression was slightly low, formation of PARP1 cleavage further supported the apoptosis-inducing activity of the drug
The ultra-highly-diluted remedies, particularly those exceeding Avogadro’s limit, have been claimed [20] to have beneficial and curative effects against disease/disease symptoms. Therefore, the positive effects against cancer found in this study are very important. Further, the remedy demonstrates sufficient efficacy when administered after the complete development of cancer in an animal model.
The hallmark of most anti-cancer drugs is the induction of apoptosis in cancer cells, which are otherwise immortal and ever-growing in nature. However, most anti-cancer drugs used in orthodox therapy are highly toxic and have undesirable side effects, largely precluding their use in all cancer patients. Therefore, any drug that can be used in a low and tolerable dose without any side-effects is highly sought in cancer therapy because it can also be used as a supportive therapy if needed. Herein lies the novelty of this ultra-highly-diluted remedy that also demonstrated an unquestionable ability to induce apoptosis in cancer cells with positive recovery of cancerous lungs back to their near normal states in rats, particularly at the 5th and the 6th month intervals. The present study seems to be the first one that convincingly demonstrates the anticancer potentials of Condurango 30C in BaP-induced lung cancer in rats through a multitude of scientific protocols. The recovery due to post-treatment with Condurango 30C in this study was quite remarkable.
One of the hallmarks of apoptosis is internucleosomal DNA breakdown or fragmentation. Formation of DNA laddering suggested the ability of Condurango 30C to induce apoptosis, which was further supported by AnnexinV-FITC/PI dual staining data, especially at the 5th and the 6th month fixation intervals. Multiple apoptotic stimuli trigger caspase-3 activation, which initiates and executes apoptosis. Our experimental data support the activation of caspase-3 based on flow cytometry, RT-PCR and immunohistochemical analysis after post-cancerous drug treatment, and represent a positive signal towards caspase-3-mediated apoptosis. The key events involved in caspase-3-mediated apoptosis are up-regulation of Bax and down-regulation of Bcl2 [21]. Increased and decreased expressions of Bax and Bcl2, respectively, lead to loss of mitochondrial membrane potential (MMP), which induces apoptosis via cytochrome-c release. RT-PCR analysis indicates decreased Bcl2 and increased Bax levels after treatment with Condurango 30C, especially at the 5th and the 6th month intervals. Furthermore, Condurango 30C treatment leads to the activation of cytochrome-c, caspase-3, caspase-9, apaf-1 and PARP1, especially at the 5th and the 6th month intervals. PARP1 is important to trigger apoptosis in the caspase-3-mediated pathway. Increased levels of PARP1 were found at the 5th and the 6th month fixation intervals, especially the formation of PARP1 cleavage at the 6th month, depicting further that the cells were undergoing apoptosis.
EGFR expression was found to be elevated in cells undergoing proliferative activities, particularly during development of a lung tumor [19]. However, in this study, Condurango 30C inhibited EGFR expression at the 5th and the 6th month of post-cancerous treatment, further lending support to its anti-proliferative activity.

![Scanning electron microscopy of rat lungs of different groups [(A) and (B)]. (A) [200X] (i) and (B) [500X] (viii) - untreated control group with regular tissue rearrangement, (A) [200X] (ii)-(iv) and (B) [500X] (ix)-(xi) - BaP-induced cancerous groups at 5th, 6th and 7th month intervals, respectively, where alveolar spaces were narrowing, (A) [200X] (v)-(vii) and (B) [500X] (xii)-(xiv) ? Condurango-30C-treated groups at 5th, 6th and 7th month intervals, respectively. (C) Histological sections of rat lungs (40X): (i) normal lung section, (ii)-(iv) BaP-induced lung sections at 5th, 6th and 7th months and (v)-(vii) Condurango-30C-treated lung sections at 5th, 6th and 7th month intervals, respectively.](http://oak.go.kr/repository/journal/12426/DHOCBS_2013_v16n3_11_g001.jpg)