The present paper defines diversity gain for stationary users. This deals in particular with gathering the received signal statistics over possible user positions and orientations in space rather than over time, and to define a meaningful diversity gain related to the cumulative improvement of the performances of the 1% users with the worst receiving conditions. The definition is used to evaluate diversity gain for some typical small antennas in an extreme environment with only line-of-sight (LOS). The LOS environment is regarded as user-distributed 3D-random LOS caused by the statistics of an ensemble of stationary users with arbitrary orientations in the horizontal plane (2D), and with arbitrary orientations of their wireless devices in the vertical plane. Thus, an overall 3D-random distribution of user orientation is assumed.
Modern wireless communication systems with multi- port antennas make use of multiple input multiple output (MIMO) diversity and spatial multiplexing. There are new test methods under development that can characterize also the antenna diversity and spatial multiplexing. Such test methods are commonly referred to as over-the-air (OTA) tests in contrast to so-called conductive system tests without antenna, using a cable connected directly to the receiver input of the wireless device. The antenna diversity gain is properly defined in a rich isotropic multipath (RIMP) environment [1], and can be measured in a reverberation chamber that properly emulates a RIMP [2]. However, all environments are not rich and isotropic. Therefore, the present paper deals with defining diversity gain in a non-rich and anisotropic environment, see also [3]. The chosen non-rich anisotropic environment for this study is the extreme case of pure line-of-sight (pure-LOS).
The statistical multipath environments in urban areas and inside buildings are normally rich and isotropic, where the latter means that the angles-of-arrival (AoA) of the incident waves on the wireless device are uniformly distributed over all directions in 3D space, with no LOS. At the country side, and close to base stations, there will often be significant LOS component, i.e. one dominant wave incident from a specific direction often in the horizontal plane. In order to study non-rich and anisotropic environments, we therefore in this paper choose the extreme case of a pure LOS. This is a classical environment present in all point-to-point communication systems with fixed antenna system installations. However, in wireless mobile communications we need to take the arbitrary orientation of the user into account, which is at least arbitrary in the horizontal plane (2D), and in particular the arbitrary orientation of the wireless device in the vertical plane, giving in total 3D orientation arbitrariness. Therefore, we will in the present paper study antenna diversity in a user-distributed 3D-random LOS environment, by studying an ensemble of users.
Previous publications related to random LOS like [4-6] have only looked at a moving single user, whereas we are concerned about evaluating performance over an ensemble of users. Thus, the observed cumulative distribution functions (CDFs) are not representing fading, i.e., time-varying signal, but rather a spatial distribution over an ensemble of users having the same device.
The user-distributed random LOS can be analyzed with ViRM-lab, a computer code for analyzing performance of wireless terminals in multipath with many arbitrary incident waves [7] based on standard receive antenna equivalent circuits [8]. However, because we here only deal with one incident wave, we will simplify the analysis by uniformly sampling the total measured 3D far field function over the unit sphere, and then create the CDF from these samples. (we use about 12,000 uniformly distributed samples over the unit sphere, created from spline interpolation in an original spherical grid of 2° spacing in both polar and azimuth angles). This is computationally very fast, and we have verified that it gives the same result as using the more general Vi- RM-lab for single-wave random LOS case, provided we use enough channel realizations of the latter.
Ⅱ. Definition of Cumulative Diversity Gain in User-Distributed 3D-Random LOS
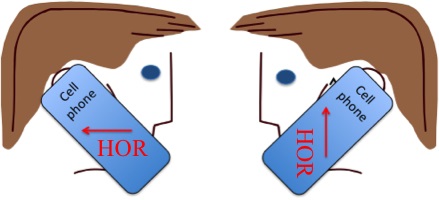
It is easy to understand that the AoA of LOS will be uniformly distributed in the azimuthal plane, because the users can have any azimuthal orientation. It is not so obvious that the AoA will be uniformly distributed also in the elevation plane. Therefore, we have illustrated and explained this for handheld phone-type terminals in Fig. 1. A related interchanging of horizontal and vertical direction appears in modern handheld tablets that can be used for any orientation of the screen, i.e., any of its fours edges can be pointing up. Thus, we can defend studying a user-distributed 3D-random LOS.
We will here determine the CDF of the relative received voltage envelope (equivalent to relative received power levels when presented in dB) at each port of an antenna under test (AUT) in 3D-random LOS, as well as for the diversity-combined case. We choose in our examples maximum ratio combining (MRC) of the voltages at each port. Of convenience, we will in our examples neglect the embedded element efficiencies by assuming lossless matched antennas, as well as no coupling loss to the opposite diversity antenna port; see the general definition of decoupling efficiency in [9]. We can do this without loss of generality because efficiency will simply shift the CDFs towards the left (lower received voltages) and not change their shapes. However, the effect of mutual coupling are included when dealing with the measured far field functions for the antenna examples, because they are so-called embedded far field functions, obtained by measuring the far field function on each port with the other port terminated in 50 Ω.
The CDFs are in the graphs normalized to the total received power on a hypothetical lossless and omni-directional dual-polarized antenna, i.e., the total received power on both ports combined. Therefore, any single- port antenna of 100% total radiation efficiency will have an average relative received power that is ―3 dB in 3D-random LOS.
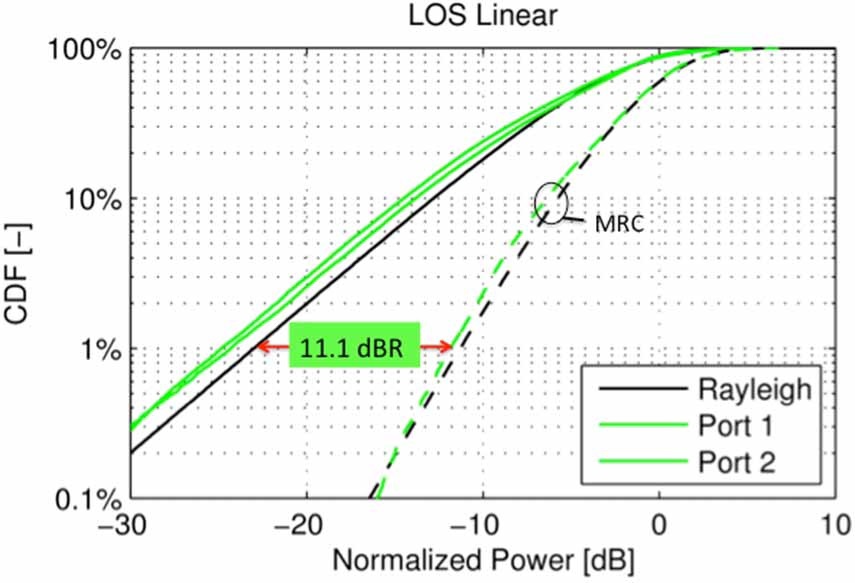
The user-distributed CDFs in 3D-random LOS of an example of a diversity antenna on a mobile phone are shown in Fig. 2. We see that the CDFs on the two ports are very close to being Rayleigh-distributed, but it may not necessarily be so which we will see later in the paper. We have marked the cumulative diversity gain relative to the theoretical Rayleigh distribution, which we see is 11.1 dBR, where the unit dBR means dB relative to Rayleigh. (The definition is in agreement with how we define diversity gain in rich isotropic environments [1], but the actual values will not necessarily be the same.) We see that the apparent diversity gains compared to the 1% levels of single-port CDFs on the same antenna is larger, but it is better to define the diversity gain relative to a generic reference curve like the Rayleigh distribution. This will more clearly be seen in the next section.
To summarize, a user-distributed cumulative diversity gain in 3D-random LOS is a measure of the performance of a large group of users in the environment. A diversity gain of 11.1 dBR means that the 1% of the users which receives the weakest signal levels, will experience a performance improvement of 11.1 dB or more relative to a theoretical Rayleigh distribution of the signal levels among the users.
Ⅲ. CDFs and Diversity Gains of Different Theoretical Small Antennas in 3D-Random LOS
Practical small antennas may in free space radiate similar to small electric or magnetic dipoles, or linear combinations of them. Therefore, we will show some results of such theoretical small antennas even though we know that the effect of the body of the phone and the user will add both size and a statistical factor that in practice make them radiate differently. The so-called Huygens source is a specific linear combination of electric and magnetic dipoles that has a far field function of the form 1+cos(
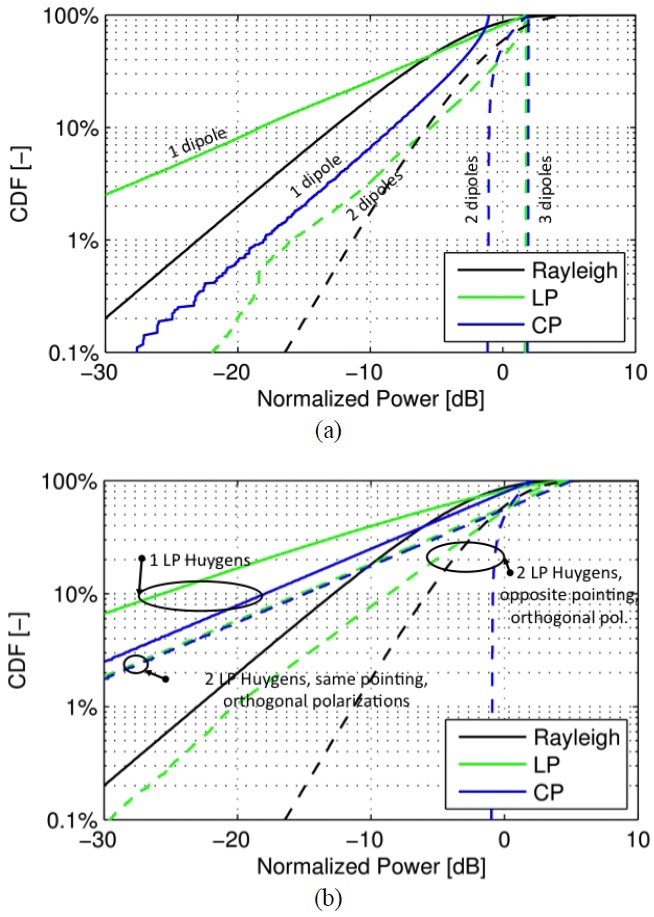
The results are shown in Fig. 3 for small electric dipoles (upper graph) and directional Huygens sources (lower graph). We have also plotted the theoretical Rayleigh graph for comparison. The CDF of a single dipole in a linearly-polarized (LP) user-distributed 3D-random LOS is worse than the theoretical Rayleigh, whereas the same dipole for the circularly-polarized (CP) 3D-random LOS has similar shape as the Rayleigh, but with 4.8 dB higher power for low CDF values (<30%) and up to 3 dB lower power for high CDF values (>70%).
Ⅳ. CDFs and Diversity Gains of Two Measured Diversity Antennas in 3D-Random LOS
Finally we use the measured radiation patterns on the two ports of a practical diversity antenna for phone-type terminal to determine the CDFs in 3D-random LOS, both for a free space case and when the phone is held by a human hand phantom. We actually used the complete complex embedded far field function on each port as described in the text between Fig. 1 and Fig. 2. The phone mock-up had a size of 115×55×12 mm with the antennas located along the two 55 mm sides, and it was measured at 33 uniformly distributed frequency points in each of the frequency bands 750-960 MHz and 1,700 -2,700 MHz.
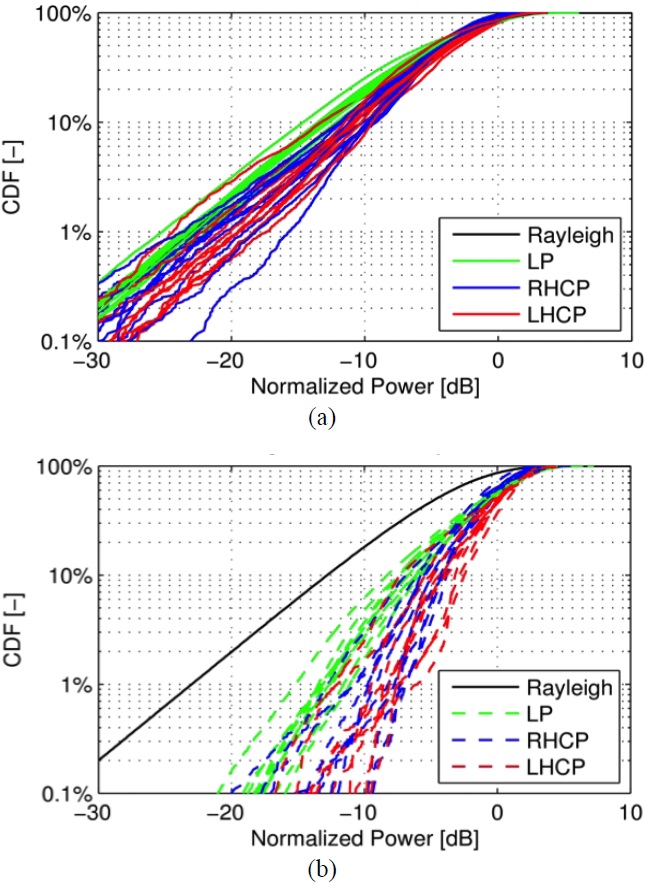
The results are shown in upper Fig. 4 for one selected free space case. The bundle of curves show CDFs at 11 uniformly distributed frequency points between 1,700 MHz and 2,700 MHz. The upper graph shows the CDF on one of the antenna ports in free space. The LP and two orthogonal circularly-polarized 3D-random LOS cases are shown as curves of different colors. We see that the curves form a bundle around the theoretical Ray leigh, and the green curves for the LP case are located to the left of the blue and red CP cases. This is consistent with the better performance for CP LOS in Fig. 3(a). However, this tendency was different for the CDFs in handheld position, which therefore indicates that the hand changes the polarization of the antennas on the phone. The deviations from the Rayleigh CDFs were for all cases very similar, i.e., for each of the two antennas in free space and handheld position (only one case is shown), except for the fact that the spread of the curves was larger in the lower frequency band and that the better performance for CP LOS was not so clear for the handheld case. Some cases showed also different performance for right hand and left hand CP cases, i.e., RHCP and LHCP, respectively.
The diversity-combined CDFs for the same example are shown in lower Fig. 4. The curves form a bundle of curves around the theoretical diversity-combined Rayleigh. Thus, the bodies of the user and the phone have a statistical effect on the performance in 3D-random LOS, making the CDFs approach the CDFs of the ideal Rayleigh and diversity-combined Rayleigh.
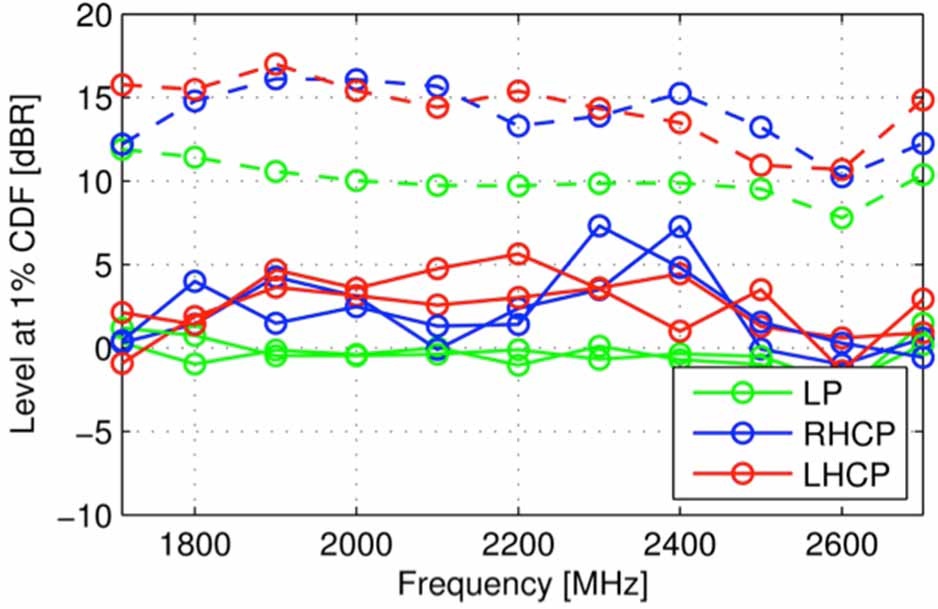
We have in Fig. 5 plotted the 1% CDF levels and cumulative diversity gains in dBR as a function of frequency for the CDFs in Fig. 4, both at each port and MRC diversity-combined. We have summarized the results of the measured cases (free space and handheld) at each frequency band in Table 1, together with results from theoretical sources.
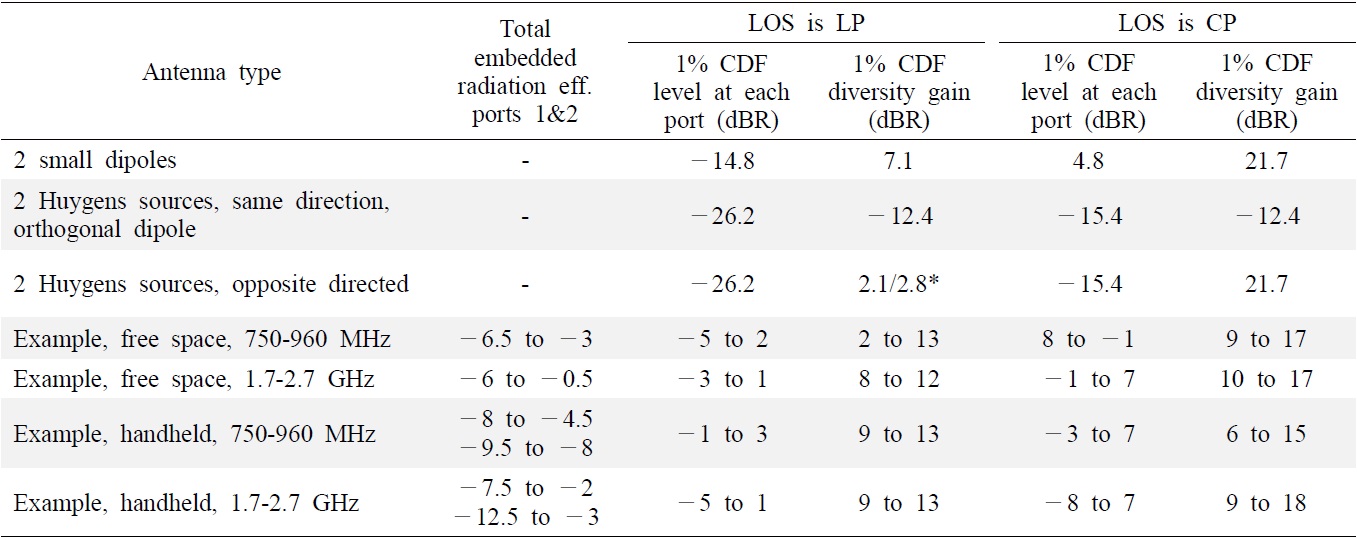
Cumulative performance of 1% worst users in random for the different incremental sources and line-of-sight (LOS) cases in Fig. 3, and for the different cases of the experimental antennas described in Section IV, for different polarizations of the 3D-random LOS
We have argued that the random device orientations over an ensemble of users will represent a user-distributed 3D-random LOS in an environment with a pure LOS contribution from a fixed given direction. We know from before that the CDF of any antenna in rich isotropic multipath approaches the theoretical Rayleigh when the number of independent channel samples increases. We have here shown that theoretical small antennas have CDFs that may be very different from theoretical Rayleigh in 3D-random LOS.
Table 1 shows typical ranges of variation of such CDF levels and diversity gains. This includes the theoretical electric dipoles and Huygens sources studied in Section III. From these we are able to conclude as expected that the 3D-random LOS performance is better when the base station is CP and the terminal is LP, than if both are linear. The opposite with a LP base station and CP terminal should also be advantageous, but it is difficult to realize small CP antennas. Also, the polarization of small antennas change when the user body is introduced, so in the end there may be no advantage.