a NACA mean line designation
AE/A0 expanded blade area ratio of propeller
AR aspect ratio of hydrofoil
b span of hydrofoil
c chord length of hydrofoil
D diameter of propeller
Cp non-dimensional pressure coefficient
fmax maximum camber of hydrofoil
Jdesign design propeller advance coefficient
P pitch of propeller
TIu (%) axial component of the turbulence intensity in percentage
tmax maximum thickness of hydrofoil
Um mean inflow speed of the tunnel based on the pitot measurements
? mean velocity at the pickup point
u axial component of velocity
u' fluctuation of u component at the measuring point
ur resultant velocity at the pickup point
v transverse component of velocity
x distance from leading edge of hydrofoil
yb wall distance position
α angle of attack of hydrofoil
δmax maximum boundary layer thickness developed on hydrofoil obtained from Eq. (6)
λ wave length of laser beam
σi cavitation inception number
When a hydrofoil or propeller blade section is designed, main emphases of the design are usually put on generating required lift with adequate structural strength and avoiding or reducing the effect of cavitation. On the other hand, propeller designers have traditionally used blade sections based on aerofoil profiles, which were developed for high lift coefficients, etc. However, marine propeller blade sections are usually designed with compromised lift coefficients for avoidance of cavitation or reduce it.
During the final quarter of the last century considerable efforts have been made to reduce the amplitudes of hull pressure fluctuations caused by unsteady propeller cavitation. This has resulted in changes in propeller design characteristics including increased skew, tip unloading and the introduction of “New Blade Sections” (NBS) designed on the basis of the so-called Eppler code (Eppler and Somers, 1980; Eppler and Shen, 1979). Eppler developed a method based on the conformal mapping technique for the design of a profile with a prescribed piece wise distribution of angles of attack around this profile. One of the main features of this method is to give a more accurate estimate of the velocity distribution in the leading edge region. Eppler and Shen (1979) applied this method to hydrofoil design. A profile called YS920 was developed to give a wider cavitation free bucket than those of the NACA mod.66 and NACA16-309 profiles.
Yamaguchi et al. (1988a; 1988b) addressed the problem by combining the Eppler code with a lifting surface design procedure. In their approach no attention was paid directly to the effect of blade section parameters, such as camber and thickness distributions, on hull surface pressure fluctuations. Lee et al. (1993) showed experimentally that the K18 section developed based on the new blade section displayed a wider cavitation free range than the existing NACA66 and NACA16 hydrofoil sections. The model propeller having this section experienced less cavitation extent and fluctuating pressure than the model propeller based on NACA section. This was also observed in the cavitation performances of the full-scale propellers (Lee et al., 1993).
Cavitation tunnel tests with 16
Wang (1995) developed a propeller design method incorporating NBS design using both lifting surface theory and conformal mapping technique to achieve the required lift and cavitation characteristics on each individual blade section. The effect of maximum camber of a blade section on its cavitation and hydrodynamic characteristics was investigated and the so-called lift re-allocation was introduced to take into account of the wake variation in the circumferential direction. Then, pitch and maximum camber at each radius could be determined not only based on the lift, but also on the cavitation characteristics at that radius (Wang, 1995; Wang et al., 1995). Based on the methodology proposed in Wang (1995), a model propeller ECT102 was designed with the new blade sections. This propeller was a 5-bladed, right-handed, highly skewed propeller with a 0.24
The complexity of the theory and multitude of the parameters contributing to the discrepancy between the predictions and the measurements revealed that a further investigation into the sections of both NBS and NACA would be the most appropriate. This motivation was the basis for the experimental investigation presented in this paper.
>
Objectives and scope of the study
As was concluded in the previous section there was a need to study the cavitation bucket characteristics of two alternative blade sections, NBS and NACA, with the same chord, span length and maximum thickness but different distributions of the thickness and camber. Furthermore, it would be very informative to explore the bucket investigation by the measurements of the local velocity distribution around the representative blade sections using the Laser Doppler Anemometry (LDA) technique. This would provide information for likely peaks of the local velocities (pressures) on the blade sections and hence try to correlate these findings to the cavitation behaviours of the sections. Based on this information the shortcomings of the NBS section could be defined. The main objective of this study therefore was to understand why the NBS was failed for better cavitation performance.
Within the above context, two distinct sets of model tests were carried out with two rectangular planform of hydrofoils, one of which having the NBS other having a comparable NACA cross-section. The tests involved cavitation observations and detailed velocity measurements around the both sections by using a 2-D LDA system.
This paper presents the results of this investigation, in terms of the cavitation bucket and local velocity/pressure distribution around the blade sections in combination. The experimental set up and test conditions for the study are given in the following section. The results of the cavitation tests and the local velocity measurements around the blade sections are presented in the next. This is followed by the calculations of the pressure distributions around the sections and discussion for the comparison of the cavitation performances of the two sections by combining the results from the cavitation observations. Finally the main conclusions of the investigations are included.
EXPERIMENTAL SET UP AND TEST CONDITIONS
Experiments were carried out in two groups at the Emerson Cavitation Tunnel (ECT) of Newcastle University, which has a large rectangular test section with a cross-section of 1.22
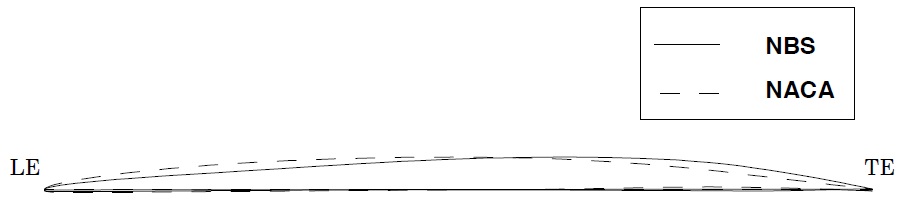
In representing the typical blade sections of the earlier mentioned ECT propellers, two rectangular planforms with the specified blade sections were designed: one of which had a NACA66-004, a=0.8 (modified) mean line blade section; other had a New Blade Section (NBS). Both hydrofoils had the same lengths of chord, span, maximum thicknesses and cambers but different distributions of the camber and thickness. Table 1 represents the main characteristics of the two blade sections (hydrofoils) while the comparative profiles of both sections are shown in Fig. 2. Table 2 displays the offset data for the NBS.
[Table 1] Main particulars of test hydrofoils.
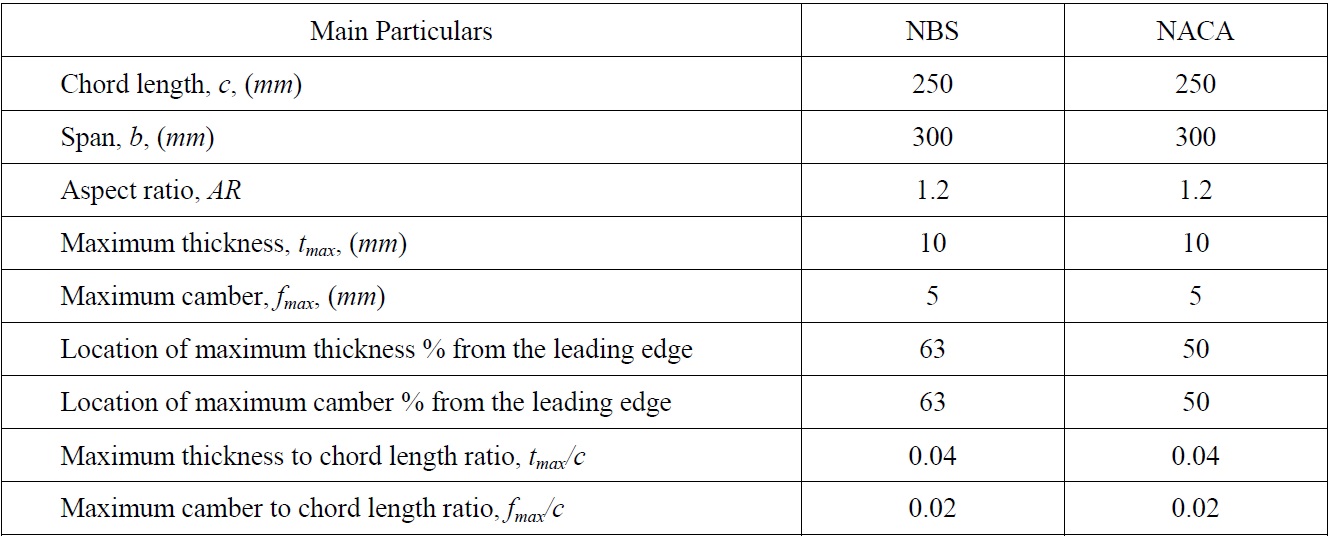
Main particulars of test hydrofoils.
Based on the simple beam theory and stressing procedure the hydrofoil stock was determined as 25.4
[Table 2] Offset data for NBS hydrofoil.

Offset data for NBS hydrofoil.
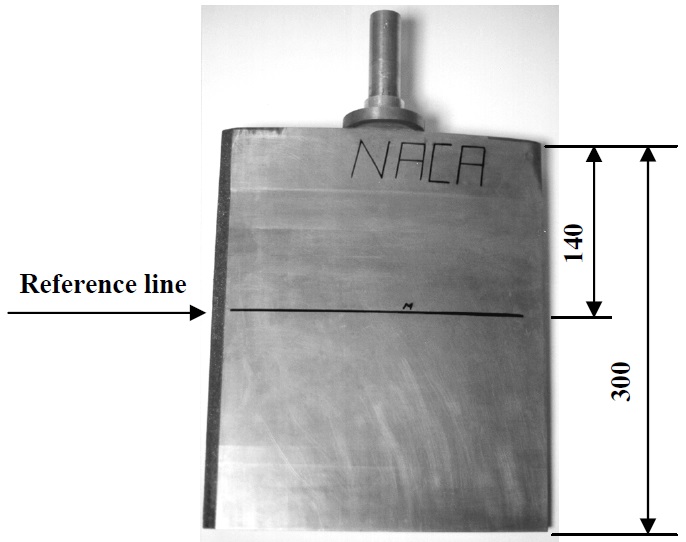
These tests provided a basis for establishing cavitation bucket diagrams of the test hydrofoils based on observations. Because of the physical limitations of the cavitation tunnel, the hydrofoils had to be hanged vertically from the top lid of the tunnel. This lid was equipped with a specially designed adjustable mechanism to hold the hydrofoil stock and provide the necessary angle of attack required to the hydrofoils. The vertical orientation coupled with relatively thicker cross-sections of the hydrofoils prevented to measure a clear inception for tip vortex cavitation. This was because the hydrofoil sections near the stock had a maximum thickness, which was nearly double the maximum thickness of the original cross-section, due to the strength requirements. This triggered early inception of cavitation at the top, and it was further complicated by the combined boundary layer of the lid and the hydrofoil. Therefore, under this circumstance, only the inception of the sheet cavitation at a suitable reference line could be recorded. This reference line was marked on the hydrofoils outside the fillet area at a distance of 140
Based on the above set-up the procedure for collecting an inception point for the sheet cavitation on the hydrofoils was processed as follows. Initially the tunnel static pressure was set to a constant value and the tunnel water velocity was increased until the extent of sheet cavitation reached and passed the reference line by a reasonable amount. The tunnel speed was then decreased until the extent of sheet cavitation was steadily just reaching at the reference line. Based on a number of repetitive observations the corresponding point was, then, accepted as the valid inception of the sheet cavitation, which was the desinent point. In order to obtain a reasonable bucket, angle of attack was varied between -1° and 4°
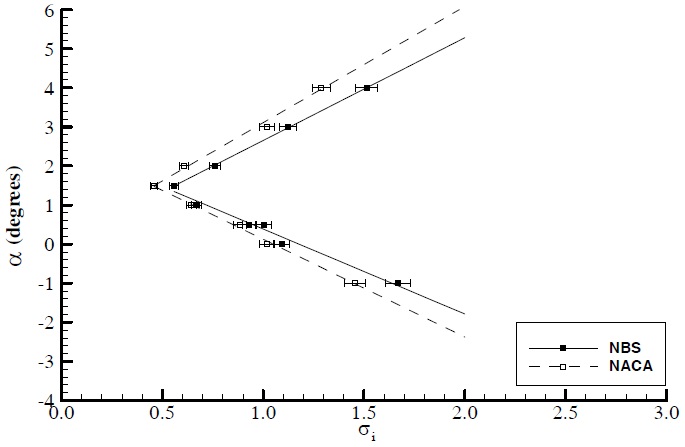
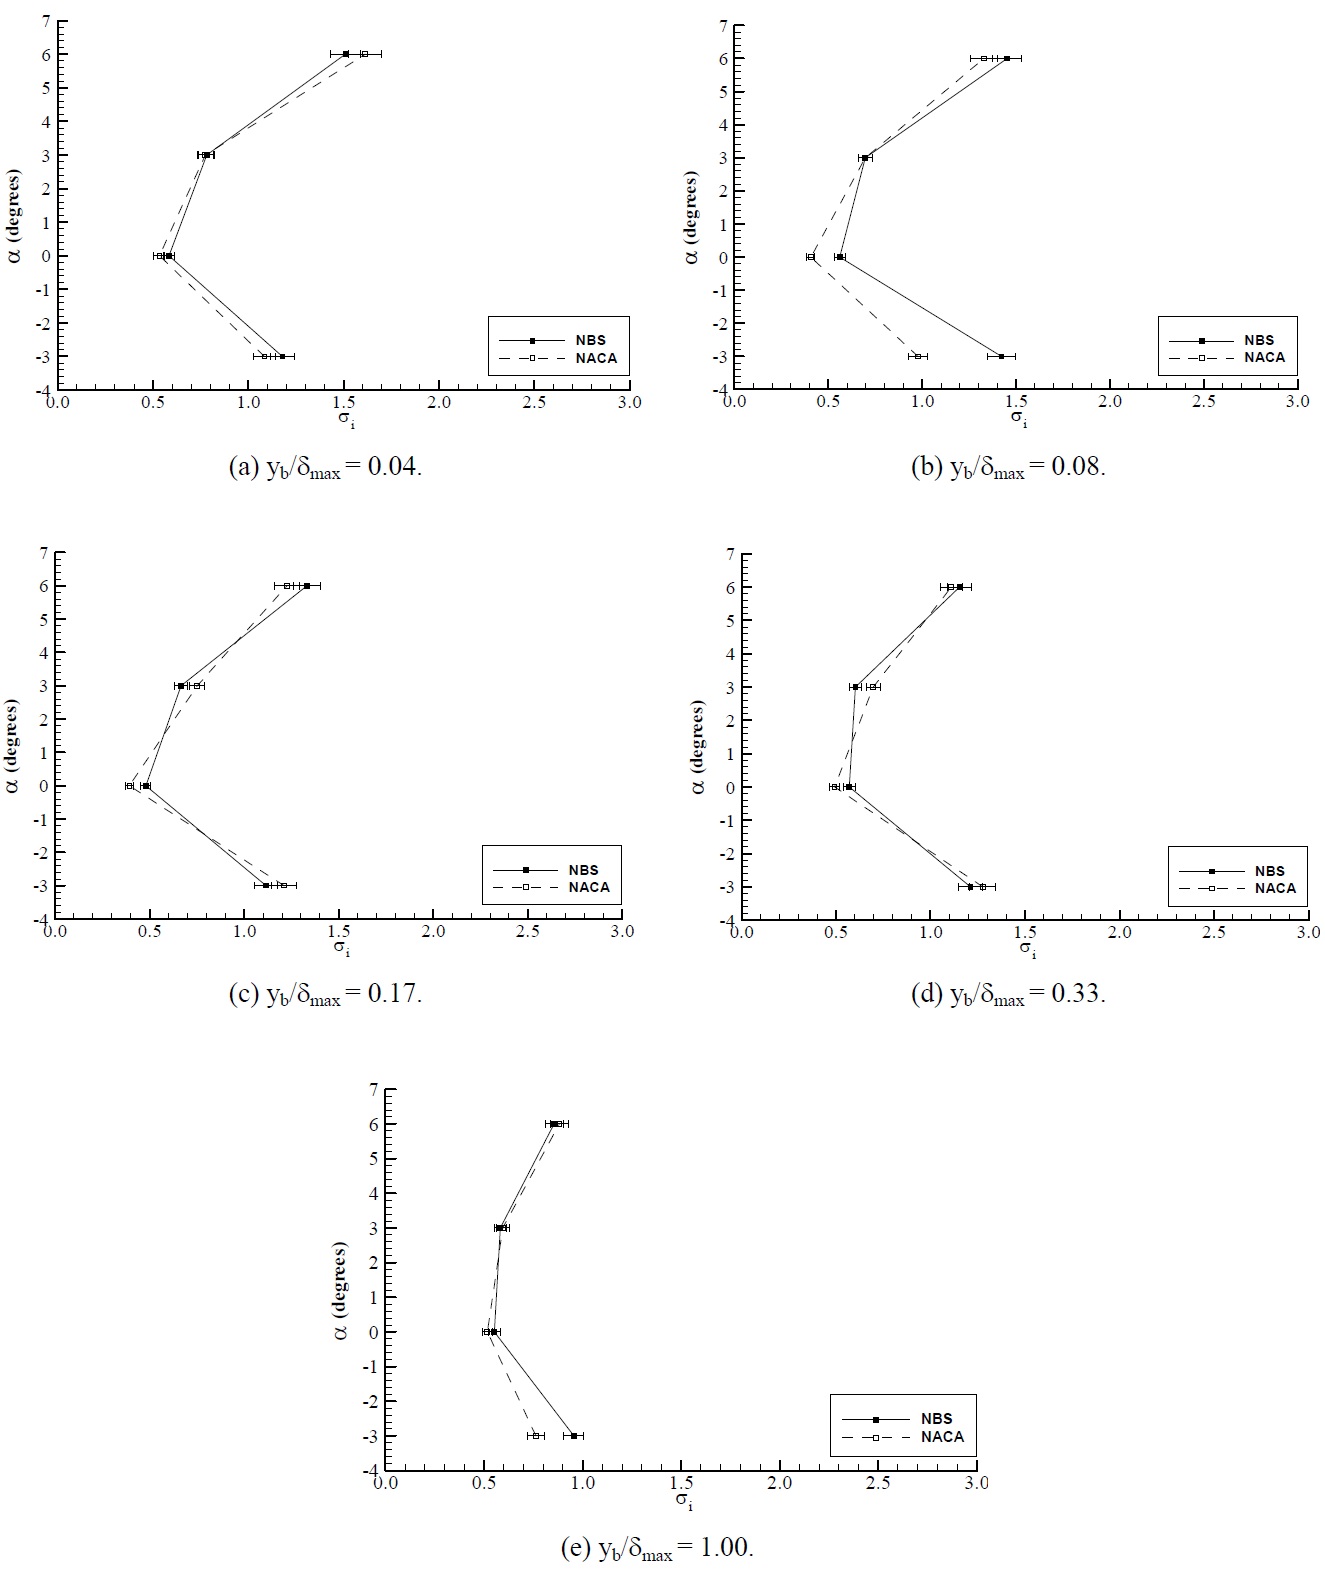
During these tests, the dissolved gas content level was measured by using a Jenway DO2 meter 9071 apparatus and kept at about 35% while the chord based Reynolds number varied between 1.3x10⁶ and 1.75 × 10⁶. The results of the cavitation inception measurements of the hydrofoils are shown in Fig. 5 and related discussions are presented in the corresponding section.
The uncertainty analysis used in the tests followed that of the American National Standard Institute (ANSI) and American Society of Mechanical Engineers (ASME) standard on measurement uncertainty, which is based on the root-sum square (RSS) method (ASME, 1998). Total uncertainty in a measurement is the combination uncertainty due to systematic error and uncertainty due to random error. Uncertainty, U, is defined as an interval, about the measured value, that has a pre-assigned probability of containing true value. Therefore the interval

represents a band about the measurement mean,

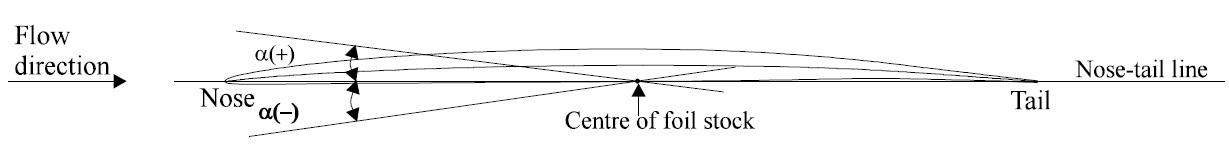
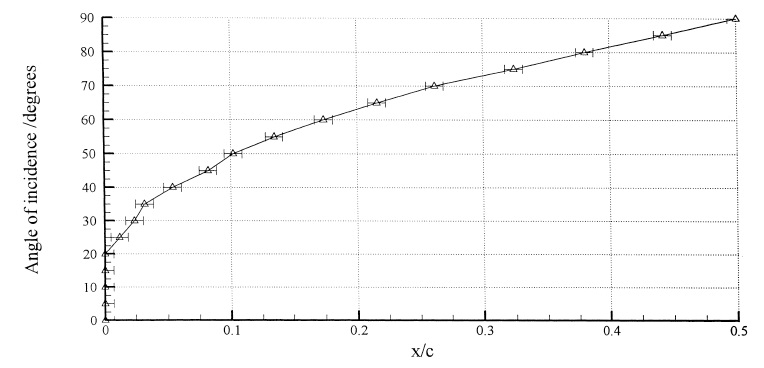
within which the true value is expected with respect to a given level of confidence (ASME, 1998). Uncertainty levels of the cavitation inception tests were ±3.65% and ±5.25% for the 95% and 100% confidence levels, respectively. Fig. 4 shows the angle of attack setting in the measurements and uncertainty for the angle of attack setting was ±0.1°.
>
Local velocity measurements by LDA
For the measurements of the local velocities around the hydrofoils, a 2-D Laser Doppler Anemometry (LDA) system of DANTEC was used. The system had a Spectra Physics 2016 type, water-cooled laser with a power of 5
Four laser beams, two in the axial direction and two in the transverse, were generated from a 600
The traversing system driving the probe was placed on a bench underneath the tunnel and the test hydrofoils. The laser beams approached the reference line (shown in Fig. 3) around the hydrofoils through the bottom observation window with an angle of 3.66° with respect to the vertical plane through the hydrofoil section. This was necessary to approach to the hydrofoil surface without being obstructed by the bottom part of the hydrofoil. Of course this small inclination would have a small effect on the velocity components which was later corrected based on the simple cosine relationship.
The trajectory of the traversing system was adjusted separately for the suction and pressure side of the hydrofoils and the velocity data for each point along the each side of the hydrofoils was collected accordingly. It was decided that the local velocity measurements should be carried out at least 2 different tunnel flow speeds, 5 different angles of attack and 5 different distances from the surface (wall) of the hydrofoils to obtain as much as information for the detailed flow characteristics. In order to get a fine distribution around the hydrofoils, particularly at the leading edge region, a reasonable number of pickup points were used. A summary of the test conditions are displayed in Table 3.
[Table 3] Test conditions for cavitation tests based on observation and local velocity measurements.
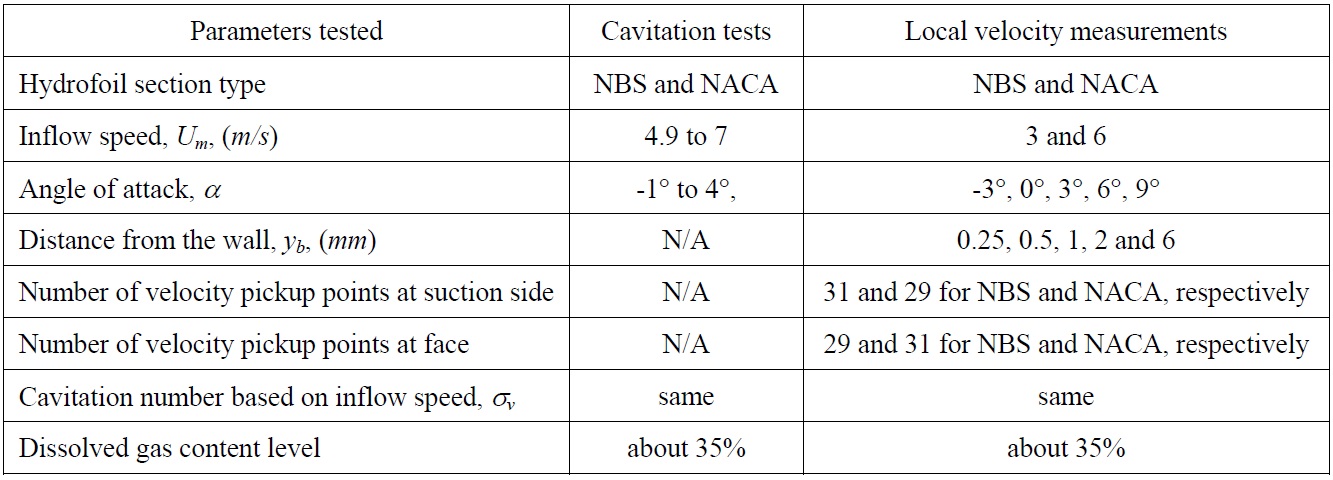
Test conditions for cavitation tests based on observation and local velocity measurements.
Before each test the particular hydrofoil was fixed at the desired angle of attack. The traversing system was calibrated for its start and finish positions fixed at the nose and tail respectively by using the measuring volume of the laser. Between the nose and tail it was made sure that the measuring volume would be following the reference line on the hydrofoil.
Following the above process the traversing mechanism driven by the DANTEC BURSTware software operated the probe to collect data at previously specified velocity pickup points. For each pick up point 15
PRESENTATION AND DISCUSSION OF TESTS RESULTS
As shown in Fig. 5, there is a clear trend that both sections present similar bucket diagrams but the NACA section displays a relatively favourable cavitation bucket compared to the NBS, particularly at the suction side of the hydrofoil. In practical terms, at relatively large positive angles of attack the NBS will experience a sheet cavitation at the suction side about a half degree earlier than the NACA section to experience the same cavitation extent. This advantageous margin is approximately halved for the pressure side cavitation of the NACA hydrofoil, at relatively small positive and negative angles of attack.
As noticed in the bucket diagrams, there is no width at the bottom of the buckets for both hydrofoils. In spite of the observation difficulties number of repetitive points were taken at this min
During the tests the onset of the cavitation was always observed at the leading edge of the two sections. At negative angle of attacks to positive angle of attacks of 1° a “pressure side” cavitation was observed while at angle of attacks greater than 1° a “suction side” cavitation was observed. The nature of the cavitation onset at the face was very sharp and sudden appearing as a “streak” type along the span of the hydrofoil sections. However, the onset for the suction side cavitation was gradually starting from the top of the hydrofoil like a wedge shape and developing as a “sheet” cavitation.
One may suggest that the set-up of the cavitation tests did not lend itself to investigate the tip vortex type cavitation due to the physical limitations of the hydrofoil attachment, hence only the sheet type was investigated. Although the shape of cavitation bucket diagrams is not a typical bucket type, these diagrams would still give useful information about comparison of relative cavitation behaviours of these hydrofoils.
>
Local velocity measurements by LDA and calculated pressure distributions
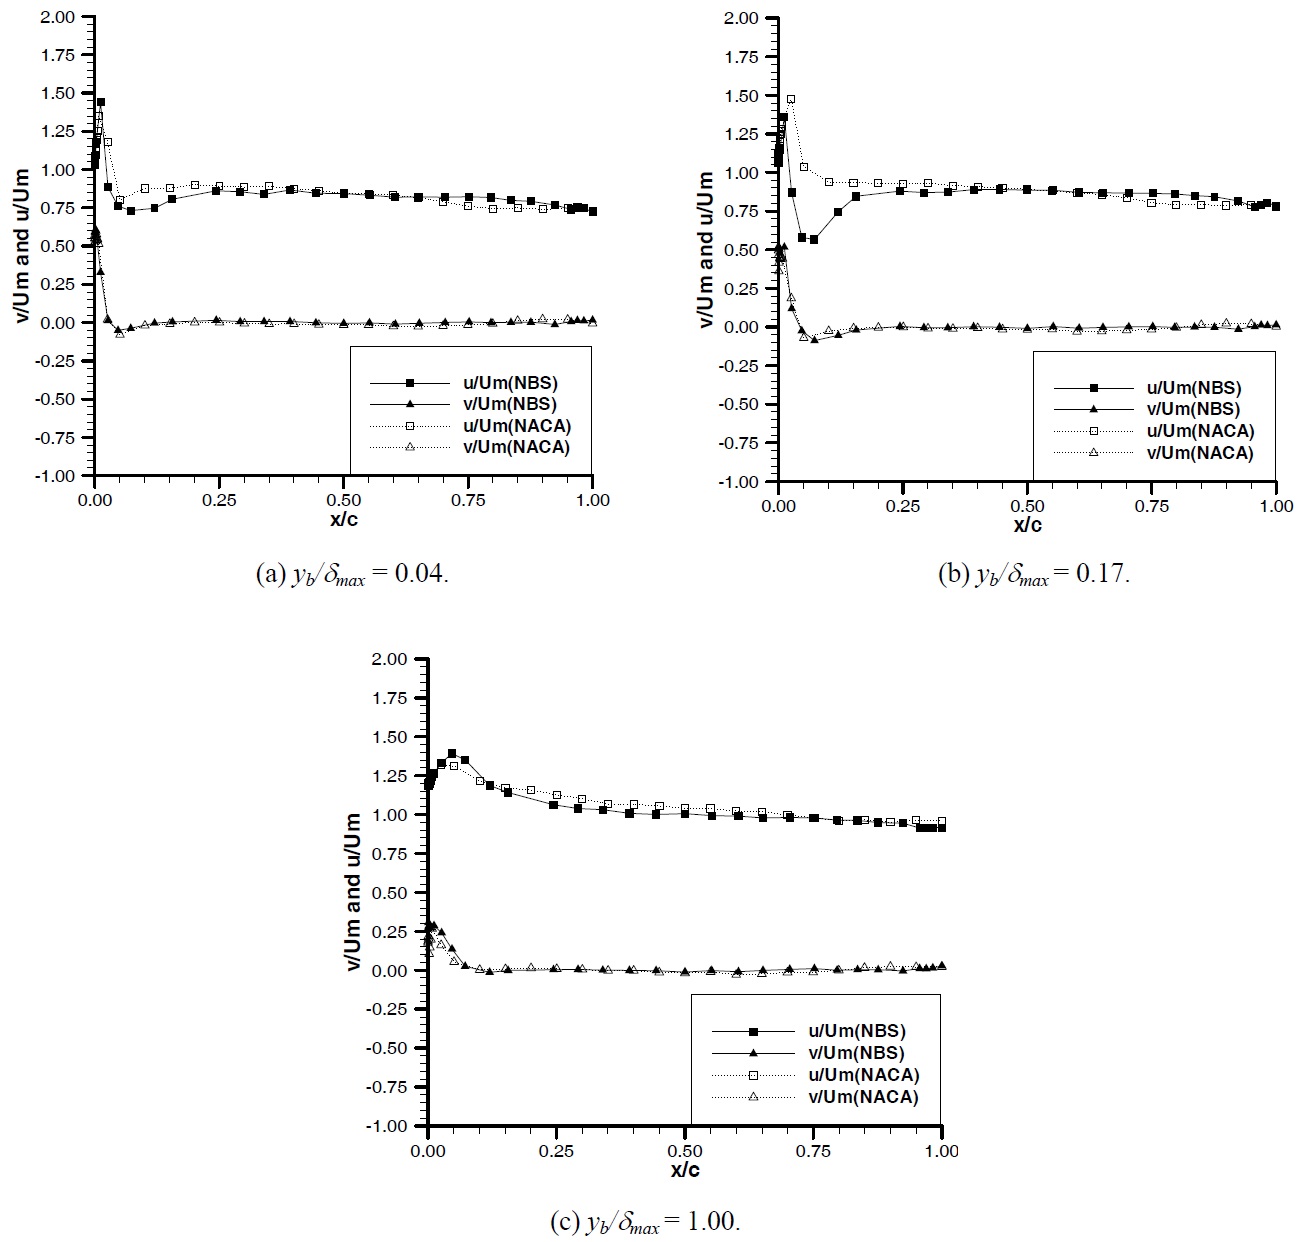
The local velocity components in the axial and transverse directions were collected by BURSTware software (Atlar et al., 1997) and stored in appropriate files. The axial component was in-line with the direction of the tunnel incoming flow, while the transverse component was horizontal to the axial component. From these files it was possible to obtain mean velocities, turbulence intensities as well as the time history of the collected data using this software.
In the following the mean velocity components

Distance from the leading edge of the hydrofoil,

and

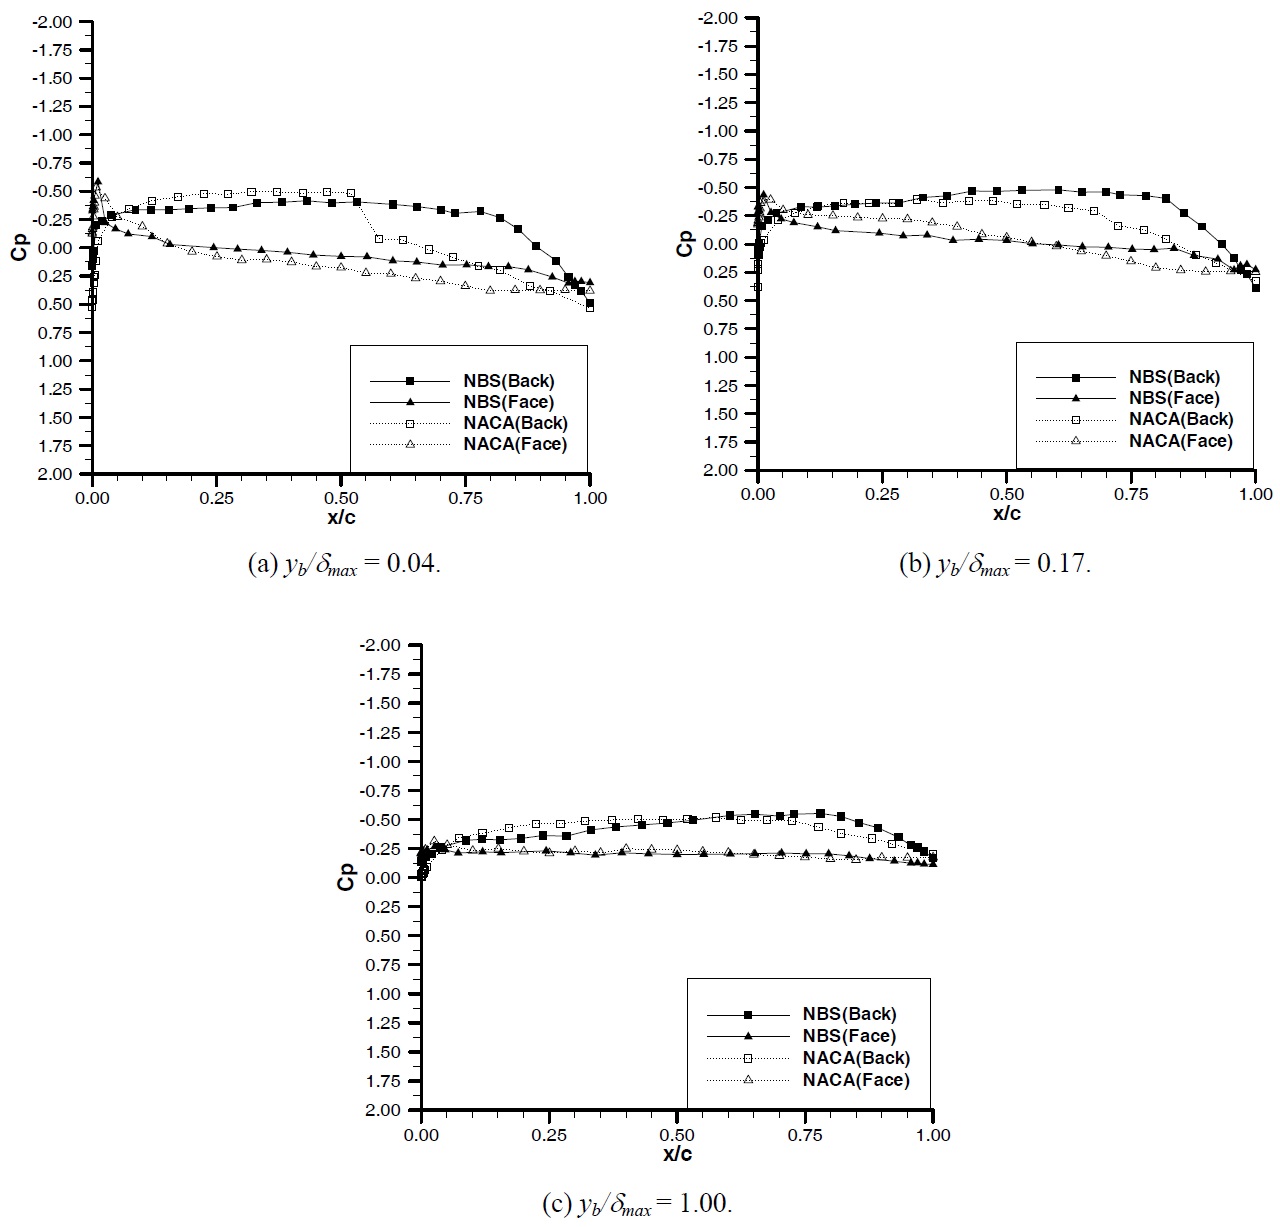
In representing the pressure distribution around the hydrofoils, the pressure values are calculated by means of the Bernoulli equation and expressed in terms of non-dimensional pressure coefficient,
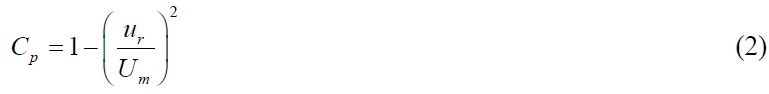
where
Cavitation bucket diagrams are also produced from local velocity measurements such as

The main objective of this group of the tests was to investigate the fundamental characteristics of the velocity, and hence pressure distribution around the NBS hydrofoil relative to its counterpart NACA hydrofoil, which represents a typical propeller blade section. The combined analysis of the local velocity measurements and earlier conducted cavitation observations with these hydrofoils could provide an answer why the earlier performed cavitation and hull pressure tests with the two model propellers, one of which had the NBS type section and the other had the NACA type section, presented inconclusive results such that no improvement has been achieved in the cavitation and hence hull pressure performance in contrast to the favourable predictions from the theory.
During the local velocity measurements, a wide range of test parameters was selected such that 2 hydrofoil types, 2 inflow speeds, 5 angles of attack, 5 distances from the wall and 60 velocity pickup points around the suction and pressure side of the hydrofoils. Although a detailed analysis of these effects could be very useful as a separate investigation in the long term, the present discussion is focused on the effect of the hydrofoil types on the velocity and hence pressure distribution, which is directly related to the cavitation characteristics.
As far as the angle of attack is concerned, the selected range of -3°, 0°, 3°, 6° and 9° was wider than the range selected in the bucket analysis obtained from the cavitation tests based on observation, which varied between -1° and 4°. However it was thought that such a wide range should reflect the trend in more dramatic fashion.
Detailed flow measurements (i.e. local velocity measurements) were performed at five different values of distances from the hydrofoil surfaces varying 0.25

where
During the tests the maximum Reynolds number value for 3
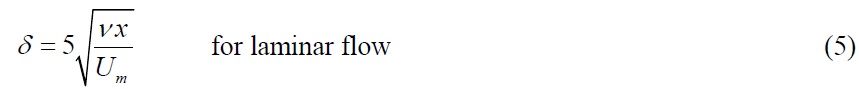
and

Both formulae may be used to calculate the local boundary layer thicknesses along the hydrofoils in an approximate manner. The local boundary layer thicknesses obtained from the formulae were in the range of 0 to 1.33
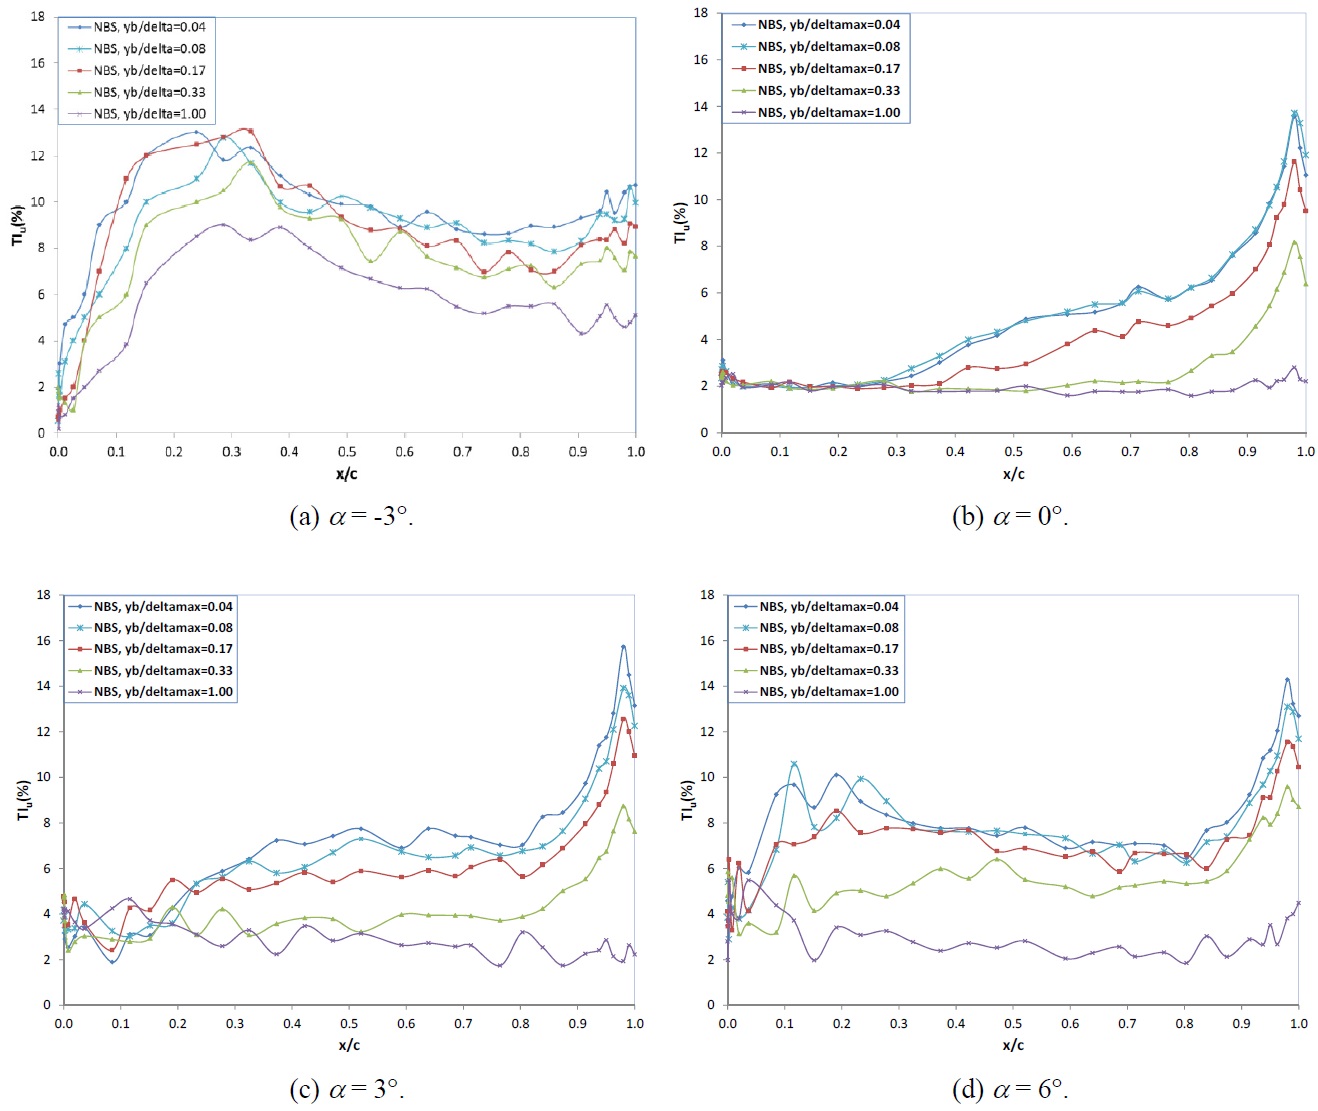
Background free-stream turbulence survey of the cavitation tunnel was carried by using the same 2-D LDA system and the axial component of the turbulence intensity,
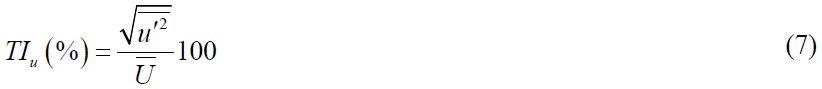
where
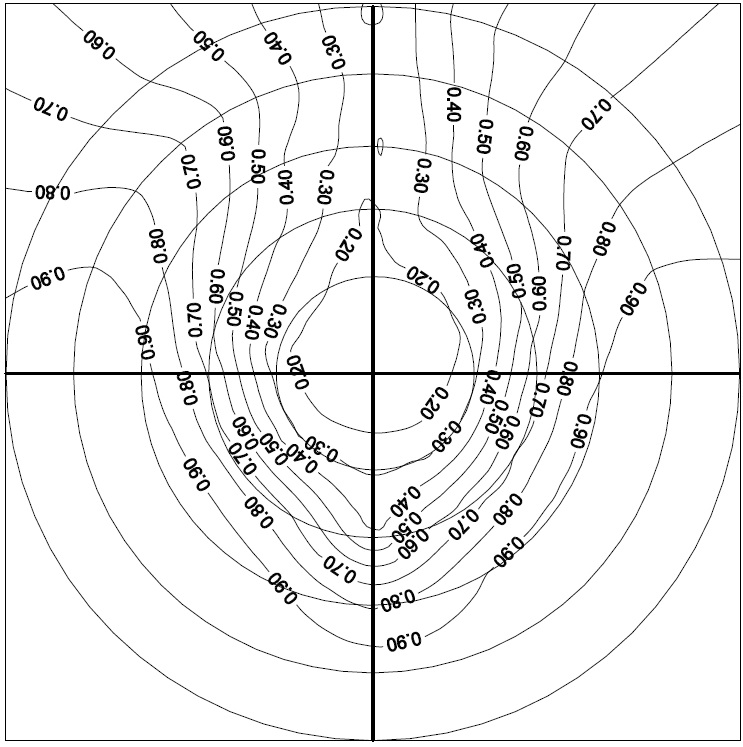
Fig. 6 shows the axial component of turbulence intensity distribution on the suction side of the NBS hydrofoil at
Although the local velocity measurements carried out at 5 angles of attack, two tunnel inflow velocities and 5 wall distances, here the results are presented only for
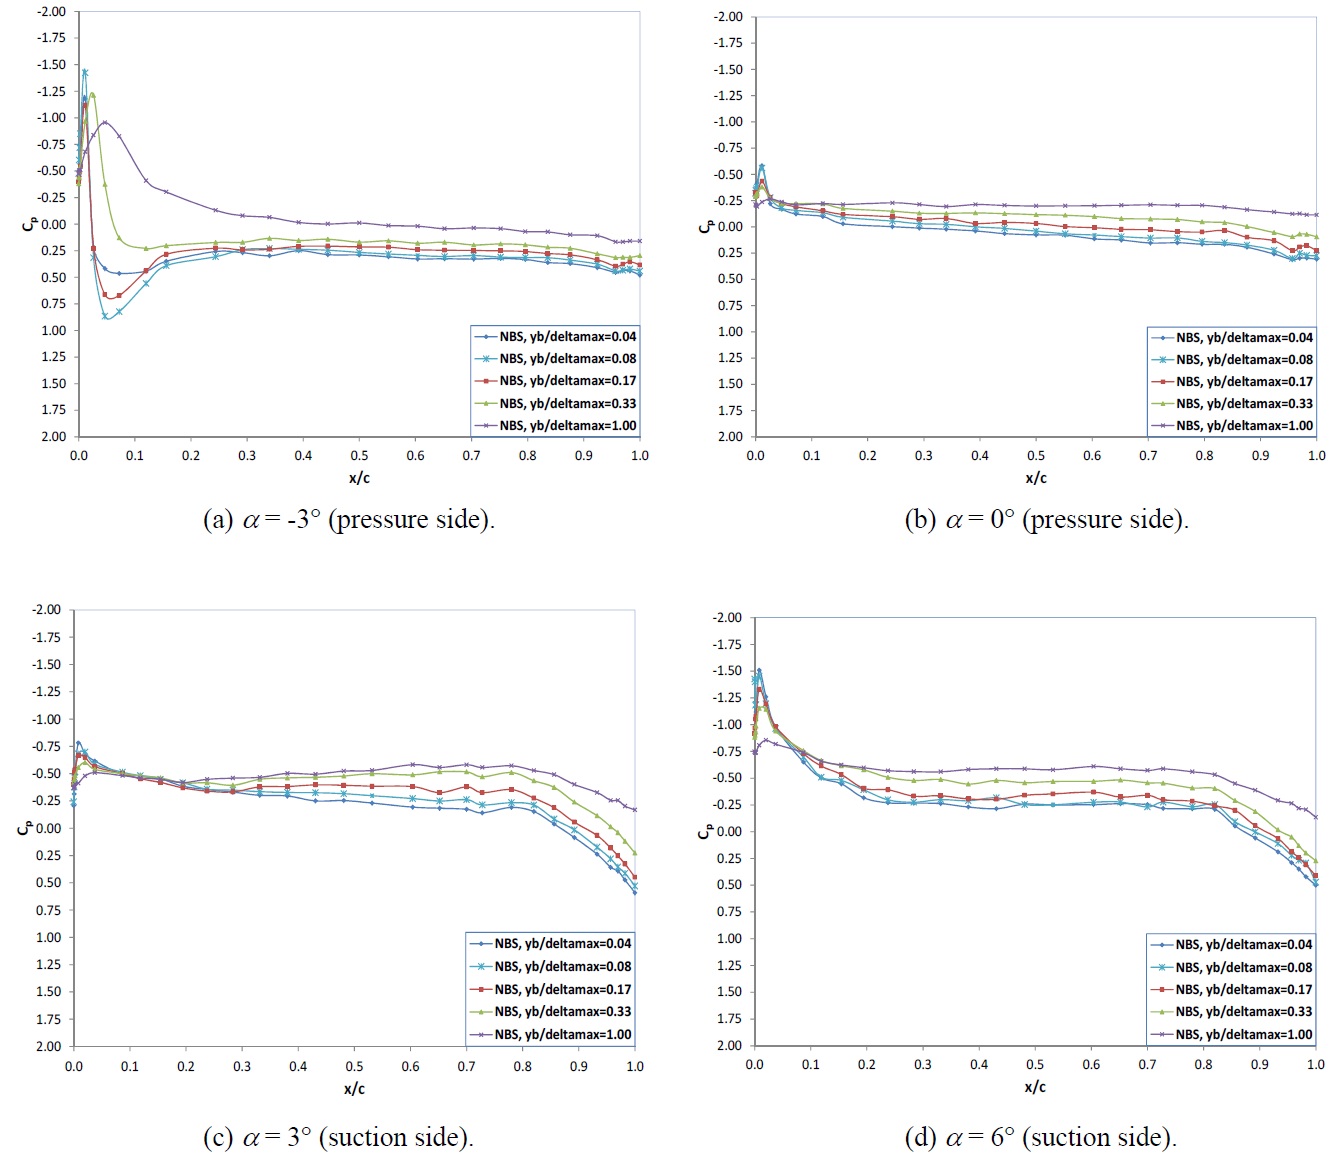
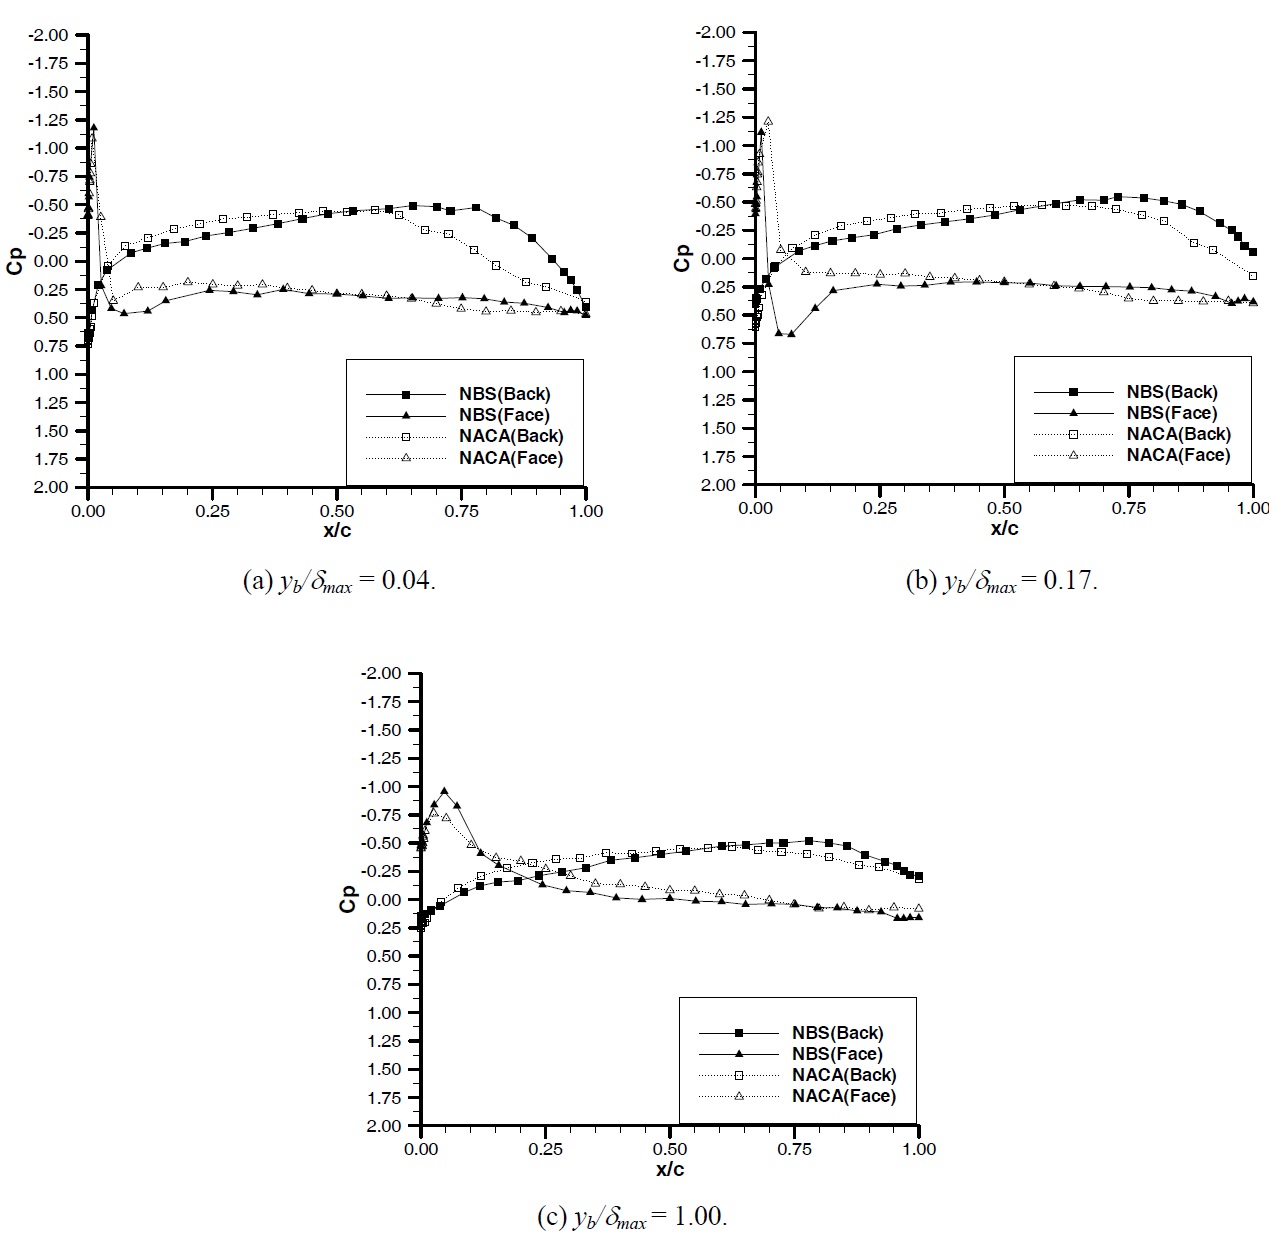
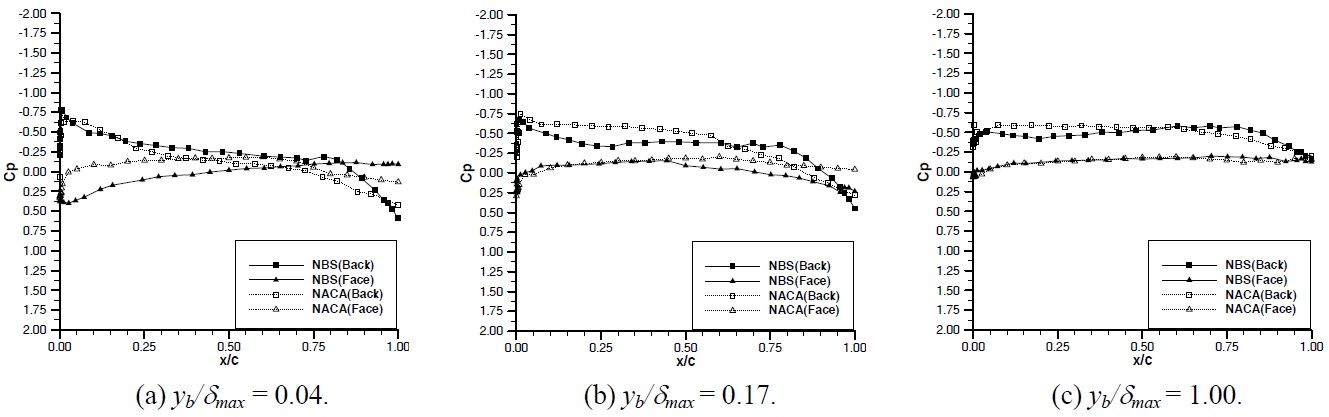
In Figs. 8 through 12, the comparison of the pressure distribution around the NACA and NBS hydrofoils are presented for each angle of attack at various measuring distances from the wall for the inflow velocity of 3
For angles of attack of -3° and 0°, both hydrofoils clearly indicate a strong tendency for sharp suction peaks at the face of the hydrofoils and hence a mechanism to generate a face cavitation. As the angle of attack is increased to positive 3°, 6° and 9° the suction peaks are observed at the suction side of both hydrofoils and hence displaying a mechanism for the suction side cavitation. For all the angles of attack tested, the suction peaks appear around the leading edge of both hydrofoils which is less than 3-4% of the chord length from the nose.
The magnitudes of the suction peak of the two hydrofoils at the leading edge are comparable. Although there are differences in the peaks from one case to another, these differences are not considerable and do not present any trend. However there is a very clear trend in the build-up of the suction peak for each hydrofoil such that the NACA hydrofoil displays larger suction compared to the NBS over the forward half of the hydrofoil while the NBS displays larger suction in comparison to the NACA over the aft half of the hydrofoil. Therefore the pressure gradient of NBS at the leading edge is much higher compared to the NACA section.
In order to investigate the above trend, one should consider the comparative pressure distribution of the two hydrofoils for each angle of attack. As shown in Fig. 8 at the angle of attack of -3° the pressure side suction peaks of the two hydrofoils at the
leading edge are comparable for varying wall distances displaying similar trends. Over the majority of the forward half of the hydrofoil, the tendency to produce more suction at the pressure and suction sides of the hydrofoil is more prominent for the NACA compared to the NBS. However at the leading edge NBS displays remarkably strong suction peak which is comparable or even worse in some cases.
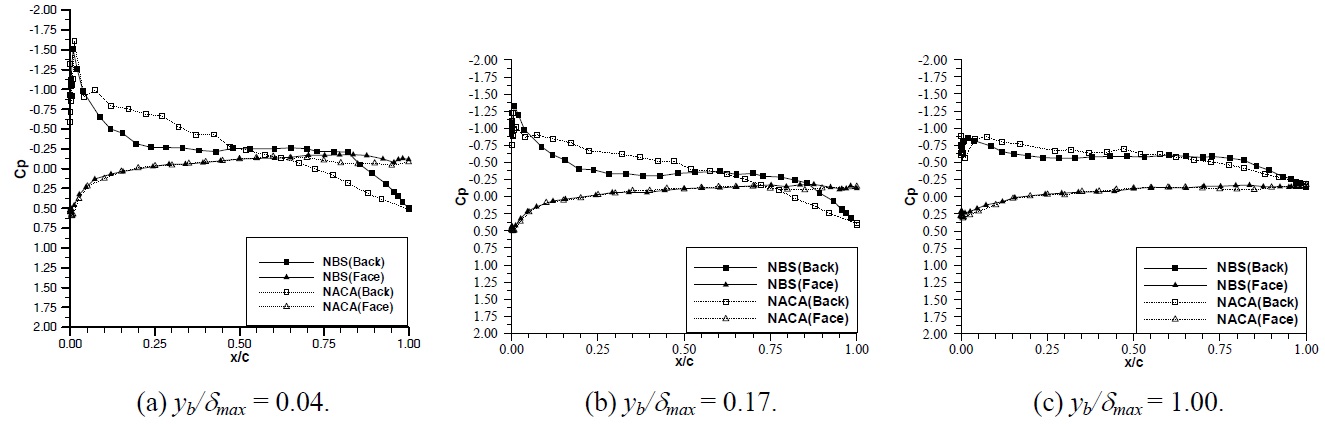
If one considers the pressure distribution at angle of attack 0°, as shown in Fig. 9, although the magnitude of the suction and its gradient is reduced, the previous trend can be still observed. When the angle of attack is set to 3°, as shown in Fig. 10, the suction peak is generated at the suction side of the both hydrofoils, as expected, but the earlier observed trend in terms of the pressure distribution and the large pressure gradient at the leading edge of the NBS hydrofoil is still obvious.
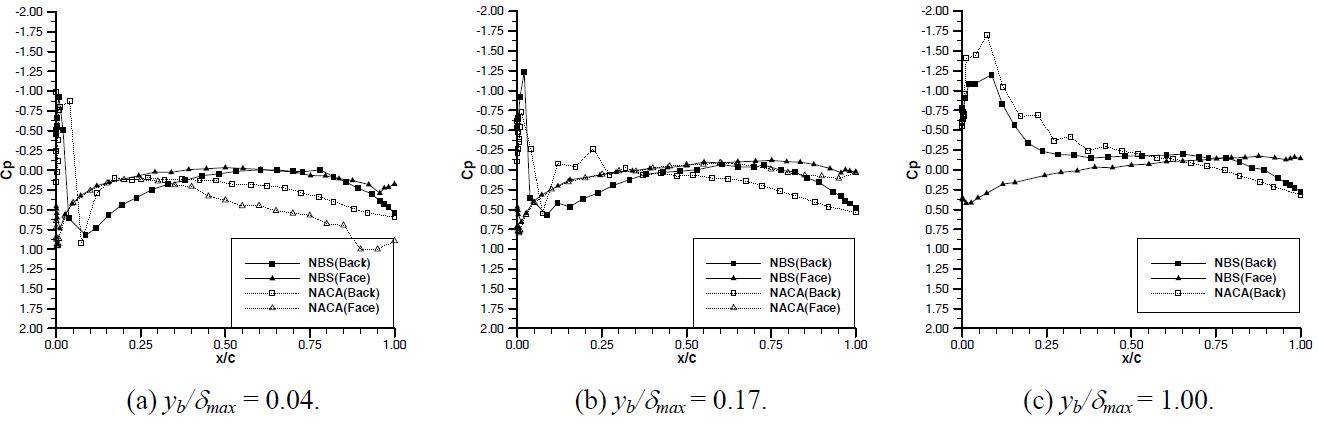
In Fig. 11, the comparative pressure distribution is given at an angle of attack of 6°. The trend for the pressure distribution at the suction side is still the same whilst at the pressure side both hydrofoils display similar distribution. Fig. 12 shows the pressure distribution at an angle of attack of 9°. In spite of the oscillations in the pressure distribution the earlier trend can be observed. At this angle of attack strong flow separation was observed during the tests.
It is obvious that the above observed trend in the pressure distribution, which displays strong tendency to generate suction at the forward half of the NACA hydrofoil and relatively less but similar tendency to generate suction at the aft half of the NBS hydrofoil, can be directly related to the position of the maximum thickness for each hydrofoil. The NBS section with its maximum thickness being located behind the mid-chord displays weaker suction effect at the forward half of the hydrofoil compared to the NACA section whose maximum thickness is located at the mid-chord of the hydrofoil and hence provides strong suction effect.
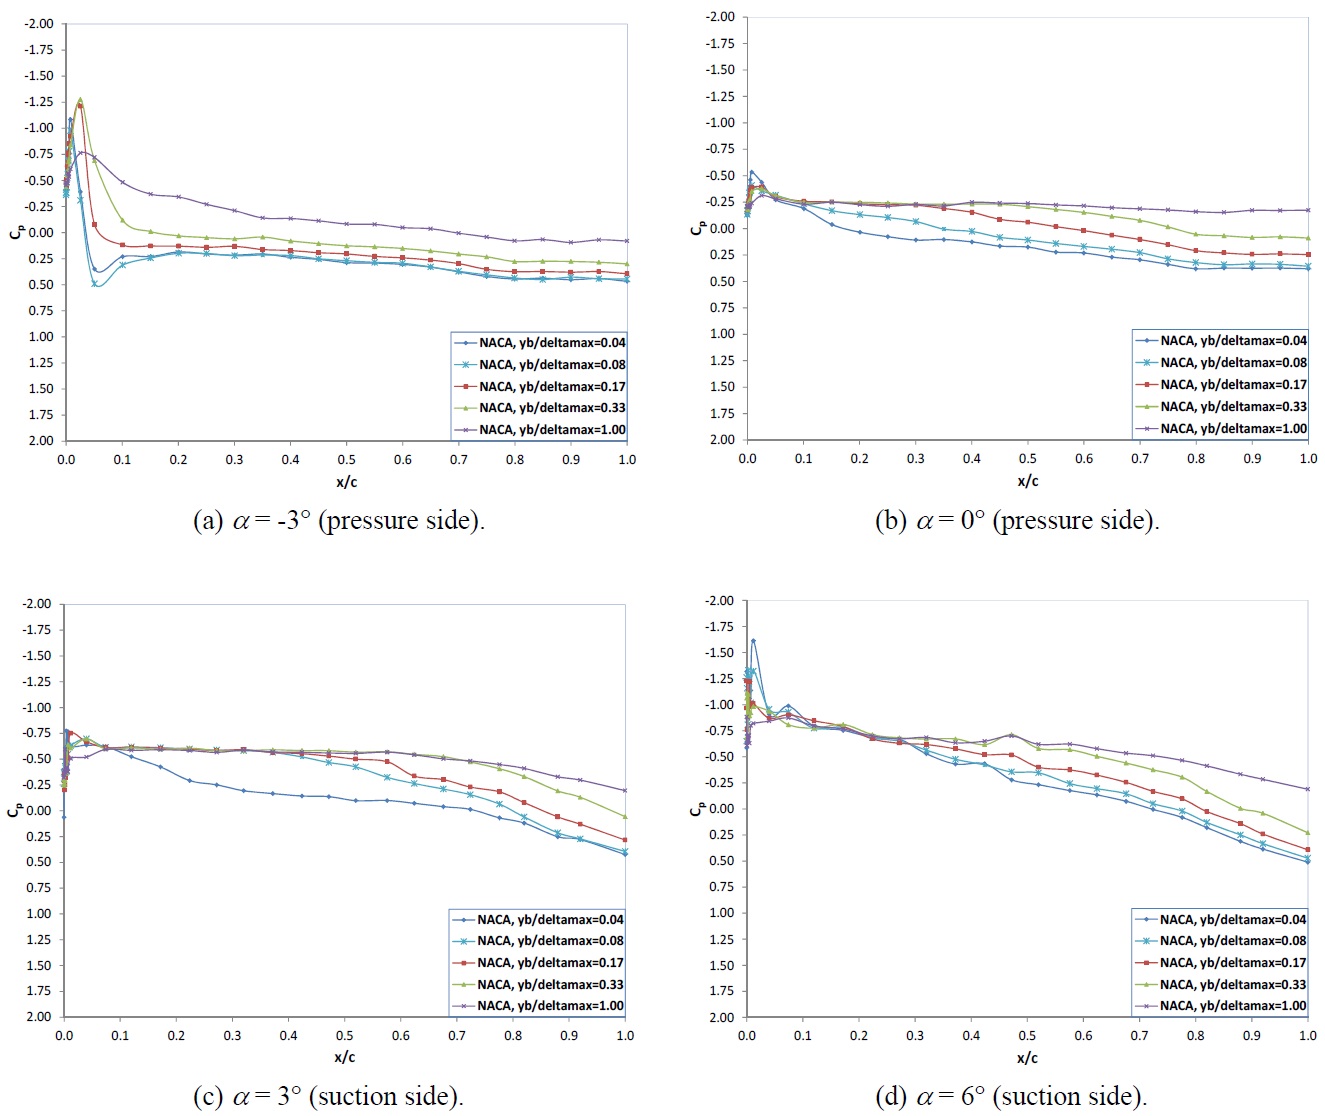
Figs. 13 and 14 show comparisons of the local pressure distributions on the pressure/suction side of NBS and NACA hydrofoils for different wall distances at
Fig. 15 shows cavitation bucket diagrams of both hydrofoils produced from the LDA measurements. In this figure angle of attack of 9
Bearing in mind the earlier stated considerations, if one attempts to relate the findings from the pressure analysis to the findings from the bucket analysis based on the observations, there is consistency between two test results which can be described as follows:
Although the range of the angle of attack tested in the velocity measurements (i.e. -3° to 9°) is much larger than the bucket tests (i.e. -1° to 4°), the cavitation onset observed in the inception tests was always at the leading edge for both hydrofoils regardless it was suction side or pressure side cavitation. This observation is well supported by the trend in the pressure distribution.
During the inception tests, as the angle of attack was ranged from -1° to a small positive value of the angle of attack, the observed cavitation was the pressure side cavitation and its onset was sudden as a flash at the leading edge. At relatively large positive angles of attack up to a maximum of 4° the observed cavitation was suction side cavitation and its onset was gradual contrary to the sudden pressure side cavitation. This observation is also well supported by the pressure distribution analysis such that at -3° and 0° of angles of attack the leading edge pressure peak develops on the pressure side of the hydrofoils while at 3°, 6° and 9° the pressure peaks are at the suction side. The gradient of the pressure at the pressure side of the hydrofoils for -3° and 0° is much higher than the gradient of the pressure at the suction side of the hydrofoil for 3° of comparable positive angle of attack. Therefore the sudden appearance of the pressure side cavitation in comparison to the gradual built-up of the suction side cavitation can be related to the high pressure gradient at the negative and 0° values of angle of attack.
Based upon the above discussion one can conclude that the trend in the cavitation buckets of the two hydrofoils obtained from the laser measurements supports the trend in the cavitation buckets of the hydrofoils. Nevertheless, the comparative analysis of the buckets indicated a relatively small but favourable bucket for the NACA compared to the NBS between angles of attack of -3 and 3
Because of this fact the leading edge cavitation characteristics of the NBS profile are relatively worse than the NACA profile. In essence, in spite of a number of major simplifications and assumptions which are stated prior to the discussion, the laser analysis of the velocity, and hence the pressure distribution, supports the findings from the bucket analysis of the hydrofoils.
An experimental study was carried out to investigate flow characteristics of alternative 2-D blade sections of rectangular planform, one of which was New Blade Section (NBS) developed in Newcastle University and other was well known NACA section. The tests involved the cavitation observations and the measurements of the local velocity distributions around the blade sections by using a 2-D LDA system. From the two sets of major tests the following conclusions are found:
The cavitation tests of the two hydrofoils indicated that the onset of the cavitation was always observed at the leading edge. At negative angles of attack and small positive angles of attack up to about 1°, a pressure side cavitation was observed while at angles greater than 1° suction side cavitation was observed.
The pressure distribution analysis around the two alternative blade sections supported the analysis of the cavitation tests based on observations such that the both hydrofoils displayed strong suction peaks at the leading edge regions. Pressure peaks of the hydrofoils at the leading edge region are comparable. Therefore a slightly larger value of NBS pressure peak would onset the inception and hence narrower bucket arms for the NBS.
In terms of the local pressure distribution, the fundamental difference between the two sections is that the NBS with sword like forward entry caused by the shift of the position of the maximum thickness towards the trailing edge presents lesser suction effect approximately along the forward half of the hydrofoil compared to the NACA. Whereas, the NACA hydrofoil, which has its maximum thickness at the mid-chord, displays lesser suction effect along the after half of the hydrofoil compared to the NBS.
The method used to develop the NBS section did not predict tip vortex cavitation well and resulting in the failure of the NBS section for the propeller application. The method should use or investigate a proper tip vortex cavitation model for the prediction in order to obtain better section design.
One can suggest that overall pressure distribution of the NBS section appears to be more sensitive to cavitation compared to the NACA section. This can be closely related to position of maximum thickness and its backward distribution as well as the fundamental shape of very fine leading edge. Therefore a further investigation into the modification of the thickness distribution and leading edge should be considered to improve cavitation behaviour of the NBS hydrofoil.