High-speed vessels are mostly supported by buoyancy at low speed, but at high speed, they are raised by additional hydrodynamic lifts or aerodynamic forces in order to reduce their wetted surface area and resistance. A planing craft is one of the most general types of high-speed vessels, and considerable portions of their weights are supported by the lift forces acting on the hull bottom. The characteristics of planing hull shapes, such as deadrise angles, and the shape or the number of chines, have significant influences on the hydrodynamic performance of planing hulls. Therefore, planing hulls should be designed to meet desired performance. Generally, the resistance or seakeeping performance of planing crafts may be predicted by model tests in the initial design stage.
There are some previous researches about high-speed model tests in calm water or in waves. Fridsma (1969) carried out experimental investigations about the effects of deadrise angle, displacement, length to beam ratio, and location of center of gravity on the running attitudes of planing hulls in calm water and their motion responses or vertical accelerations in regular waves. Savitsky and Brown (1976) proposed empirical formulas for calm water resistance, added resistance and bow acceleration in waves and lifts acting on stern wedges of prismatic planing hulls. Gerritsma et al. (1992) carried out high-speed model tests for the prediction of resistance and stability of some planing crafts. Ikeda et al. (1995, 1996) and Katayama et al. (2000) set up an unmanned high-speed towing carriage, and then performed various captive model tests or motion measuring tests with that carriage. Lee et al. (2005), Kim et al. (2006) tried to improve the resistance performance of high-speed vessels through the model tests. Kim et al. (2009a, 2009b) performed high-speed model tests for measuring running attitudes in calm water and vertical motion responses in regular waves. In particular, most domestic researches were focused on one area between resistance and seakeeping performance. Planing hulls need to be designed with consideration of various hydrodynamic characteristics, and if necessary, those hull forms should be modified to improve resistance or seakeeping performance in the initial design stage
A desired planing vessel in this research is to run at Froude number 3.25 in calm water, and operate in rough water, above sea state 3, so good resistance and seakeeping performance are required. Three hull forms which have almost the same principal dimensions are designed, and model tests in calm water and in waves are carried out to analyze their resistance performance and seakeeping behavior. A high-speed towing carriage in Seoul National University is used to perform the model tests. The running attitudes and resistance are simultaneously measured with various Froude number in calm water tests. Heave and pitch motions are measured in regular waves with various wave lengths, and the effects of hull forms on seakeeping behavior are analyzed. In addition, vertical accelerations on specific positions of the models are measured around the resonance frequencies and compared with each other. Although there are some limitations during the model tests, it is possible to estimate the hydrodynamic performance of real ships qualitatively. Required improvement in the model test is specifically mentioned in the sections hereafter.
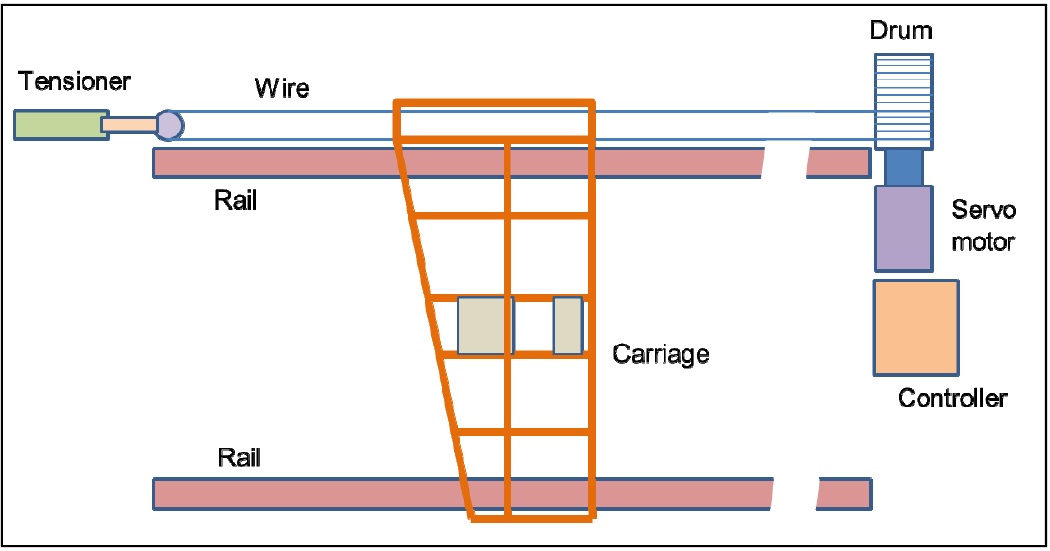
Fig. 1 shows the plan view of a high-speed towing carriage in Seoul National University towing tank (Length× Breadth × Depth : 117
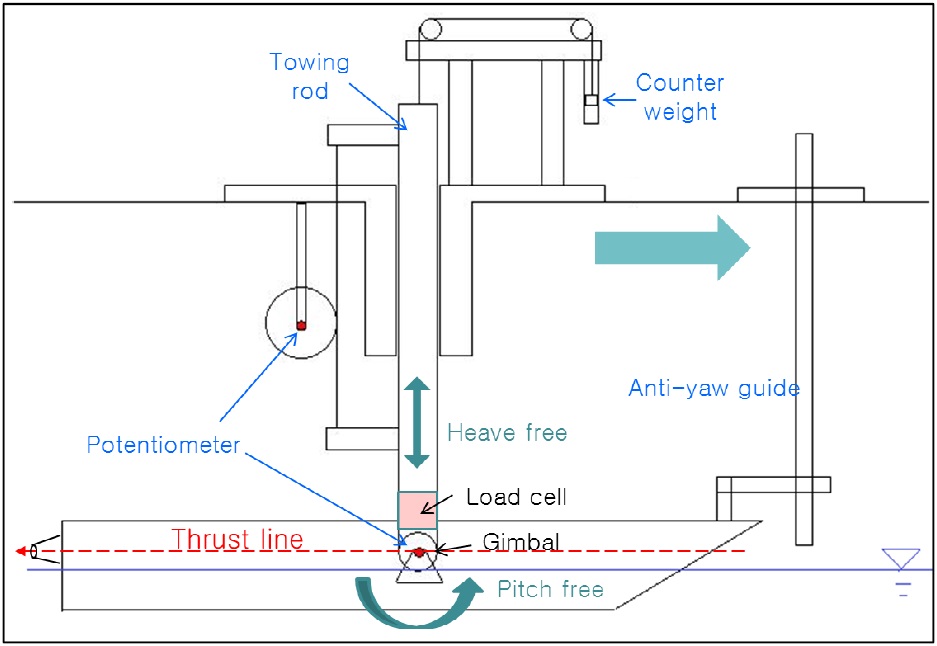
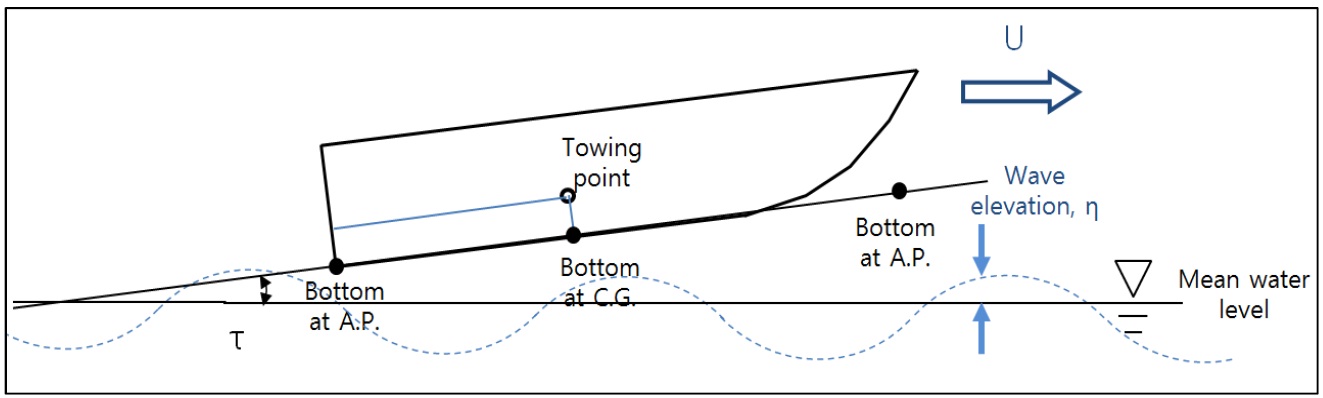
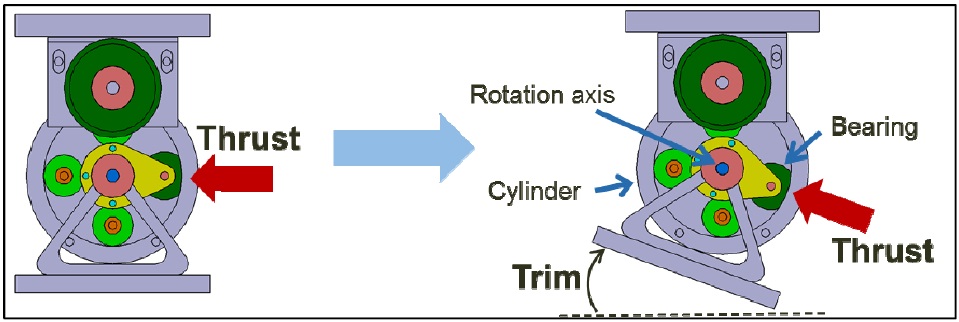
Fig. 2 shows the side view of a vertical motion measuring device. A towing point is located at the center of gravity in the longitudinal direction, and on the thrust line in the vertical direction. Heave and pitch motions of the model ship are measured by potentiometers.
In previous model tests, the towing point of a model ship was a simple hinge type in order that the model ship was free to pitch motion. Even though the model ship was trimmed, the towing direction was always the same as the advance direction of a towing carriage, in other words, the forward direction parallel to the free surface. Propulsion system is fixed on the vessel, so the thrust direction is inclined when the model ship is trimmed. A new gimbal is developed so that the model ship can be towed in the inclined thrust direction when the model ship is trimmed while running.
The operating mechanism of the new gimbal is shown in Fig. 3. Towing force is delivered from the cylinder to the rotation axis of a model ship via a bearing. The bearing cannot deliver the tangential force, so the towing force is only delivered in the normal direction, in other words, in the trimmed thrust direction.
The towing force is measured by a load cell which is located at the bottom of the towing rod. Measured force in the direction parallel to the free surface is converted to the model ship resistance in the thrust direction, corresponding to the running attitude of a model. An anti-yaw guide is installed around the bow of a model in order to prevent its yaw motion.
The towing rod is counter-balanced by the counter weight, so there are no effects of its weight on the displacement or the running attitude of a model at steady state in calm water. But in the model tests in waves, the towing rod and the counter weight do have influence on the motion of a model ship. It is predicted that the resonant frequency of a model ship is different from that of a real ship. The weights of the towing rod and the counter weight are respectively 4.4
This study is focused on the qualitative comparison of hydrodynamic performance of each model ship. Meaningful results can be obtained by the model tests under the same conditions in spite of limitations on the test device. Limitations in the model tests should be considered when a real ship is designed.
HULL FORM DEVELOPMENT CONCEPT AND PROCEDURE
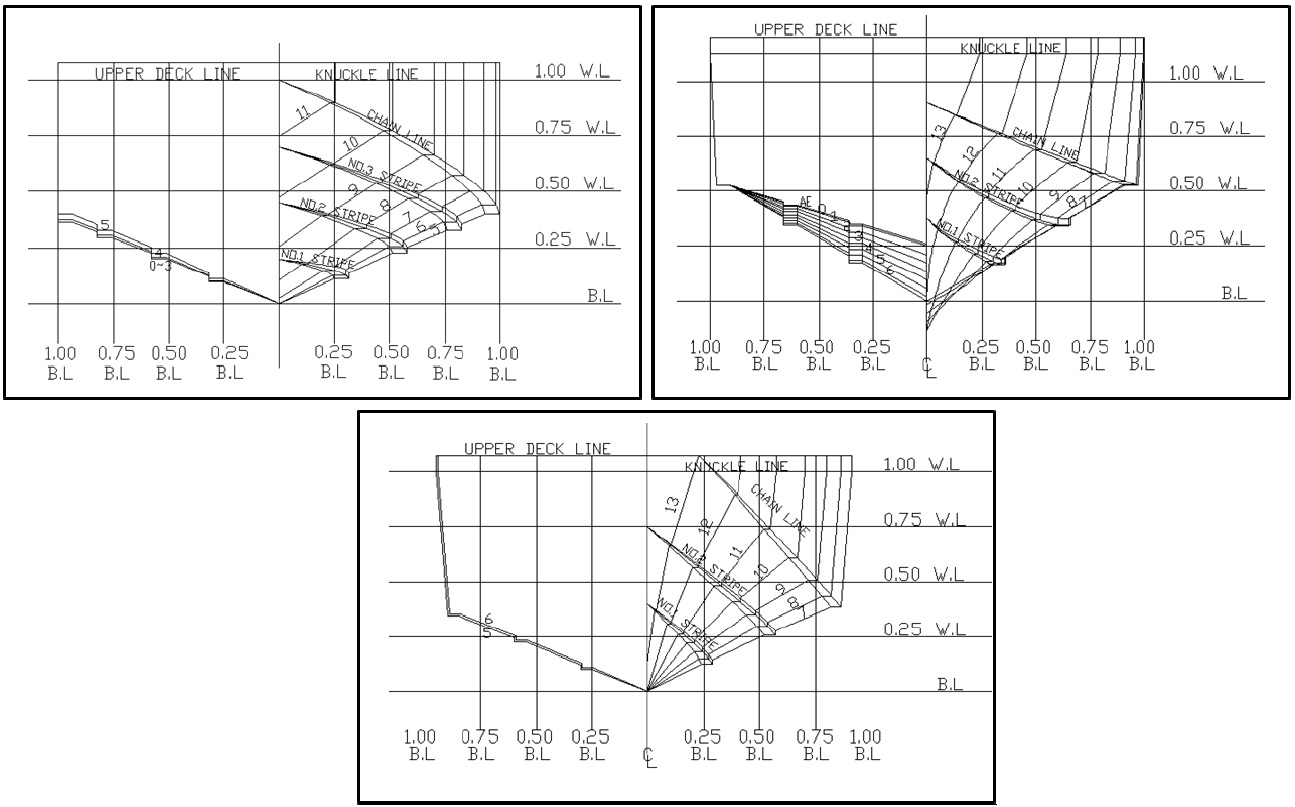
Three model ships are designed and those hydrodynamic characteristics are estimated by high-speed model tests. All model ships are hard-chine planing mono-hulls. Body plans of three model ships are shown in Fig. 4.
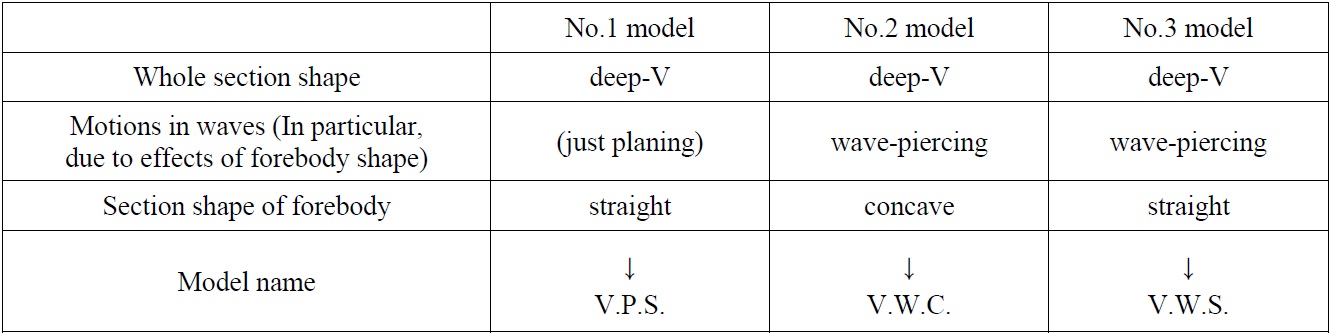
Main characteristics of hull shapes for three model ships are shown in Table 1. All model ships are deep-V types. The bows of no.2 and no.3 model are designed to be favorable for wave-piercing motions in rough water. Forebody sections of no.1 and no.3 model ships are designed as straight shapes, and that of no.2 model ships are concave shapes. If ‘V’ is short for deep-V type, ‘P’ and ‘W’ is short for planing and wave-piercing, and ‘S’ and ‘C’ is short for straight and concave section shape, then no.1, no.2 and no.3 model ships can be named as VPS, VWC, and VWS as shown in Table 1.
[Table 1] Characteristics of hull shapes of model ships.

Characteristics of hull shapes of model ships.
[Table 2] Principal dimension of model ships.
Principal dimension of model ships.
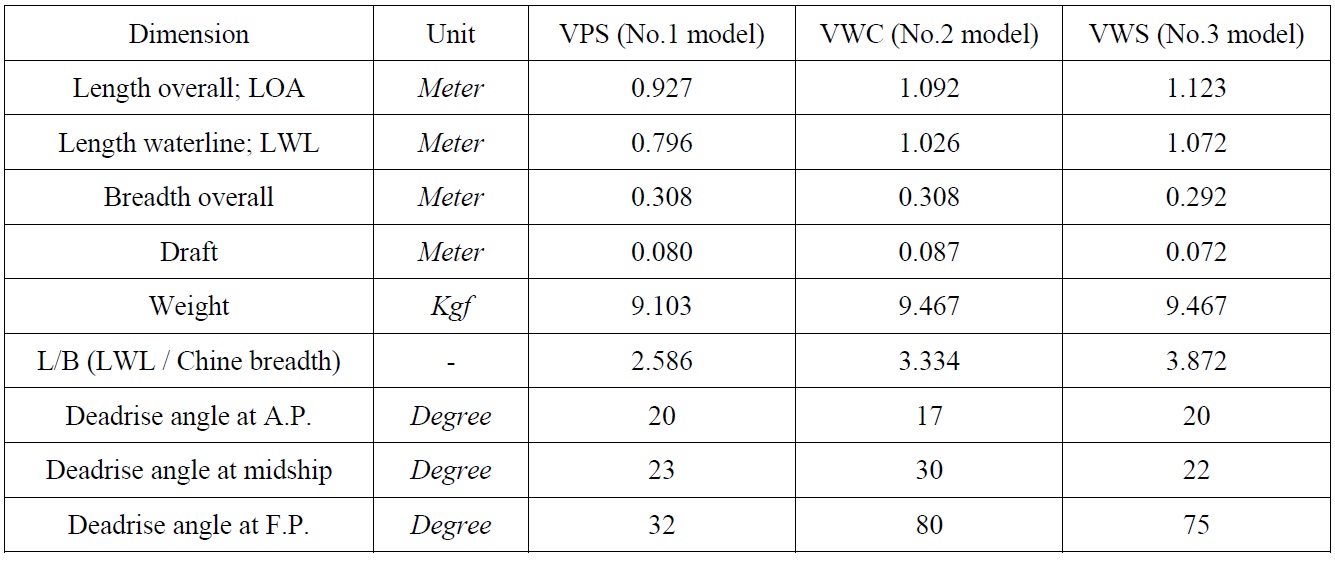
Principal dimensions of them are shown in Table 2. Scale ratios of the model ship and the real ship are the same, 1/6.5. Maximum speed of the real ship is 45
In general, when deadrise angles of a planing hull with vee-bottom get smaller, trim angle is decreased and the hull rises up higher so that it shows good resistance performance. But its vertical motion amplitude in rough water becomes larger, and the course-keeping ability gets worse. On the other hand, when deadrise angles are larger, seakeeping performance and coursekeeping ability of the planing hull improve, but its resistance performance becomes worse. Excessive deadrise angles have control difficult at low speeds and reduce the transverse stability when the hull is planing. Therefore, proper deadrise angles should be selected with consideration of hydrodynamic performance of the planing hull. Furthermore, planing hulls may have various cross-section shapes such as straight, convex, concave, etc.. It is focused on the conceptual design for a small planing hull in this study. So afterbody cross-sections of the hulls are designed as straight shapes which show typical characteristics of planing surfaces.
All model ships are designed with the variations of deadrise angle, section shape, and length-to-beam ratio. And the number or the arrangement angle of spray rails and the forefoot contour are also varied. VPS (no.1) model is designed to minimize the required power. It has the smallest deadrise angle among three model ships. Deadrise angle on the afterbody is around 20
VWC (no.2) model is designed to improve seakeeping performance in waves. Deadrise angles at A.P., midship, and F.P. are 17, 30, and 80
After analyzing the model test results for VPS and VWC models, VWS (no.3) model was designed in order to have both favorable resistance performance and seakeeping behavior simultaneously. Deadrise angles of VWS model are around 22
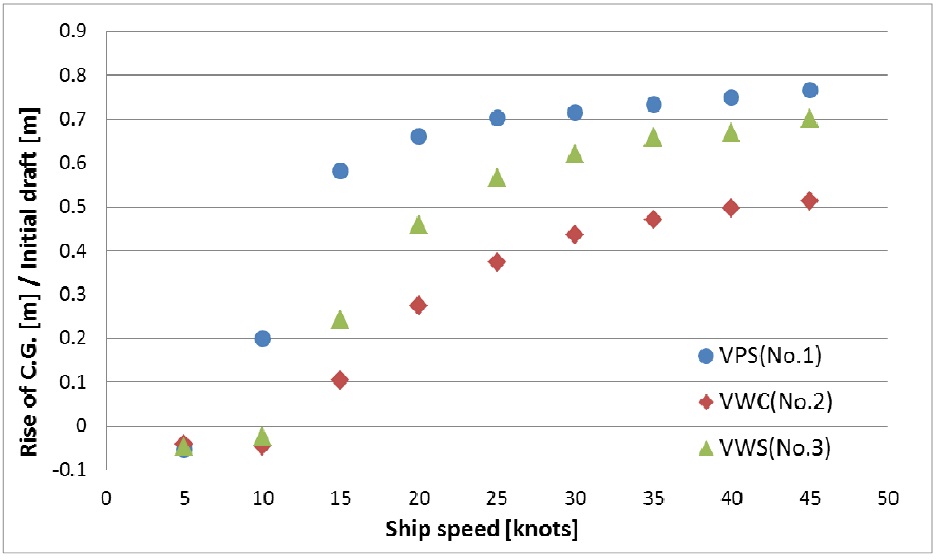
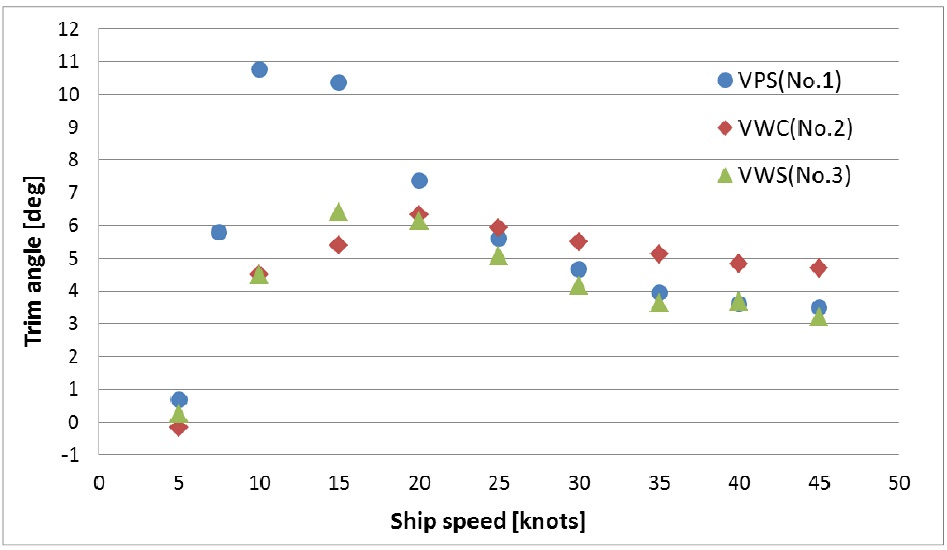
Rise of the center of gravity, trim and resistance of each model ship are measured at various speeds in calm water. Speeds are varied 5 to 45
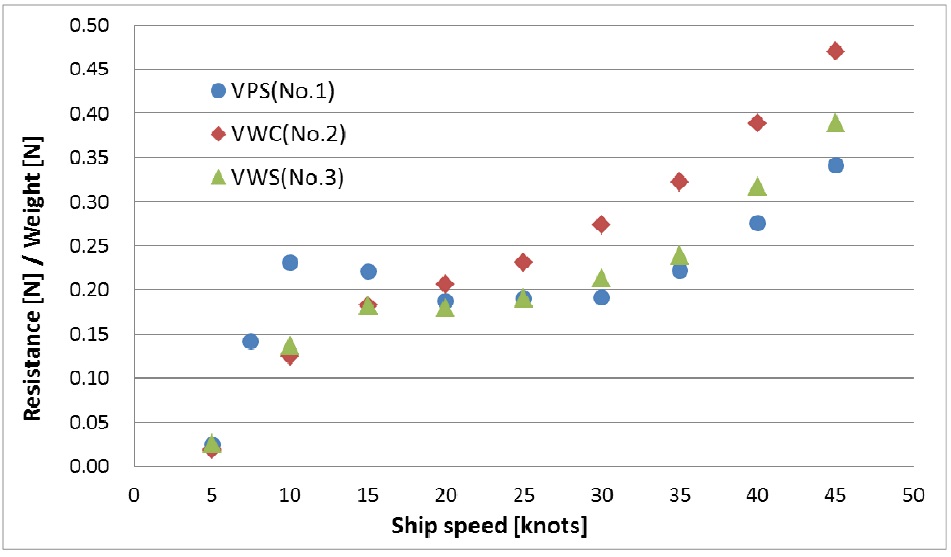
Running attitudes of model ships at maximum Froude number are shown in Fig. 6. Variations of rise, trim and resistance of each model ship with real ship speed are shown in Figs. 7 to 9. At maximum Froude number, the rises of VPS, VWC and VWS models are 75%, 50% and 70% of the initial draft, and trims are 3.5, 5.0 and 3.0
The resistance of VPS model is largest at around 10 to 15
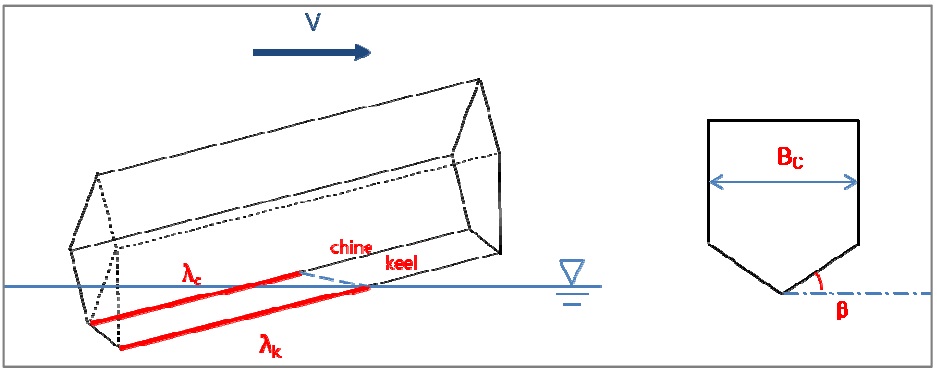
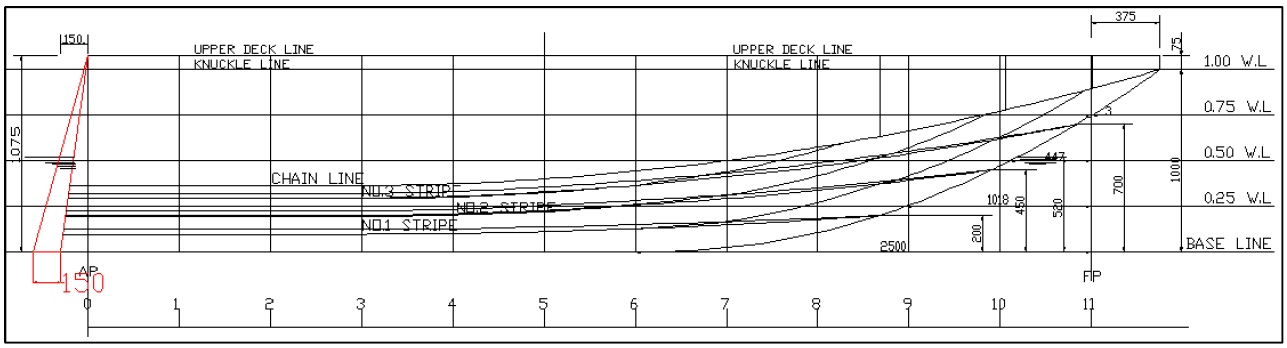
In general, the wetted bottom shape of a hard-chine planing hull is as shown in Fig. 10.


Total resistance (

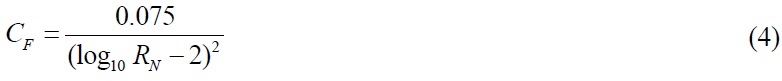
Frictional resistance coefficients are obtained by ITTC 1957 model-ship correlation line (Lewis, 1988) as shown in Eq. (4). Reynolds number,
Residual resistance coefficient,

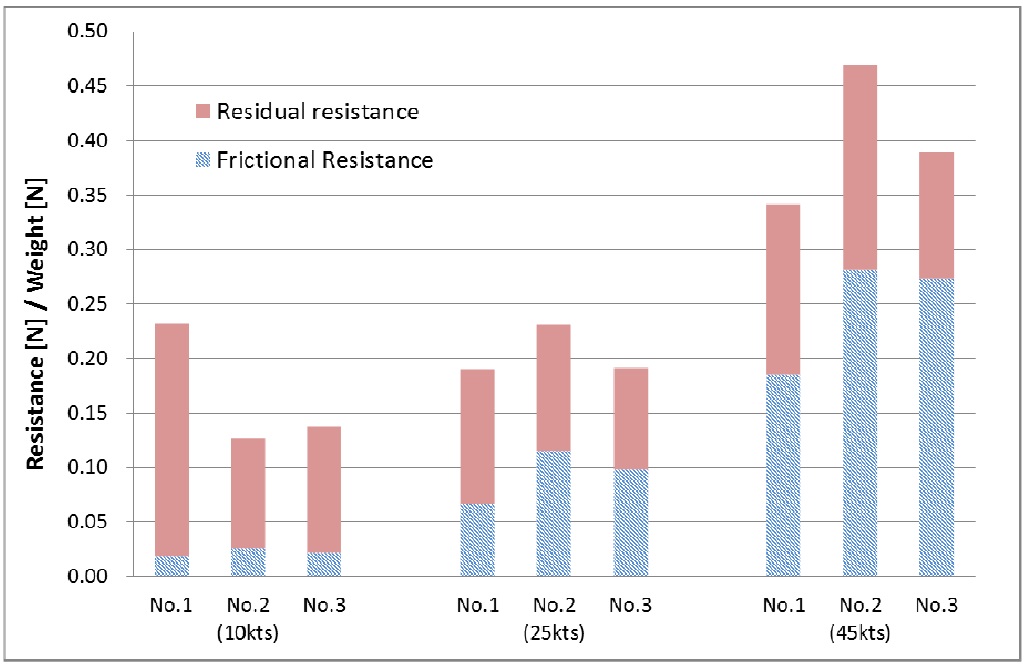
Resistance components of the three model ships at 10, 25, and 45
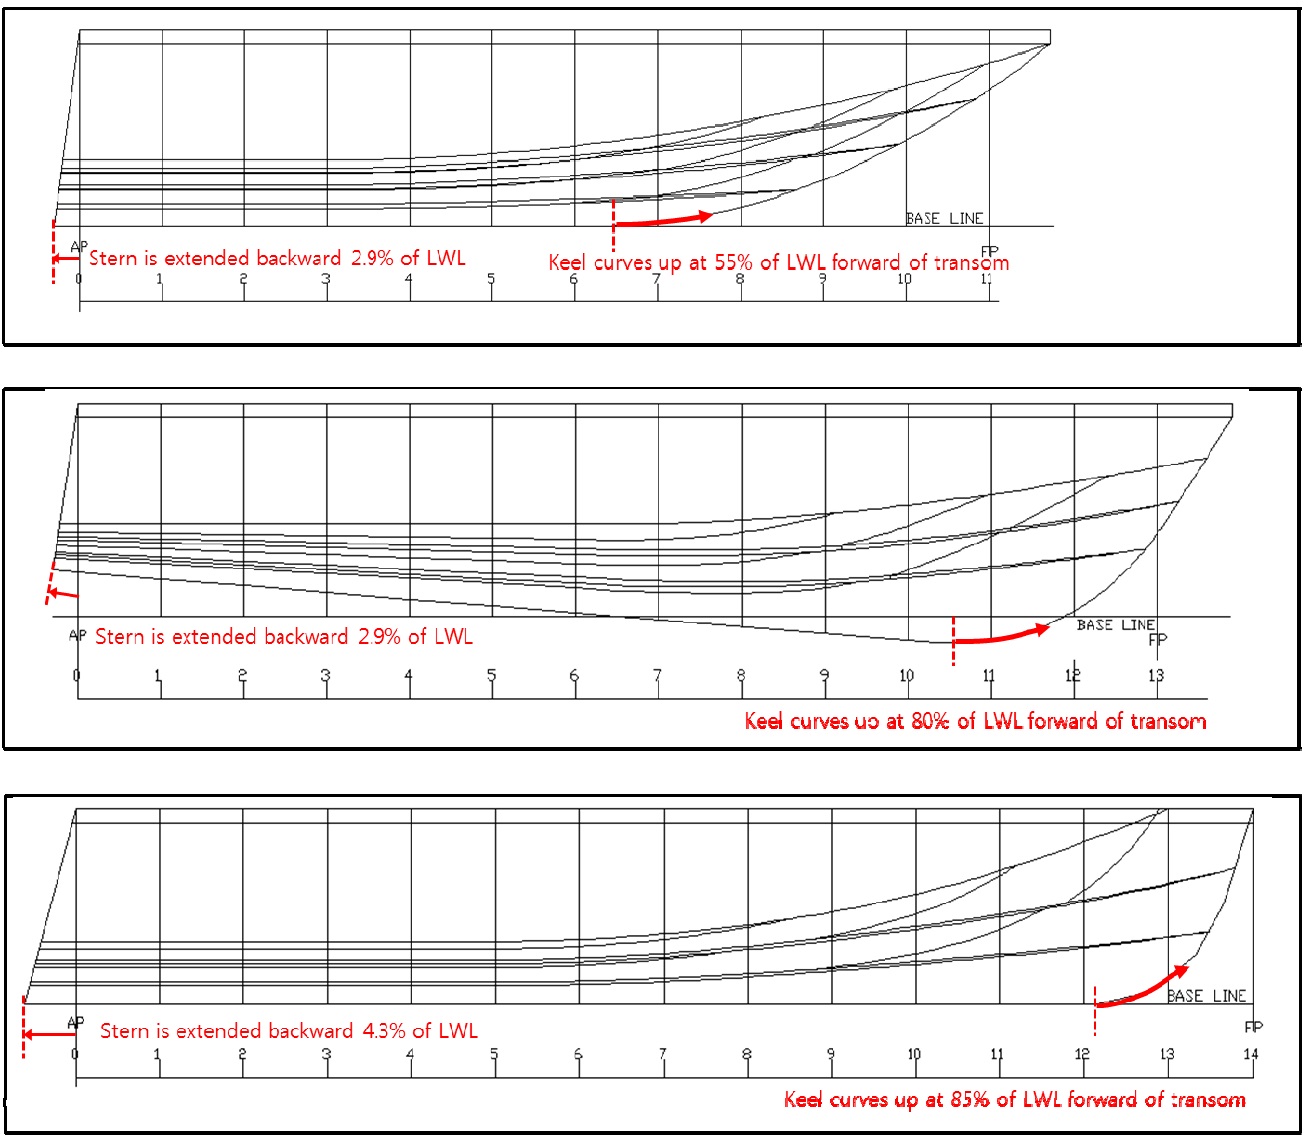
The bottom of VPS model is extended backward from the A.P. section, by 2.9% of the length of waterline. And then, the extended length of the bottom of VPS model doubles to reduce trim angles and required powers at high speed. A side view of the extended stern of VPS model is shown in Fig. 12.
It was predicted that the running trim and resistance of VPS model would be changed due to the bow-down moment caused by the extended hull bottom. After modifying the hull bottom as above, however, there were no significant changes in running attitude and resistance of VPS model at 10 to 40
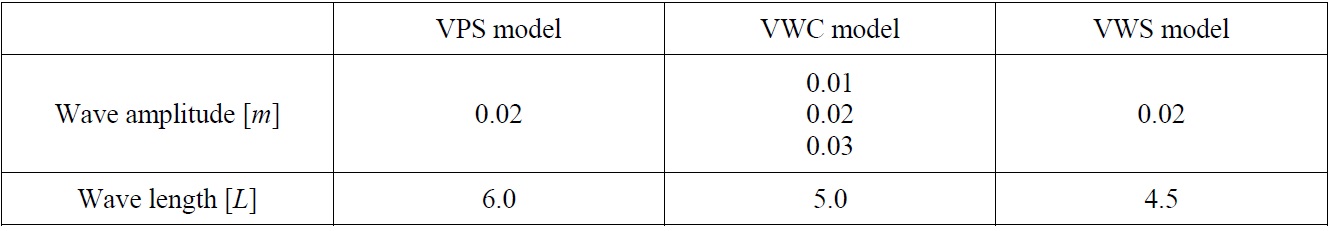
Heave and pitch motions are measured in regular waves with various wave lengths. Wave amplitude is 0.02
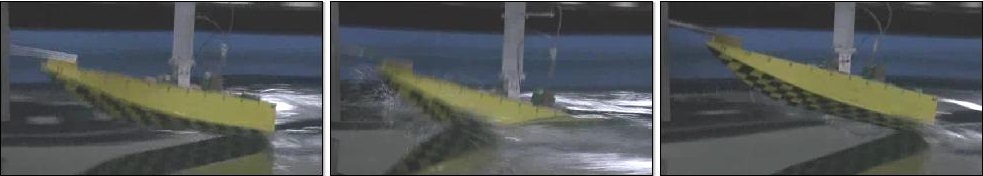
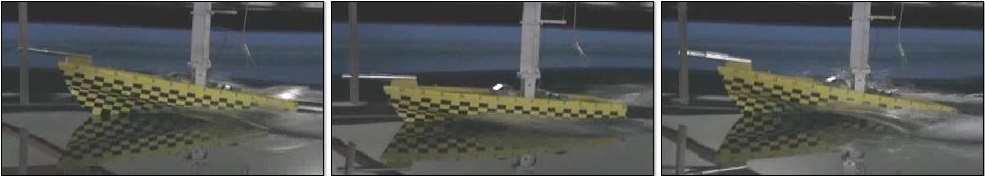
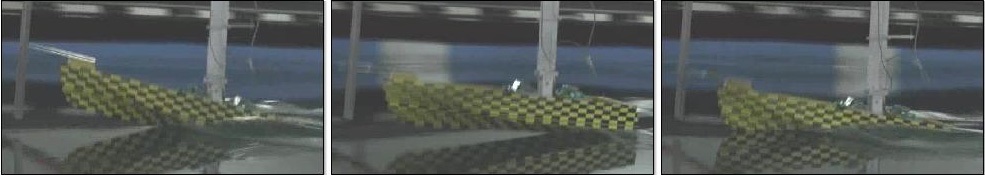
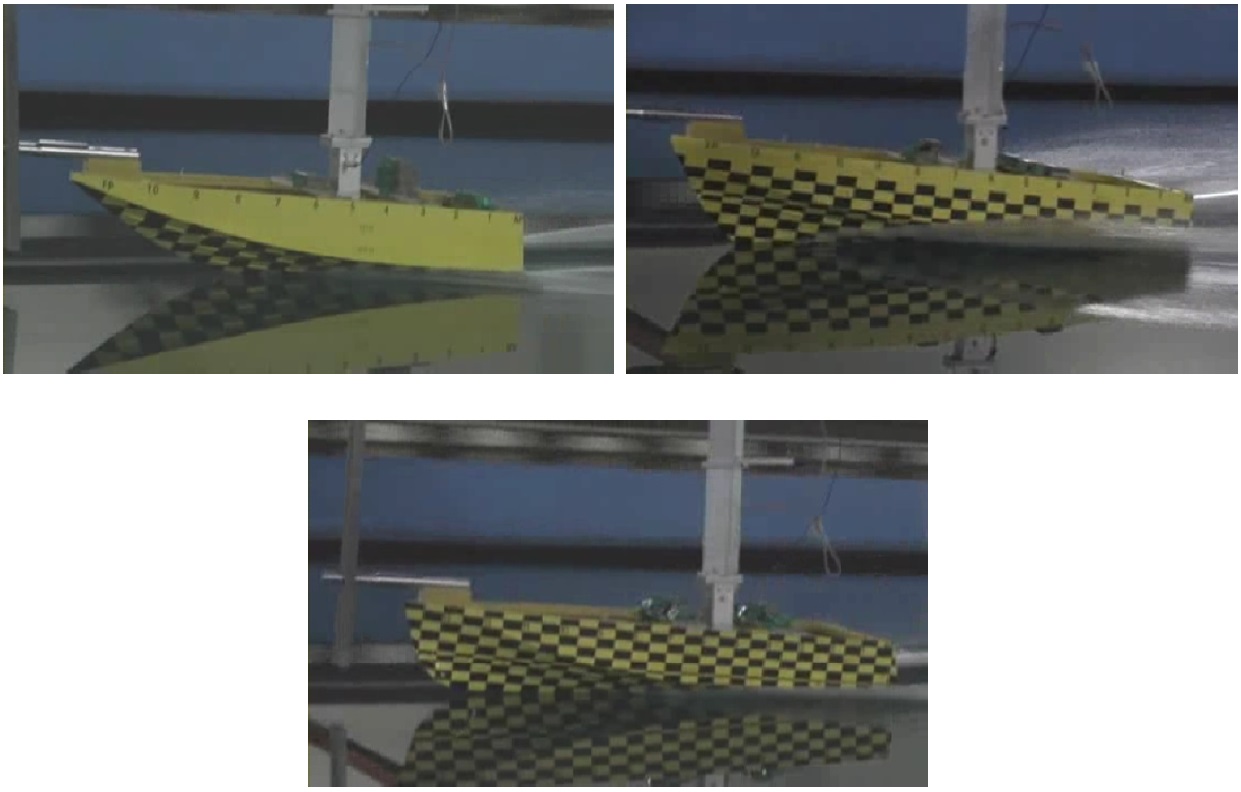
Figs. 14 to 16 show the snapshots of vertical motions of each model ship at resonant frequency in regular waves. Photographs are taken at the time interval of 0.33
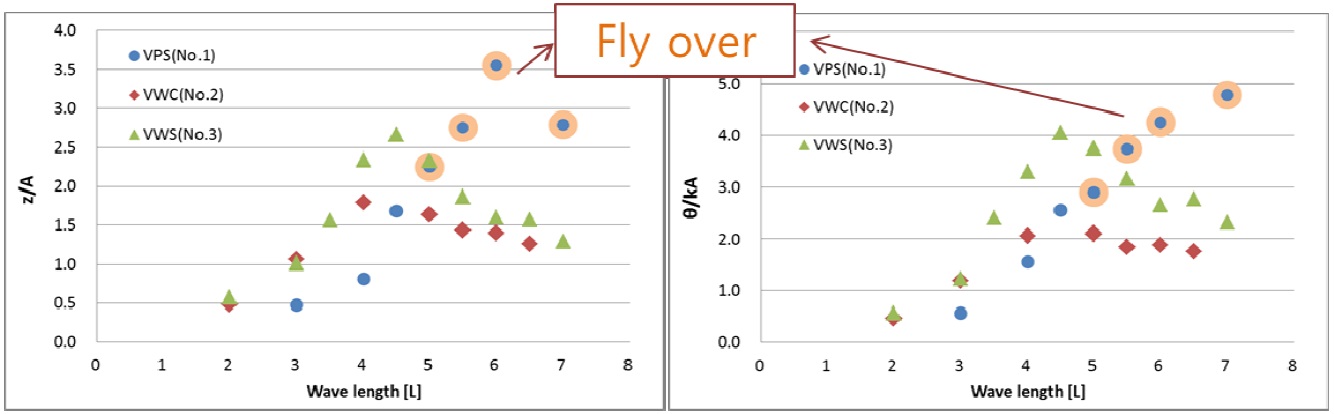
VPS model shows the ‘fly over’ phenomenon around its resonant frequency in regular waves. The bow of VWC model does not come out of the water, and its motion amplitude is relatively small. The bow of VWS model comes out of the water around its resonant frequency, but does not fly over. Maximum heave and pitch motion amplitudes of VWS model are smaller than those of VPS model, and are larger than those of VWC model.
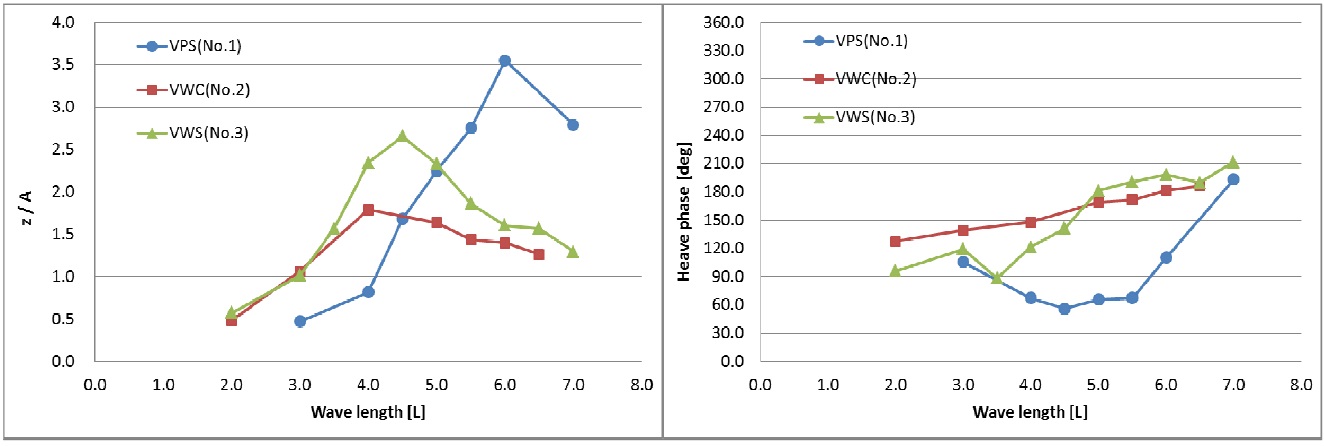
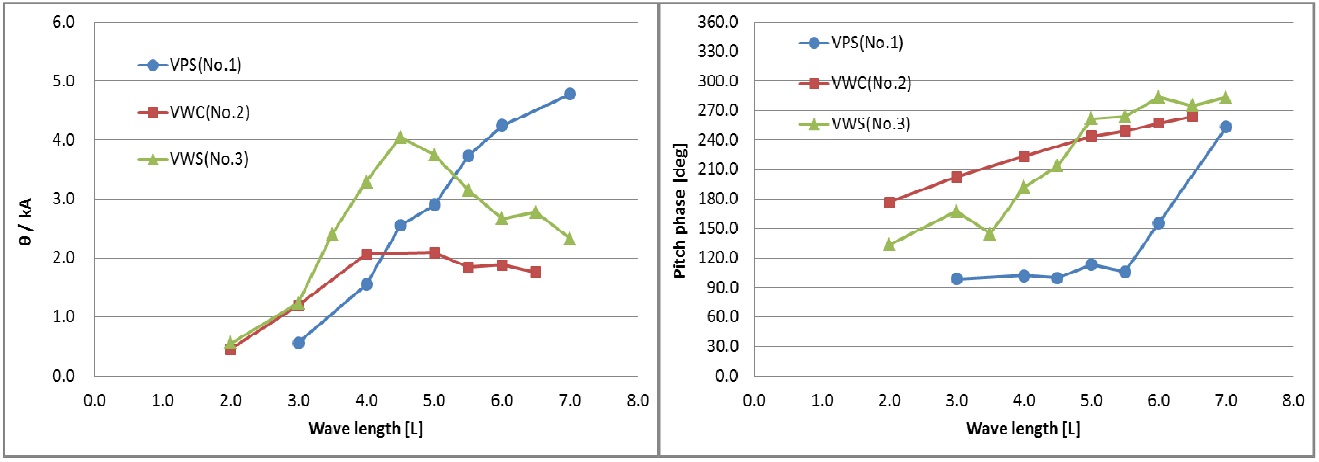
Figs. 17 and 18 show the heave and pitch transfer functions and phases of three model ships. Heave and pitch motion amplitudes are non-dimensionalized by wave amplitudes and wave slopes, respectively. The unit of phase is degree, positive phase means ‘phase lead’.
Heave transfer functions of VPS, VWC and VWS models at resonant frequencies are respectively 3.5, 1.8 and 2.6. And their pitch transfer functions at resonant frequencies are 5.0, 2.1 and 4.0. The heave and pitch phase of VPS model is about 90
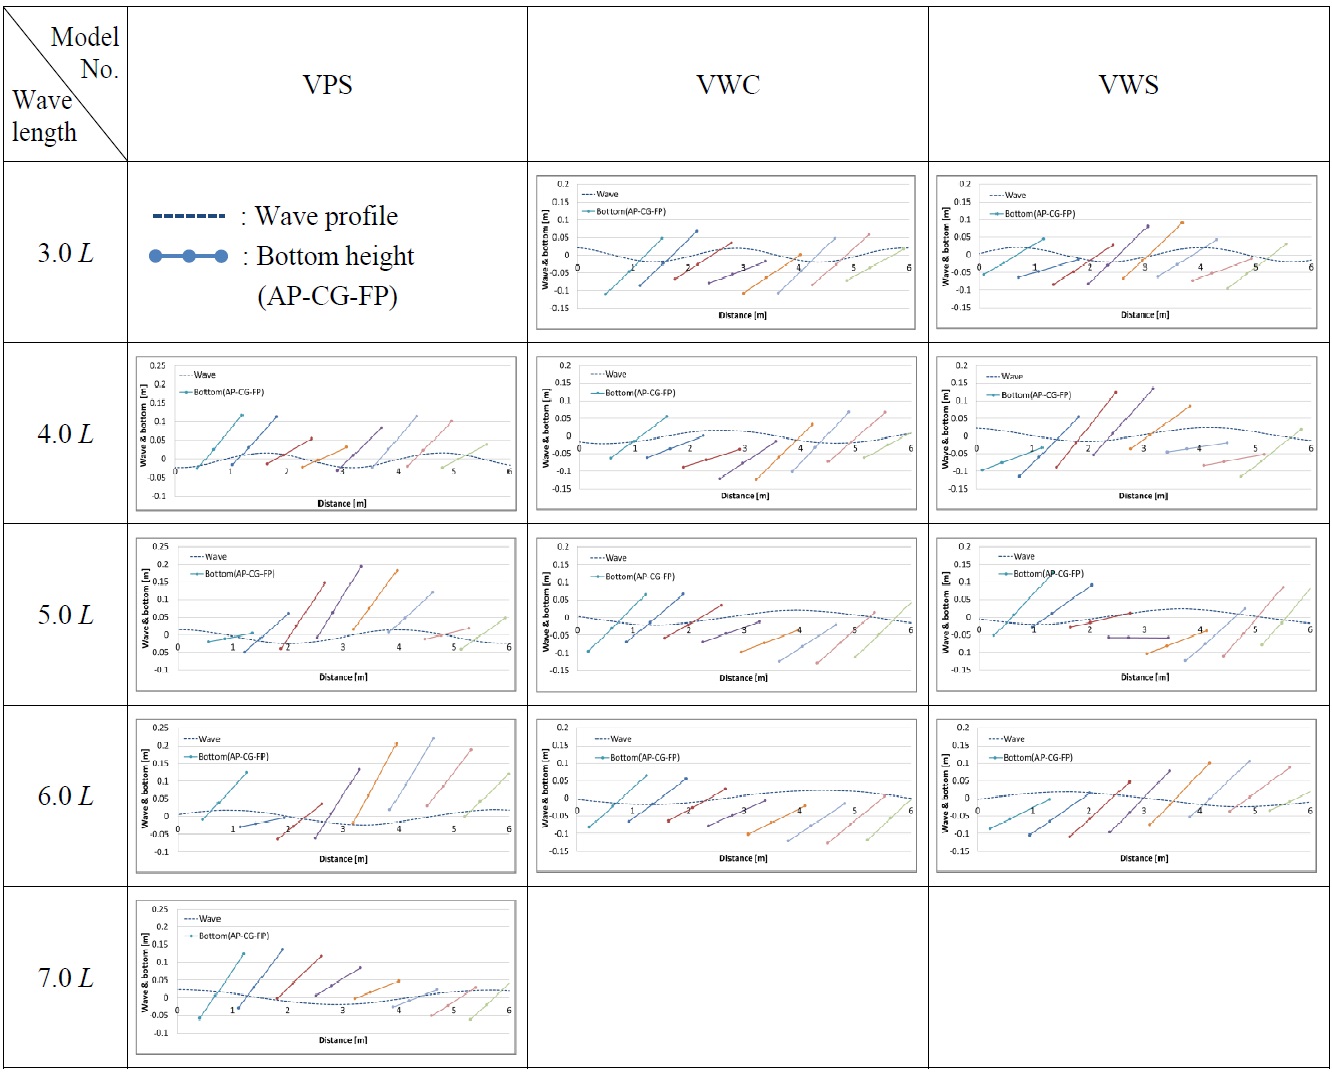
Fridsma (1969), Martin (1976) measured a phenomenon that planing hulls come out of the wave elevation completely in model tests, and they called that phenomenon ‘fly over’. ‘Fly over’ occurs in present model tests for VPS model at Froude number 1.44. Fig. 19 shows the positions of baseline at A.P., C.G. (center of gravity), and F.P. The model ship is turned out to ‘fly over’ when all three positions come out of the water.
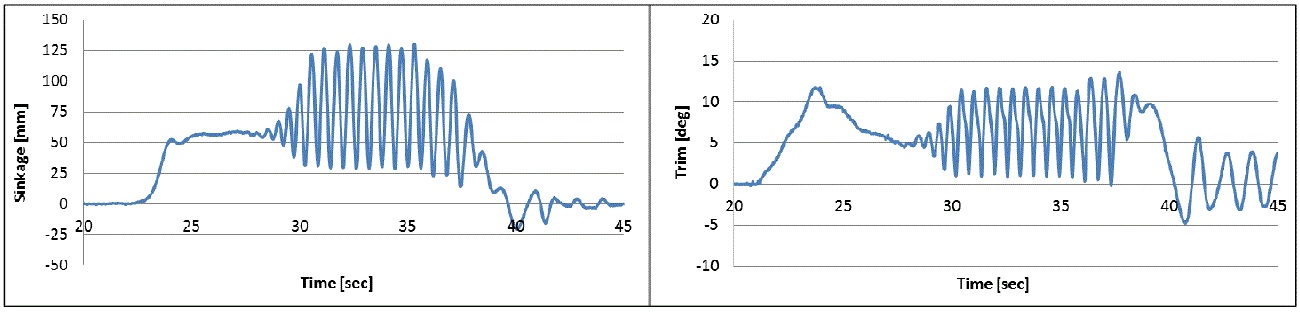
Time histories of heave, pitch motions and wave elevations are obtained by model tests. Wave elevations and baseline positions at A.P., C.G. and A.P. are re-plotted at the time interval of 0.1
For VPS model, there are ‘fly over’ phenomena when the wave length is 5.0
[Table 3] Wave profiles and bottom height at A.P., C.G. and F.P.

Wave profiles and bottom height at A.P., C.G. and F.P.
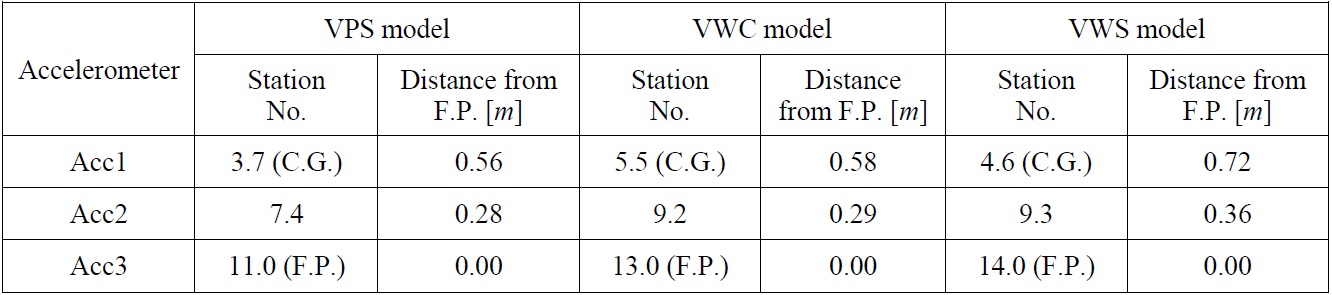
Vertical accelerations are measured at the resonant frequency of each model ship. Test conditions for measuring vertical accelerations are shown in Table 4. Vertical accelerations of VWC model are measured when the wave amplitude is 0.01, 0.02, and 0.03

Test conditions for measuring vertical accelerations at resonant frequencies of model ships.
[Table 5] Locations of accelerometers.

Locations of accelerometers.
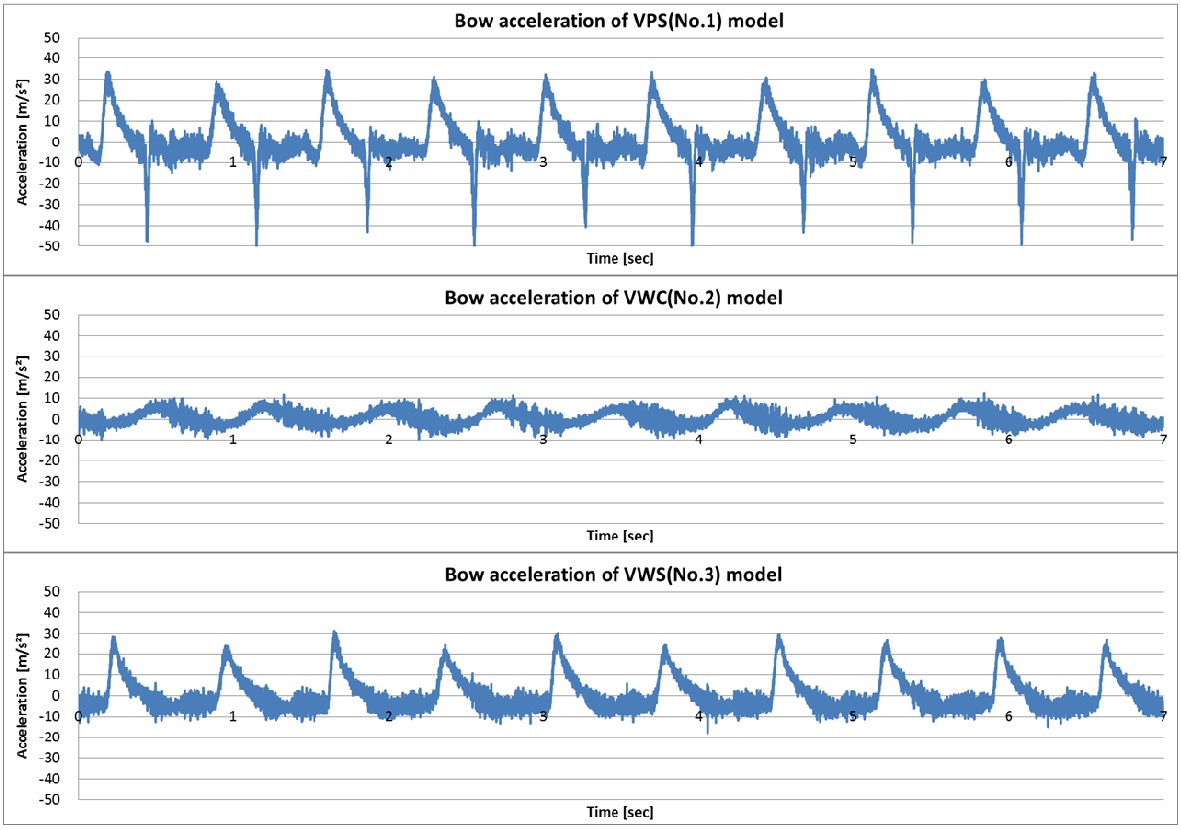
Fig. 21 shows the time histories of vertical accelerations at F.P. of the three model ships. Accelerations are positive upward. VPS model has the largest vertical acceleration. VPS model repeatedly comes out of water and free falls. Bow-down moments are generated when the bottom of A.P. of VPS model touches the free surface, so there are negative peak accelerations, as well as positive peaks due to bow slamming. Vertical accelerations of VWC model are relatively small and there are no clear peak values, since the bow of VWC model does not come out of the free surface. Some parts of the bow of VWS model come out of the water, so there are instantaneous positive peaks like VPS model, but the peak accelerations of VWS model are smaller than those of VPS model, and are larger than those of VWC model.
Peak accelerations of each model ship are shown in Table 6. Vertical accelerations due only to heave motions are measured at C.G. accelerations become larger, as it is closer to the bow, because vertical accelerations due to pitch motions are added. Taken in the same location, VPS model has the largest vertical accelerations, and VWC model has the smallest vertical accelerations.
The vertical accelerations of VWC model according to wave amplitude are shown in Table 7. Vertical accelerations increase proportionally to the wave amplitude.
[Table 6] Maximum vertical acceleration of VPS, VWC and VWS models.
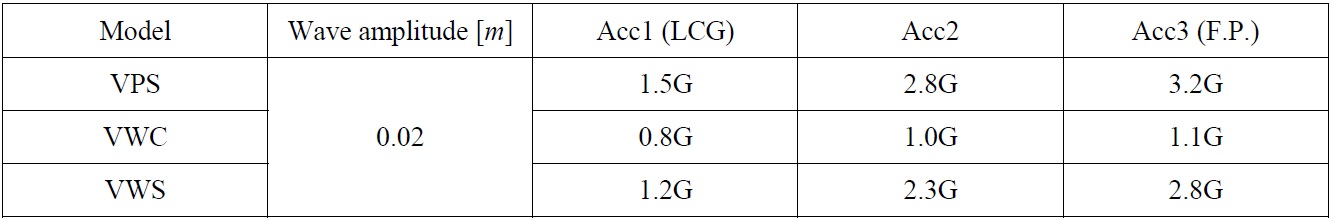
Maximum vertical acceleration of VPS, VWC and VWS models.
[Table 7] Maximum vertical acceleration of VWC model according to wave amplitude.
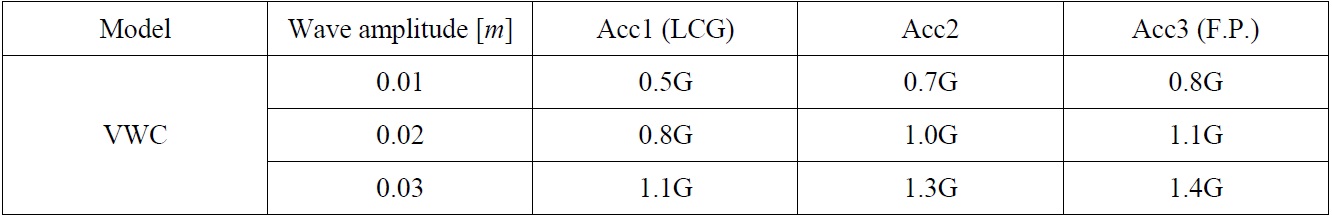
Maximum vertical acceleration of VWC model according to wave amplitude.
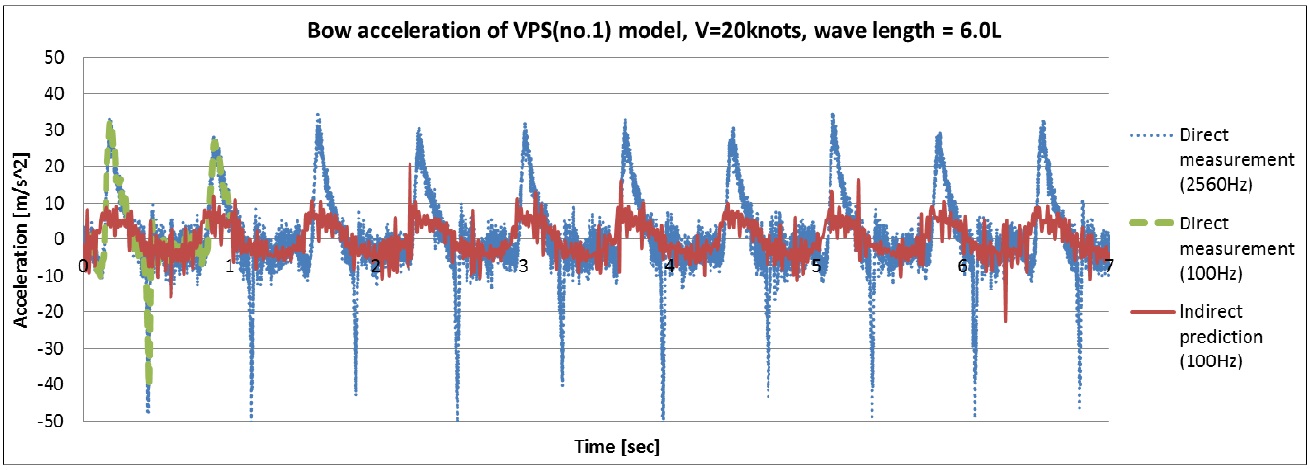
Vertical accelerations can be also obtained by differentiating measured heave and pitch displacements with respect to time. Fig. 22 shows one example of the comparisons of vertical accelerations measured directly by accelerometers, with vertical accelerations obtained by differentiating vertical displacements indirectly. The thin dotted line is the vertical accelerations at F.P. of VPS model, measured by accelerometers on a frequency of 2,560
The purpose of this study is to design a high-speed planing hull which has good resistance and seakeeping performance. Three high-speed planing hulls that have almost same displacement are designed, their hydrodynamic performance are predicted and compared with each other through the high-speed model tests.
Effects of design parameters such as deadrise angle, cross-section shape, length-to-beam ratio, forefoot contour, etc. on the hydrodynamic performance of the hull are experimentally investigated. Small deadrise angles make the hull rise up higher, and those have a significant influence on the resistance decrease. But small deadrise angles lead to the large vertical motion of the hull in waves. When the keel line begins curving up toward the bow near the F.P., in other words, deadrise angles at the bow are large, the hull shows small vertical motion amplitudes in waves. And seakeeping performance of the hull is improved with large length-to-beam ratio. Extended stern bottom is advantageous to the resistance reduction, but in some cases, the stern appendages such as trim tabs may be required to prevent unstable phenomenon.
VPS (no.1) model that shows the smallest resistance at high speed (above 30
When the planing hull is designed in order that the bow bottom hardly comes out of water, its vertical motion amplitudes becomes small in waves. And there is little possibility of ‘fly over’ phenomenon. Therefore, if the real ship often operates in rough water, the hull should be designed in order that the bow comes out of the waves as little as possible.
In this study, VWS model has favorable resistance and seakeeping performance among the three model ships. Its hull form will be optimized to improve its hydrodynamic performance in the near future. And, stern appendages may be effective for reducing its required power. For good seakeeping performance, the bow shape is to be designed as a wave-piercing type.