For several decades, Asian nations such as Korea, Japan and China have been leading the shipbuilding industry since the decline in Europe and America. However, several developing countries such as India, Brazil, etc. are going to make an entrance into the shipbuilding industry. These developing countries are finding technical partners or information providers because they are in situation of little experiences and technologies. Now, the shipbuilding engineering companies of shipbuilding advanced countries are getting a chance of engineering business against those developing countries. The starting point of this business model is green field project for the construction of new shipyard. This business model is started with a design of the shipyard layout. For the conducting of the shipyard layout design, four kinds of engineering parts are required. Those are civil engineering, building engineering, utility engineering and production layout engineering. Among these parts, production layout engineering is most important because its result is the foundation of the other engineering parts and it determines the shipyard capacity during the shipyard operation lifecycle. Previous researches about the shipyard layout design are out of the range from the business requirements because most research cases are in the tower of ivory, which means that there are little consideration of real ship and shipbuilding operation. In this paper, a shipyard layout design for preliminary phase is conducted for the target of newly planned shipyard at Venezuela of South America with an integrated method that is capable of dealing with actual master data from the shipyard. The layout design method of this paper is differentiated from the previous researches in that the actual product data from the target ship and the actual shipbuilding operation data are used for the required area estimation.
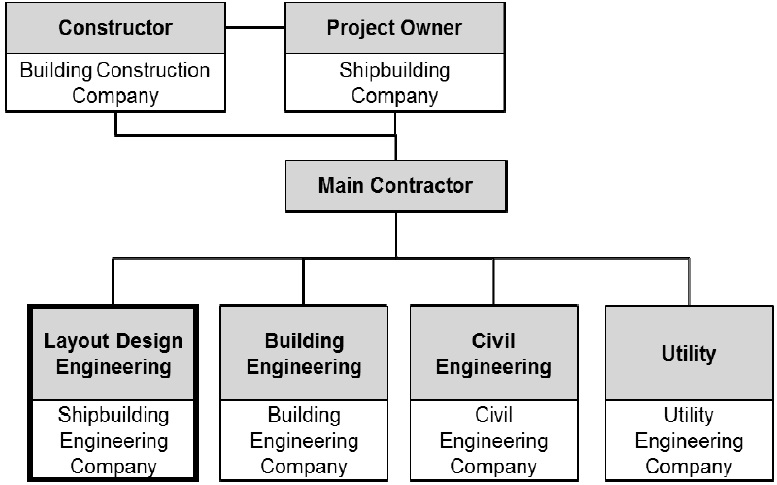
Shipbuilding business starts with a shipyard construction with a large scale investment initially. The starting point of shipyard construction is to design a shipyard layout. For this purpose, four kinds of engineering parts required. Those are civil, building, utility and production layout engineering. The business organization of shipyard green-field project (Greenfield project is one which is not constrained by prior work. It is constructing on unused) is shown in Fig. 1. Among these, production layout engineering is most important because its result is going to be foundation of the other engineering parts and determine the shipyard capacity in the shipyard lifecycle.
Production capacity of shipyard is, in most case, defined by the resource secured, the yard area, and especially the proximity degree of each factories and work stages. The problem is that most resources and factories are hard to be changed from the initially installed and built status even though the need for the increase of the production capacity is taken place. Therefore, initial layout design of the shipyard has to be conducted with a reasonable input data and a logical methodology.
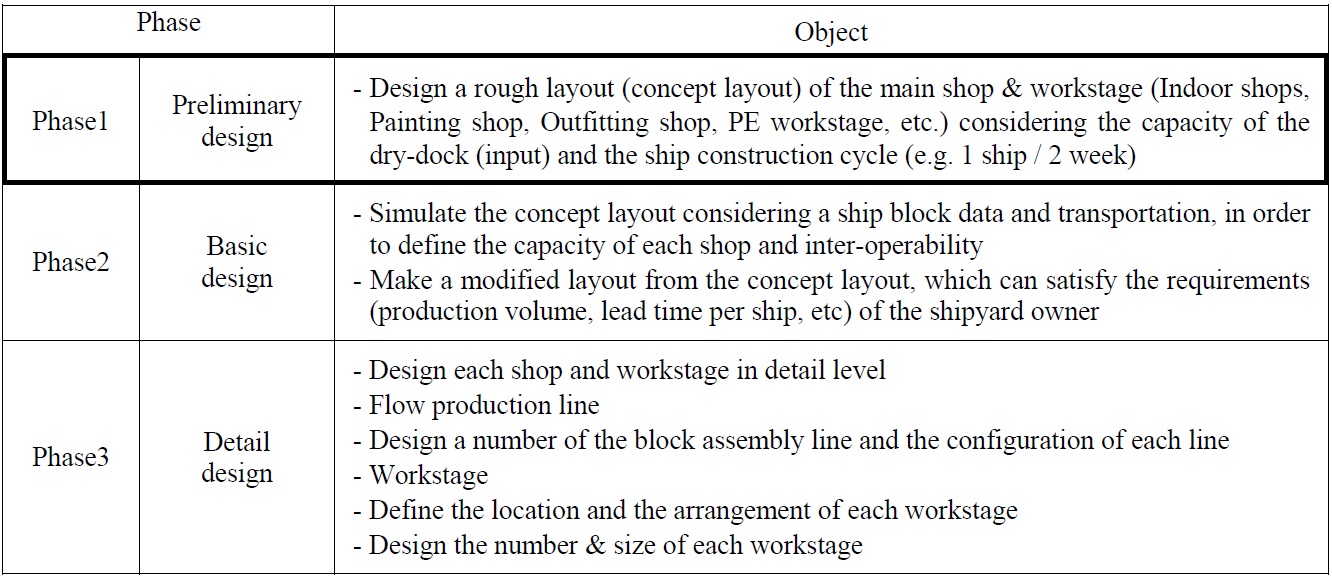
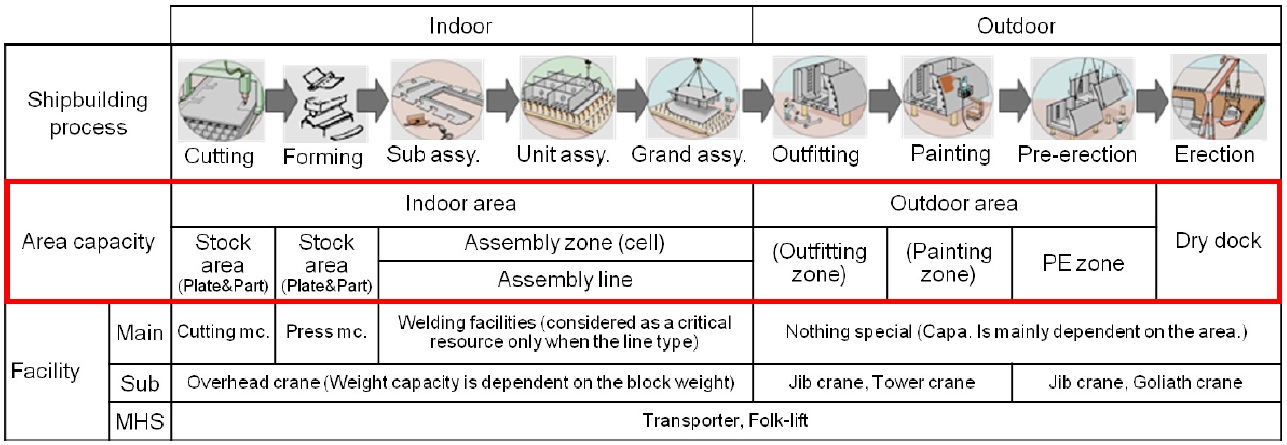
The design phases of the shipyard layout design are shown in Table 1. As shown here, shipyard layout design phases are divided as a preliminary design, basic design and detail design. This division is similar with that of the ship design process. The target phase of this paper is the preliminary design, which determine a rough layout of the main shops & work stages (Indoor shops, Painting shop, Outfitting shop, Pre-Erection (PE) workstage, etc.) considering the capacity of the dry-dock and the ship construction cycle. The scope of this phase is indicated with the shipbuilding process in Fig. 2.
In this paper, an integrated shipyard layout design methodology is developed based on the actual product data of planned ship and the actual shipbuilding operation data for the preliminary shipyard layout design phase. Also, case study is conducted for the newly planned project in Venezuela of South America. The research of this paper is differentiated from the previous researches in that the actual product data from the target ship and the actual shipbuilding operation data are used for the required area estimation. Also, the result through the proposing method has a commercial value that can be directly used as a sales material.
[Table 1] Phases of shipyard layout design.

Phases of shipyard layout design.
The research related to a facility layout and a factory layout has progressed because of the request for maximizing the production efficiency of large-scale automated plants such as General Motors, Daimler, Toyota, and so forth or electric and semiconductor plants such as Samsung, Nokia, and so forth. Chabane (2004) attempted to design of a small shipyard facility layout optimized for production and repair. The emphasis was on the application of a methodology of layout design based on the procedure outlined by Muther (1973), which reveals a perfectly efficient layout planning method adapted for the early stage of a new project when quantitative data are only broadly defined. The main limitations of these works reside in the various assumptions essentially relating to the productivity targets and the flows of elements that were required to achieve the diverse analyses.
In addition, Iveline and Mareta (2007) introduced the simulated annealing algorithm to design the production facility. They used a “From To” chart and an “Activity Relation-AU2 ship Diagram” for the production design, and the layout could be optimized using simulated annealing. This research proved that company could get the optimal area. A case was proposed for the importance of a module-based workplace building and a distributed layout through a flexible plant layout design (Benjjafar and Sherikhazadeh, 2000).
There came out a systematic shipyard layout design framework with the increase of the new business of shipyard construction since the early part of 2000s. In the past, traditional method was to perform benchmark from the existing shipyard layout. However, try-out or trial and error method was at last worn out.
Song et al. (2009, 2010) have developed shipyard layout design framework and adopted a simulation method for the enhancement of proposing framework in an effort to resolve the existing (or traditional) method This research proposed a framework for the shipyard layout design, which overcame the traditional layout design methodology, and also this framework was embodied as an actual design system with the user interface. The proposing framework is a foundation for the preliminary layout design with the initial condition such as field data, target ship, and target throughput. Also, the layout and the capacity validation of the block assembly factory was conducted based on the proposed framework (Song et al., 2009).
SHIPYARD PRELIMINARY LAYOUT DESIGN
The preliminary layout design can determine the schematic configuration of the major factories and working stages of shipyard so that the approximate capacity of fabrication shops, painting shop, outfitting shop, PE working stage considering the initial capacity of dry dock and the ship construction duration. General scope of the preliminary layout design is to estimate a size of main shops and workstages including location optimization with the consideration of flow, relation and cost. Additionally, a detail workstage planning could be conducted, where the detail workstage planning means a unit area allocation inside a given boundary of each shop and workstage. The detail workstage planning is conducted by considering average plate size for the stockyard and the average block area for the assembly and the outdoor workstages. These works are conducted with the major premises as follows.
Average area occupation of blocks of target ships is considered.
Factory/Workstage area is most dominant resource in the shipyard.
Consider dominant production flow excluding office, carpenter shop, galvanizing shop, oxygen/gas storage, etc.
>
Input and output of shipyard preliminary layout design
Preliminary layout design require basic input data such as a given geometry of land, the block geometry of the target ships, a target production volume and a production capacity of a planning shipyard. The given geometry of land is used as a boundary condition when each shop and each workstage is located along with a layout design process. The block geometry of the target ships are required for the area calculation, where the orthogonal area of each block is summed and averaged. The target production volume and the production capacity of a planning shipyard are also used for the area calculation together with the block area coming from the block geometry. The required area and number of the shop and the workstage is proportional with the block area and the production volume. On the other hand, the required area is in inverse proportion to the production capacity, where the production capacity has hour or day unit.
The output of the shipyard preliminary layout design is a required maximum size of each shop and workstage and its optimized location. Also, the unit work cell (the plate unit for the stock yard, and the block unit for the other block construction area) is allocated inside of each shop and workstage.
Input data
Geometry of land as boundary condition.
Block geometry of target ships - Number of blocks, Dimension of block.
Planned production volume.
Planned production capacity - Block production and steel fabrication.
Output
Required maximum size of each shop and workstage.
Optimized location of each shop and workstage.
Allocation of unit work cell w.r.t. required production capacity.
In this chapter, we are going to describe main procedures and those methodologies that have to be performed in preliminary layout design. Those methodologies are as follows.
Production area based layout design.
Optimization for shop location.
Unit cell (or workstage) arrangement.
Production area calculation
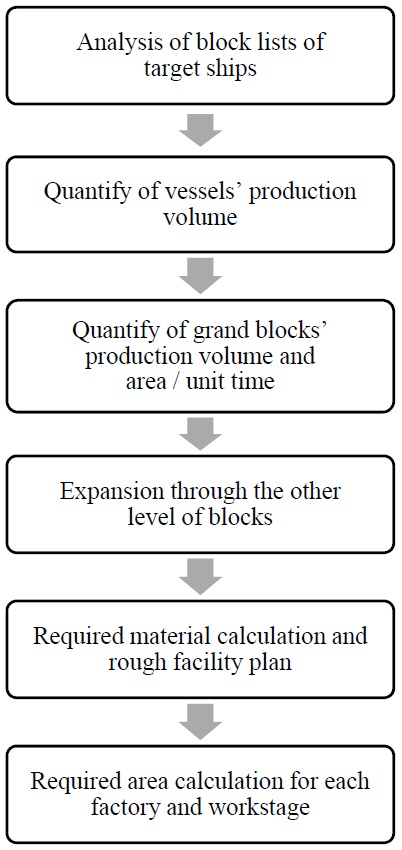
Most shipbuilding company has difficulties in area planning because the roughly estimated plan area was not adjustable for the actual shipbuilding process. Other production issues such as load evening, production method, etc. could be improved locally with given work conditions. However, less estimated area plan could not be resolved. And, the insufficient production capacity by area shortage has to be covered by the outsourcing the block construction to the cooperative firm or the subcontractor. So, the reasonable area calculation with the measurable input data and the systematic method is the most critical point of preliminary layout design. So, the first procedure is to estimate the production area based on the target ship information and planned production volume. The basic principle of this procedure is to calculate required total area of each production process. Fig. 3 shows a detail process for estimating required area calculation.
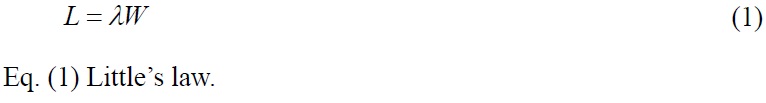
Fundamentally, the calculation of area for the blocks is based on Little's law. Little’s law says that the long-term average number of customers in a stable system L is equal to the long-term average effective arrival rate, λ, multiplied by the average time a customer spends in the system, W. This is expressed algebraically as shown in Eq. (1). This theorem can be applied to the area calculation of shipbuilding workstage. Little’s law is the relation between the time (W) and the number (L). Time corresponds with the block staying period at the work stage and the number corresponds with the required holding capacity of workstage. Also, arrival rate is the required production capacity per unit time. All the calculation of area for the blocks is following Eq. (1) .
Optimization for production unit location
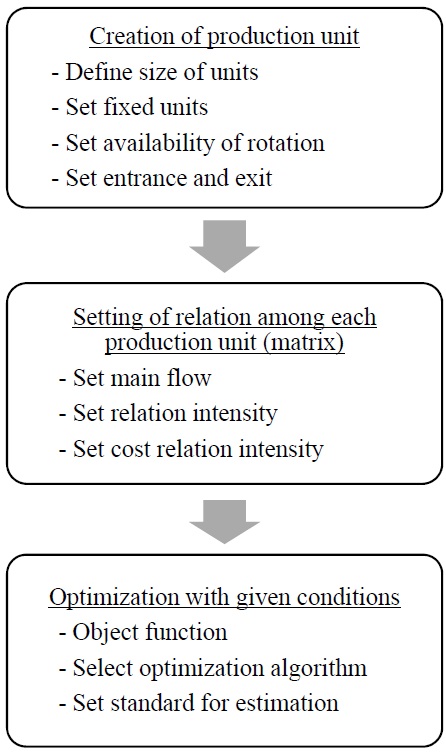
The next step of shipyard layout design after estimating work stage area is to locate each shop or factory with optimization, where shop or factory is dealt as the meaning of production unit. It is possible to mutual relation among each production unit though there is not detail information of facilities or work plan. Fig. 4 shows a detail process for optimizing a production units’ location. This process is repeated until the reasonable and acceptable results are obtained by varying matrix setting, optimization algorithm, etc.
Layout optimization requires minimization of an objective function usually referred to as a cost function. Cost function is formed as a matrix multiplication of a flow matrix and a unit cost matrix. The flow matrix gives the flow of material, equipment or personnel between all pairs of modules. An element of flow matrix, denoted by

In this paper, the commercial software (VIP Planopt, http://www.planopt.com) is used for the calculation of above optimazation problem. The reason why the commercial software is being adopted is that any trials for the optimization of the shipyard layout with the area information are failed. Differential evolution algorithm (Choi, 2003), genetic algorithm and heuristic algorithm cannot consider the required condition for the shipyard layout design such as an anchored module (forbidden area), module padding and no-flow module. VIP Planopt is using its own hybrid heuristic-cum-analytic algorithm with a pseudo exhausted search method.
Unit cell (or workstage) arrangement
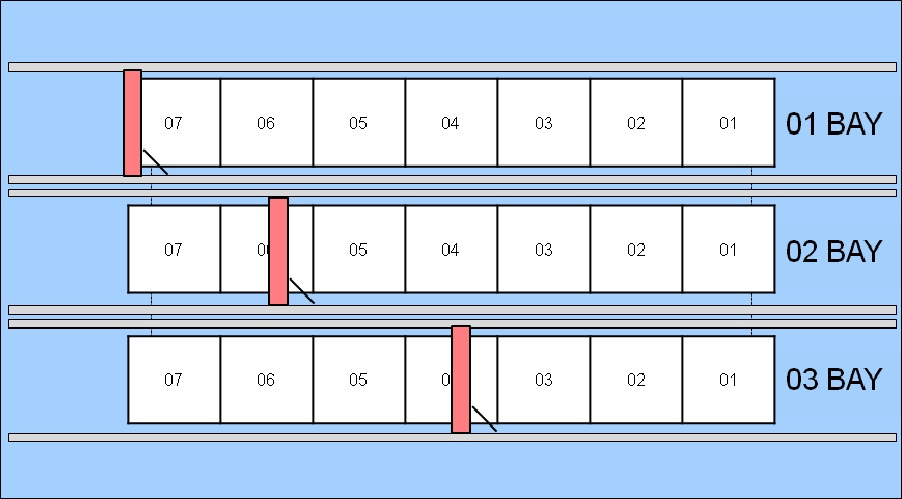
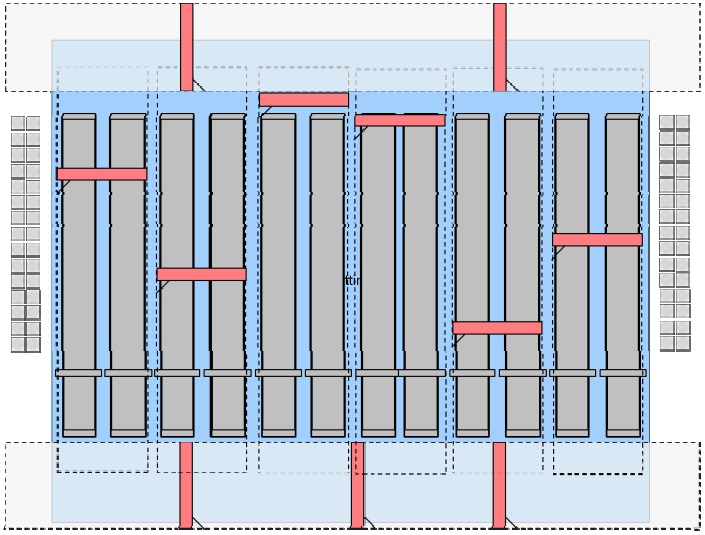
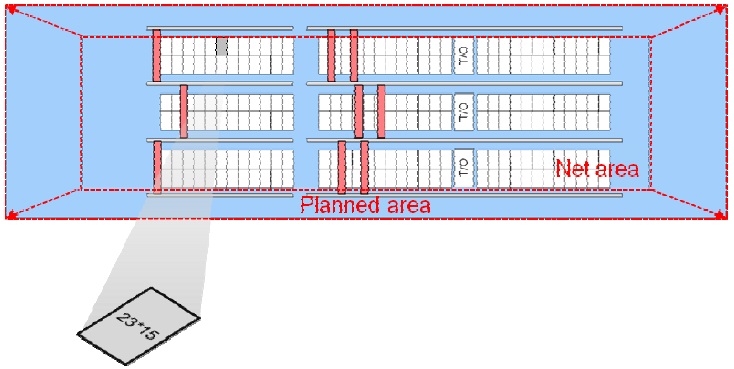
This work is optional for preliminary layout design. The object of this step is to design a detail work area and major equipment such as cutting machine, lifting crane inside a designed production unit. In this step, planned production capacity is considered for the computation of the size and the number of unit work area. Fig. 5 shows an example of a unit cell design for the outfitting production process.
CASE STUDY : SHIPYARD PRELIMINARY LAYOUT DESIGN
In this paper, a case study of shipyard layout design is conducted based on the proposing methods and procedure. The target is a PDVA Shipyard company of Venezuela. PDVSA is originally national owned oil company and they are going to get into the shipbuilding industry in order to make a ship for their own oil company.
Firstly, required data and reasonable assumptions have to be defined such as geometry of land, block data of target ships, planned production capacity, etc.
Input: geometry of land
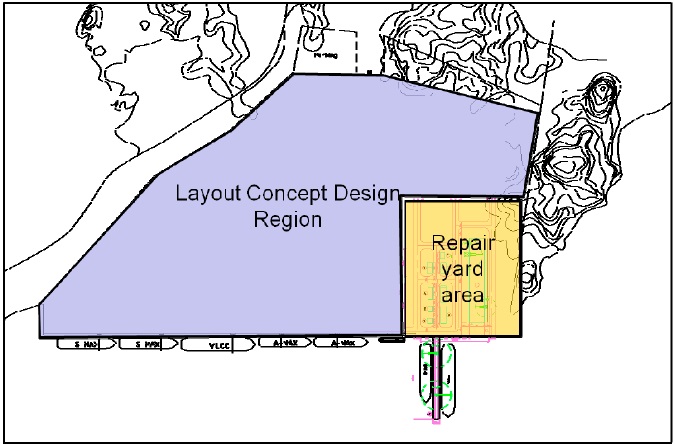
Geometry of land is most fundamental input data for the shipyard layout design. This condition determines size and shape where each production module is located. Also, the number of dry docks and skid birth is defined strategically. In this case study, two dry docks are considered without skid birth. The location of dry dock is determined through the layout design. The geometry of target site is shown in Fig. 6.
Input: dock plan and block geometry of target ships
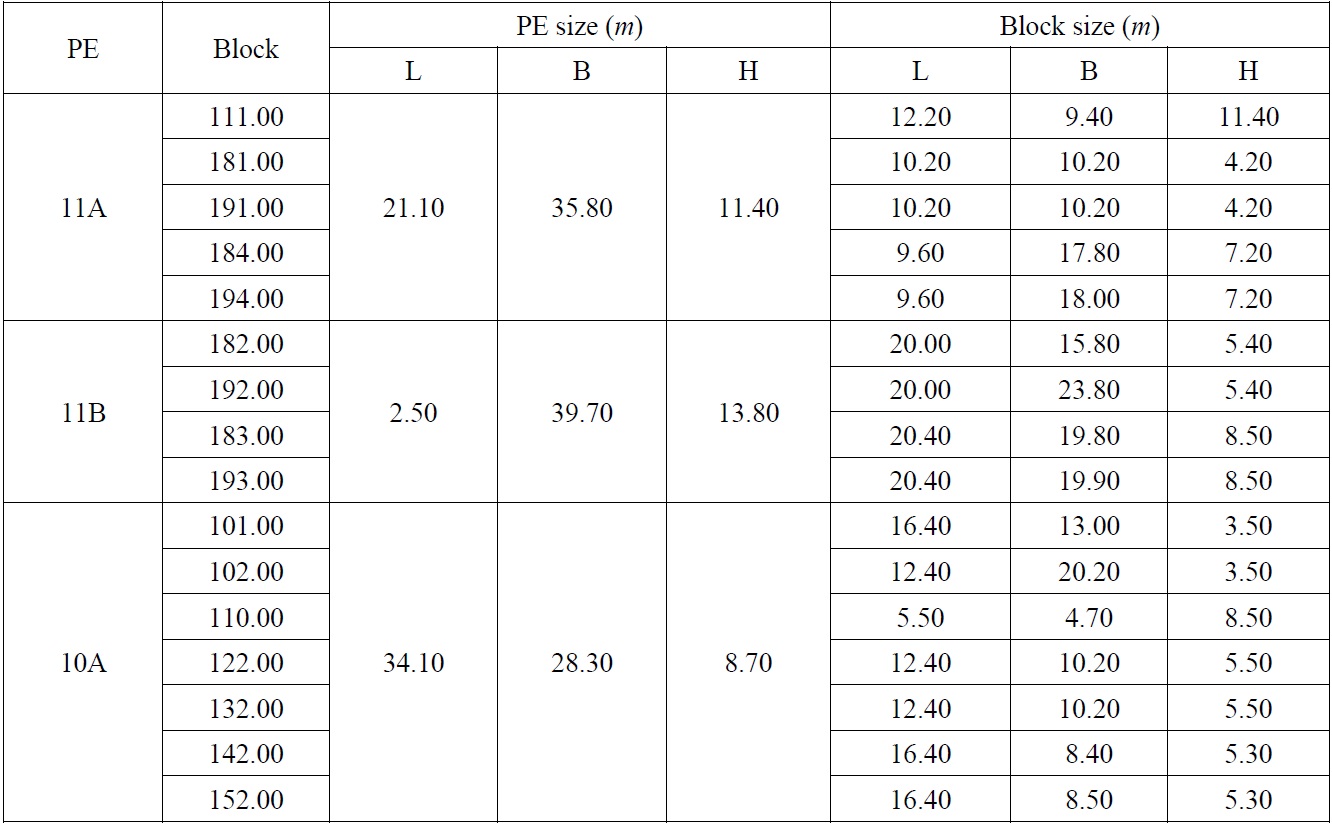
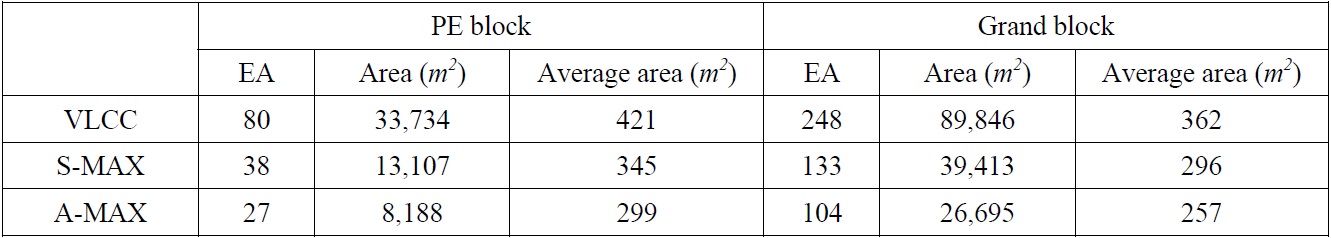
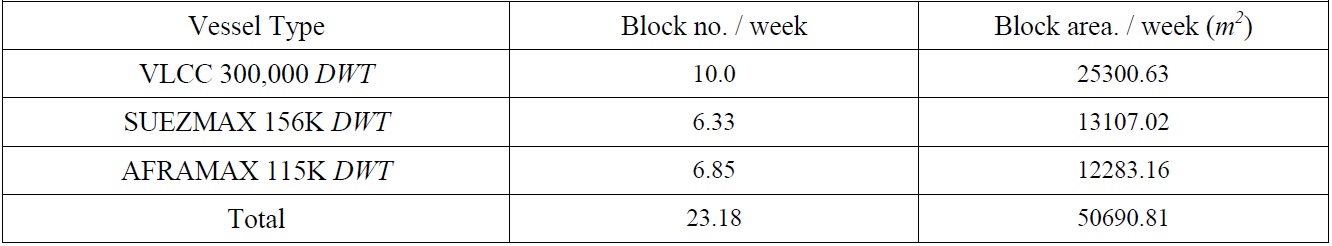
In this paper, the block geometry of planned ship at the target shipyard is used for the calculation of work area. For this, the block geometry of 3 target ships are surveyed and analyzed. Table 2 shows a part of block geometry that is composed of the block number and the bounding box size for PE block and Grand block. Through the analysis, the average occupying area is calculated as shown in Table 3. The area of the other WIP (Work In Process) such as sub assembly block, outfitting block is assumed as shown in Table 4.
[Table 2] Block geometry of target ship (Example of VLCC).

Block geometry of target ship (Example of VLCC).
[Table 3] Block data of target ships.

Block data of target ships.
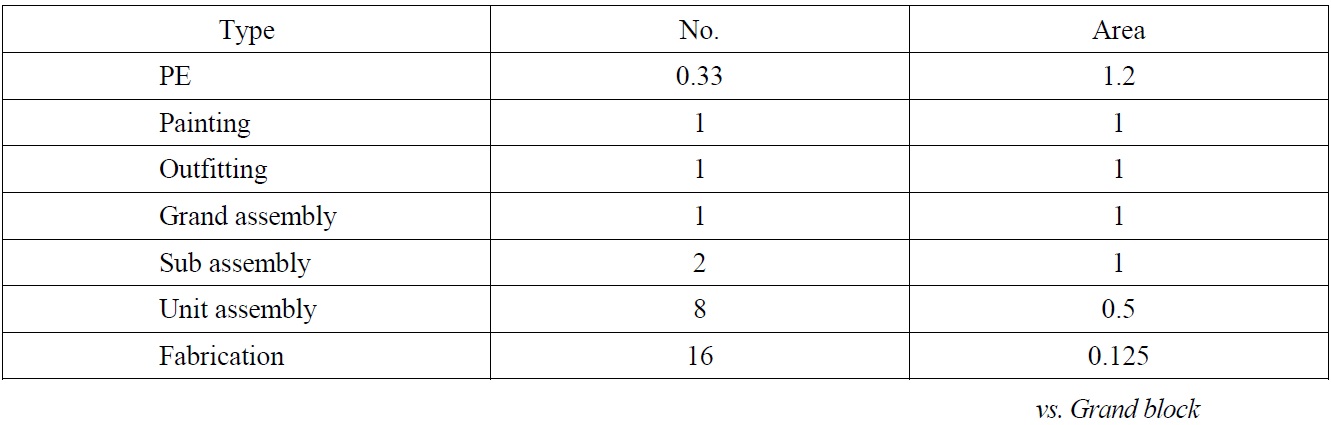
Number and occupying area ratio of block and large part on the base of grand assembly block.
Input: planned production volume
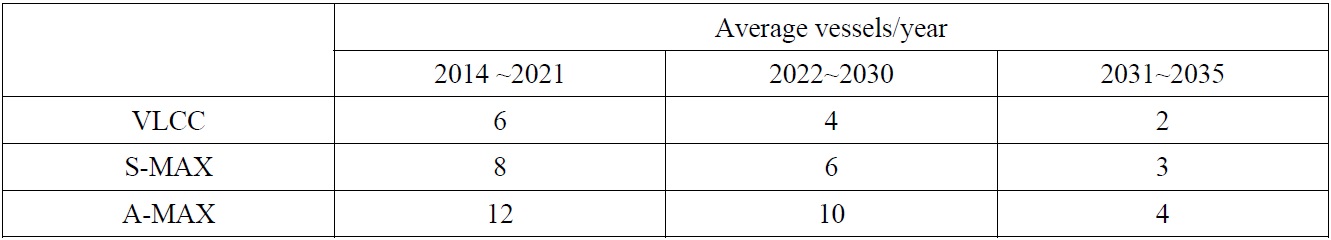
First input parameter regarding production quantity is target planning of object ships during maximum production period. In this case study, maximum production period is estimated from 2014 to 2021 as shown in Table 5. Each number of target ships per year is rounded up for the worst case, where the worst case means that the peak level of the shipyard production capacity.
[Table 5] Planned target ship volume.

Planned target ship volume.
Input: planned production capacity
Most sensitive input data is production capacity because the required work area is proportional with the production capacity. Production capacity is estimated for each block process. In case of this study, the production capacity is very low comparing with domestic shipbuilding companies. In this paper, the production capacity is assumed as 1/4~1/6 of domestic shipbuilding companies. Required time for the grand block assembly is assumed as 4 weeks. And, the other required time is planned based on the grand block assembly as shown in Table 6.
[Table 6] Production capacity.
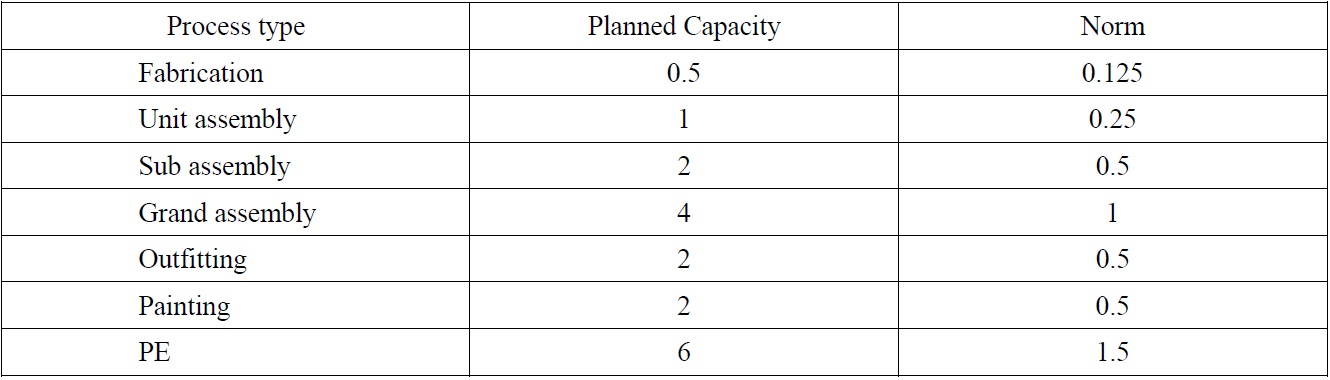
Production capacity.
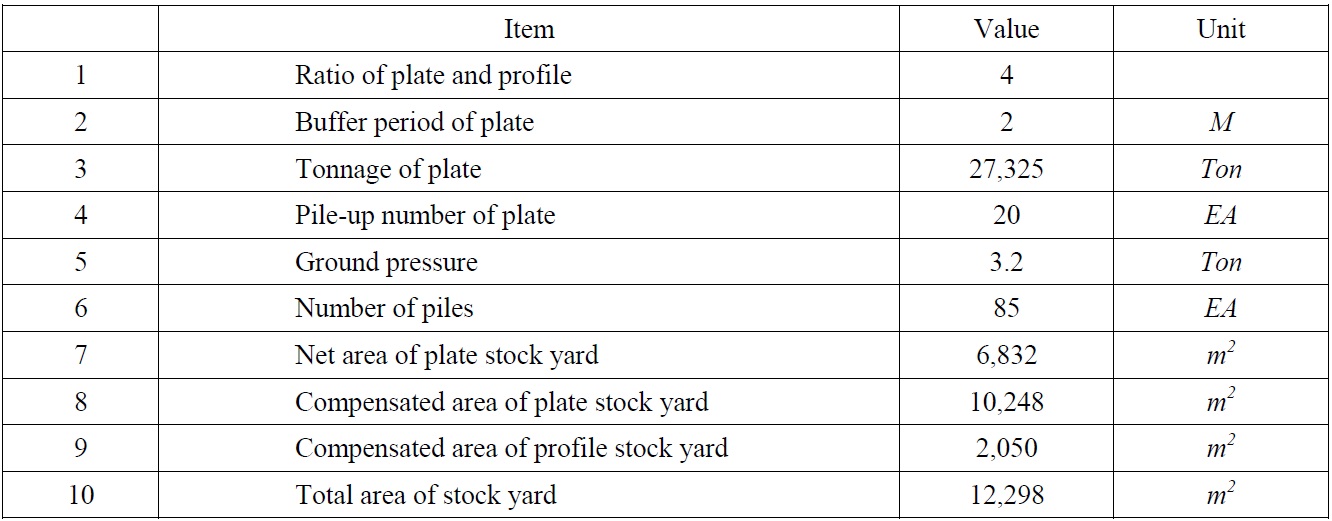
Area calculation of stock yard for plate and profile
The stock yard area is calculated considering required plate and profile volume, where the ground pressure that the stock area could stand has to be considered. In this paper, the limit of ground pressure is assumed as 3.5
[Table 7] Calculation process and result of stock yard for plate and profile.

Calculation process and result of stock yard for plate and profile.
[Table 8] Calculation of cutting and pretreatment shop area.
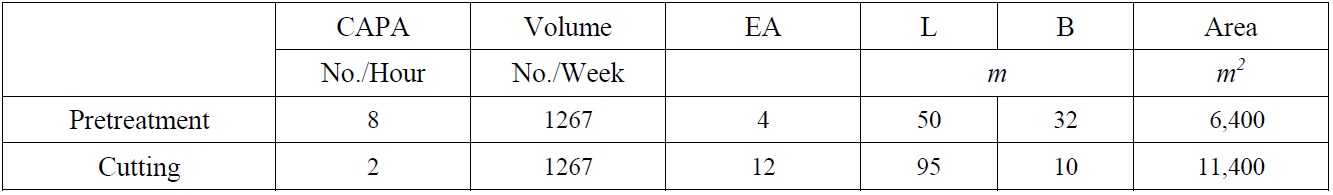
Calculation of cutting and pretreatment shop area.
Area calculation of cutting and pretreatment shop
Cutting lead time per plate is about 1
Area calculation of block workstage
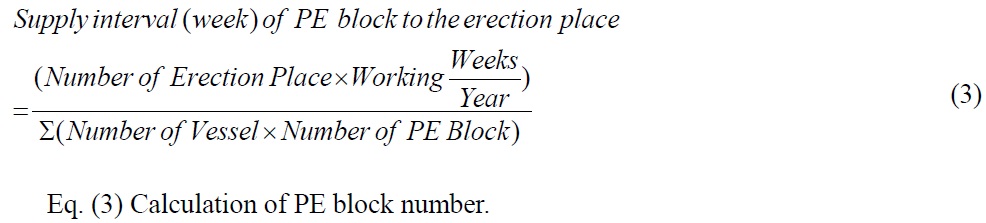
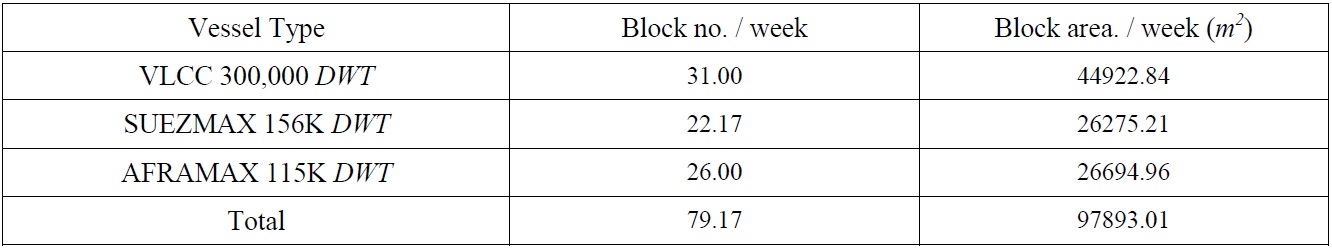
Block workstage is where the any kinds of block is produced (assembly) or treated (painting, outfitting, etc.). Firstly, the supply interval (time) of PE block to the erection place should be calculated considering the PE block number of each planned ship and dock plan. The calculation formula is shown in Eq. (3). In this case study, the supply interval (time) of PE block to the erection place is 0.25. This means that one PE block have to be supplied to dry dock every 0.25 weeks.
Next, as mentioned at 2.3, the area for the block workstage is calculated using little’s law. The grand block assembly area and PE block assembly area is calculated directly with Table 3 and Table 5. The calculation results are shown in Table 9 for the PE workstage and Table 10 for the grand block assembly workstage respectively. The areas of painting, outfitting, sub assembly, unit assembly and fabrication are calculated by application of little’s law with the calculated time and numbers of the blocks, which is a same procedure with the calculation of the grand block assembly area.
[Table 9] PE block assembly area calculation.

PE block assembly area calculation.
[Table 10] Grand block assembly area calculation.
Grand block assembly area calculation.
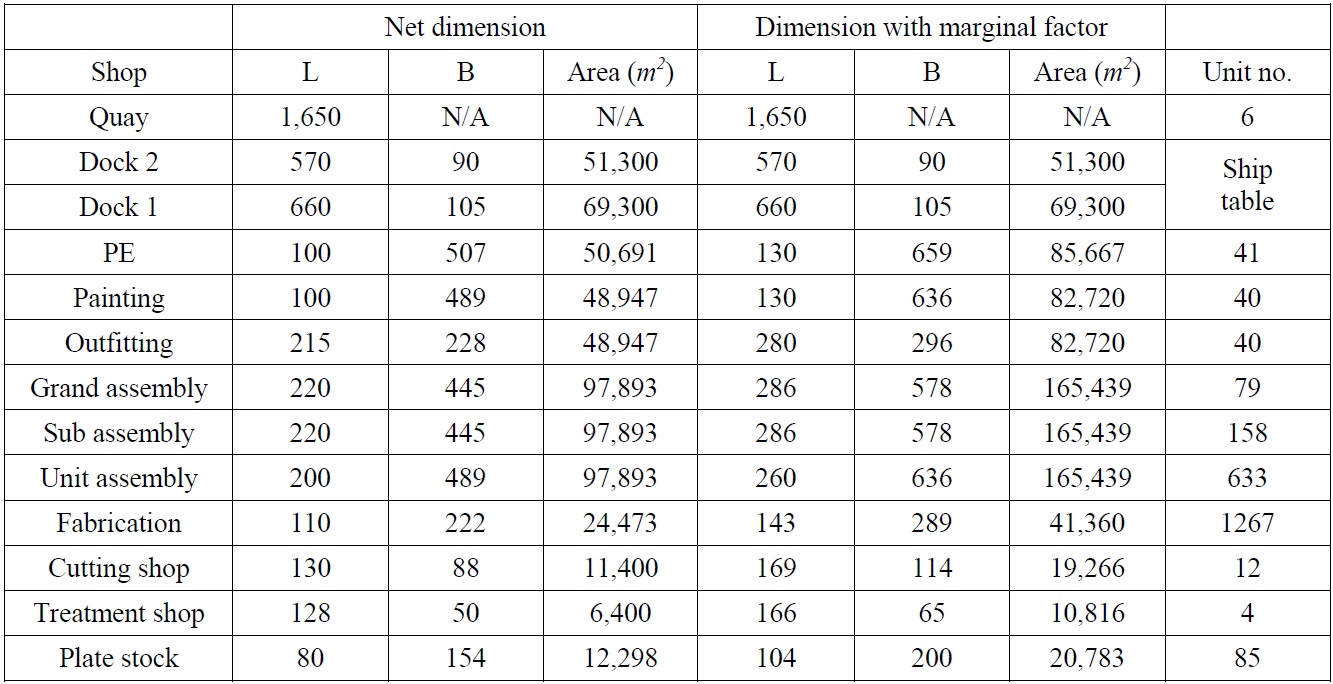
Table 11 is a summary of all the work stages with appropriate marginal factor in length, which is 1.3. This value is for the consideration of the additional required area such as road, utility, etc. The unit number is required for the design of the small division of each work stage. These numbers are calculated reversely by dividing a final calculated area by the average size of the plate of the block.
[Table 11] Area calculation summary.

Area calculation summary.
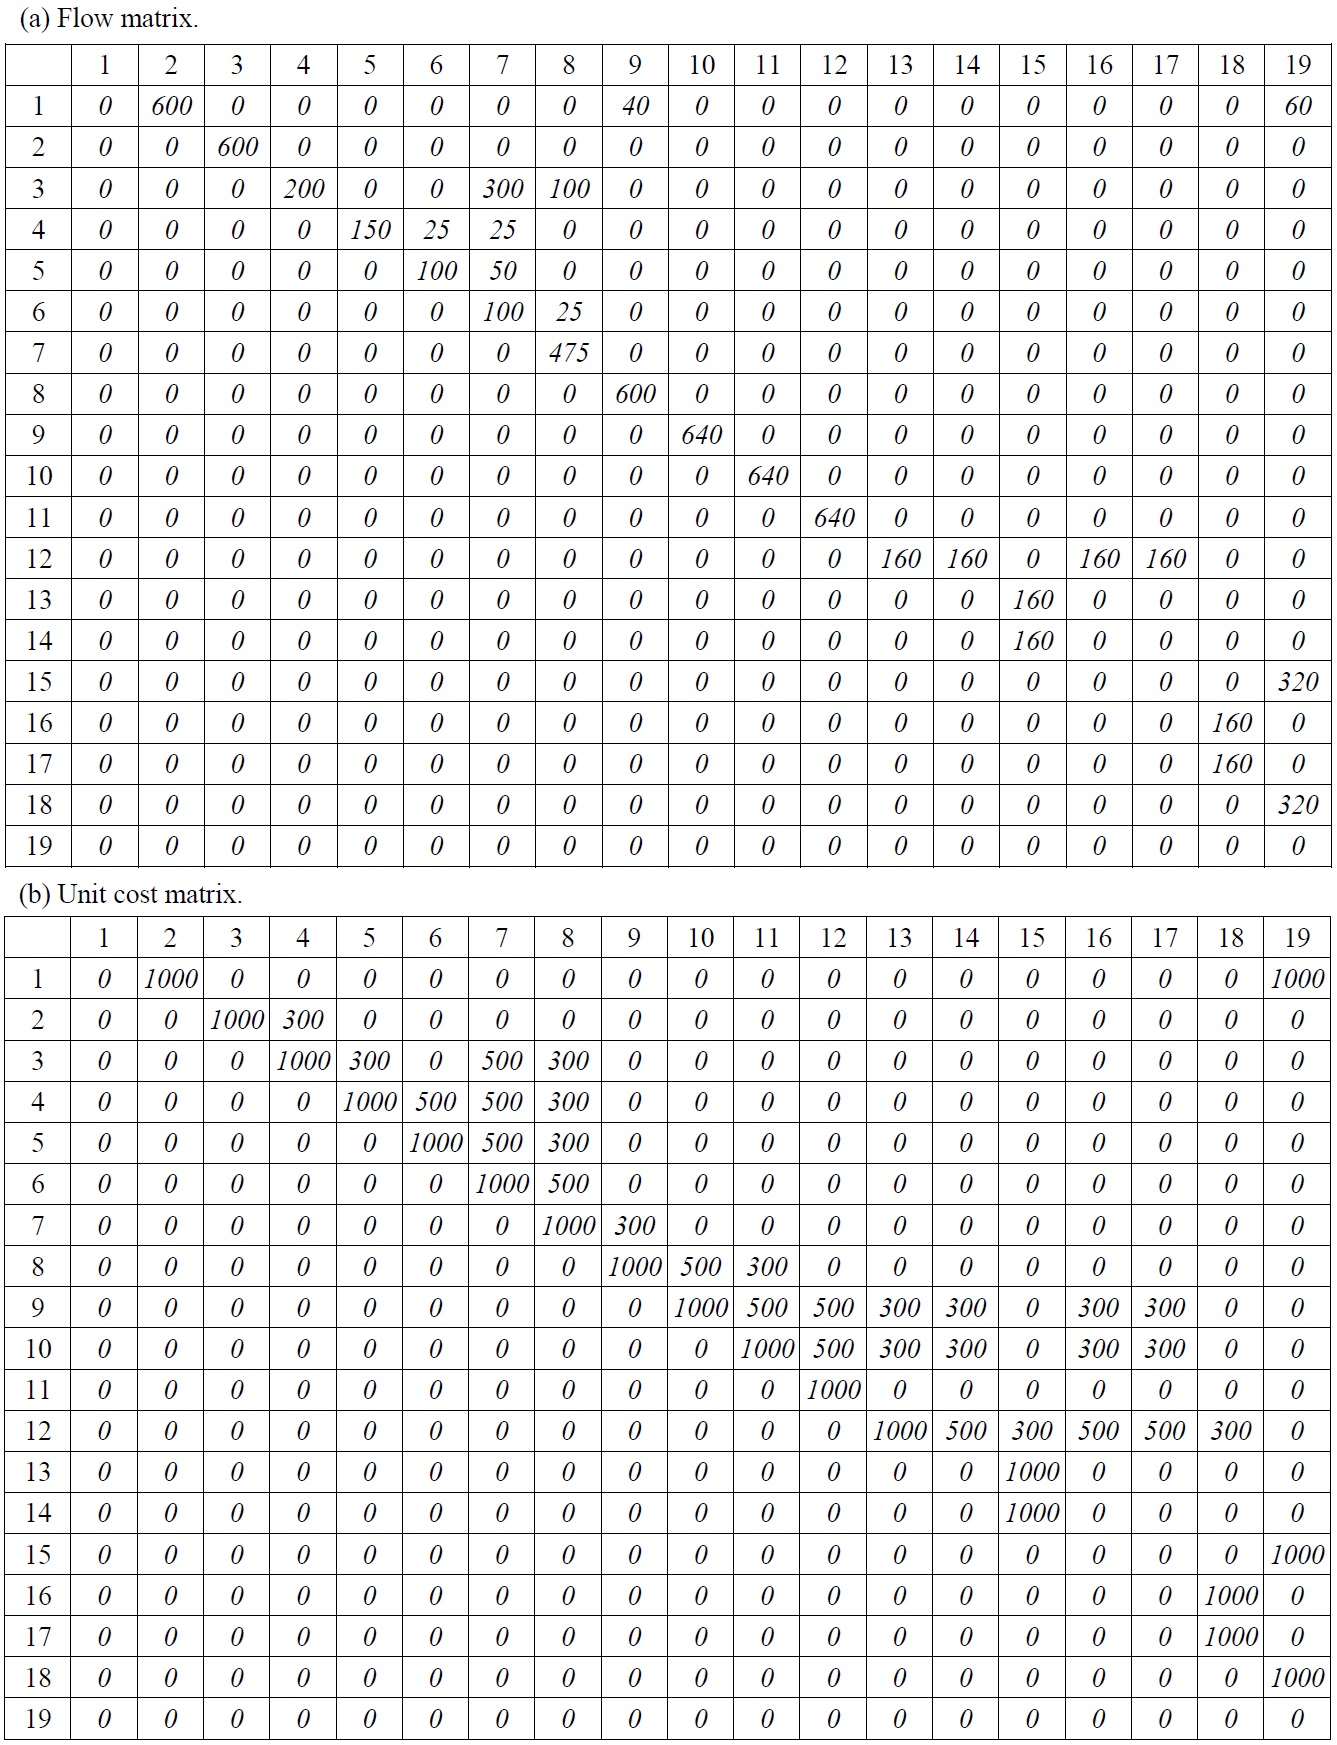
[Table 12] Co-relation among each work area.

Co-relation among each work area.
>
Optimization for production unit location
In this chapter, the optimal location of each work area is determined considering the work flow, the proximity and the work area. The details of the layout optimization are explained in chapter 2.3. The work stages considered in the optimization are described in Table 13. The erection wait areas are added by the requirements from the site owner, and the paint area is divided into the indoor work stage and the outdoor work stage.
For the application of the optimization, the relational intensity among each work stage is considered by the flow matrix and the unit cost for the logistics is considered by the unit cost matrix. The flow matrix and the unit cost matrix are shown in Table 12. The elements of the flow matrix are decided by considering the unit number those are being transferred from the preceding module to the following module. Also, the elements of the unit cost matrix are decided by considering the relative estimation of the transferring cost that is required for the operation of the forklift, transporter, crane, etc.
[Table 13] The work stage description for the optimization.
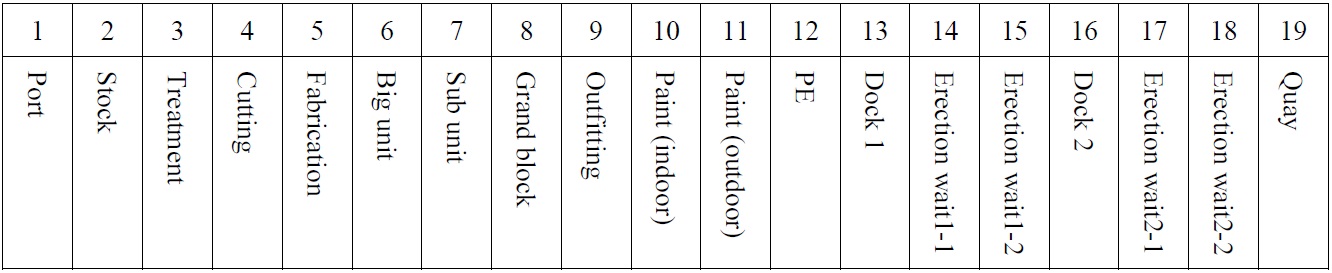
The work stage description for the optimization.
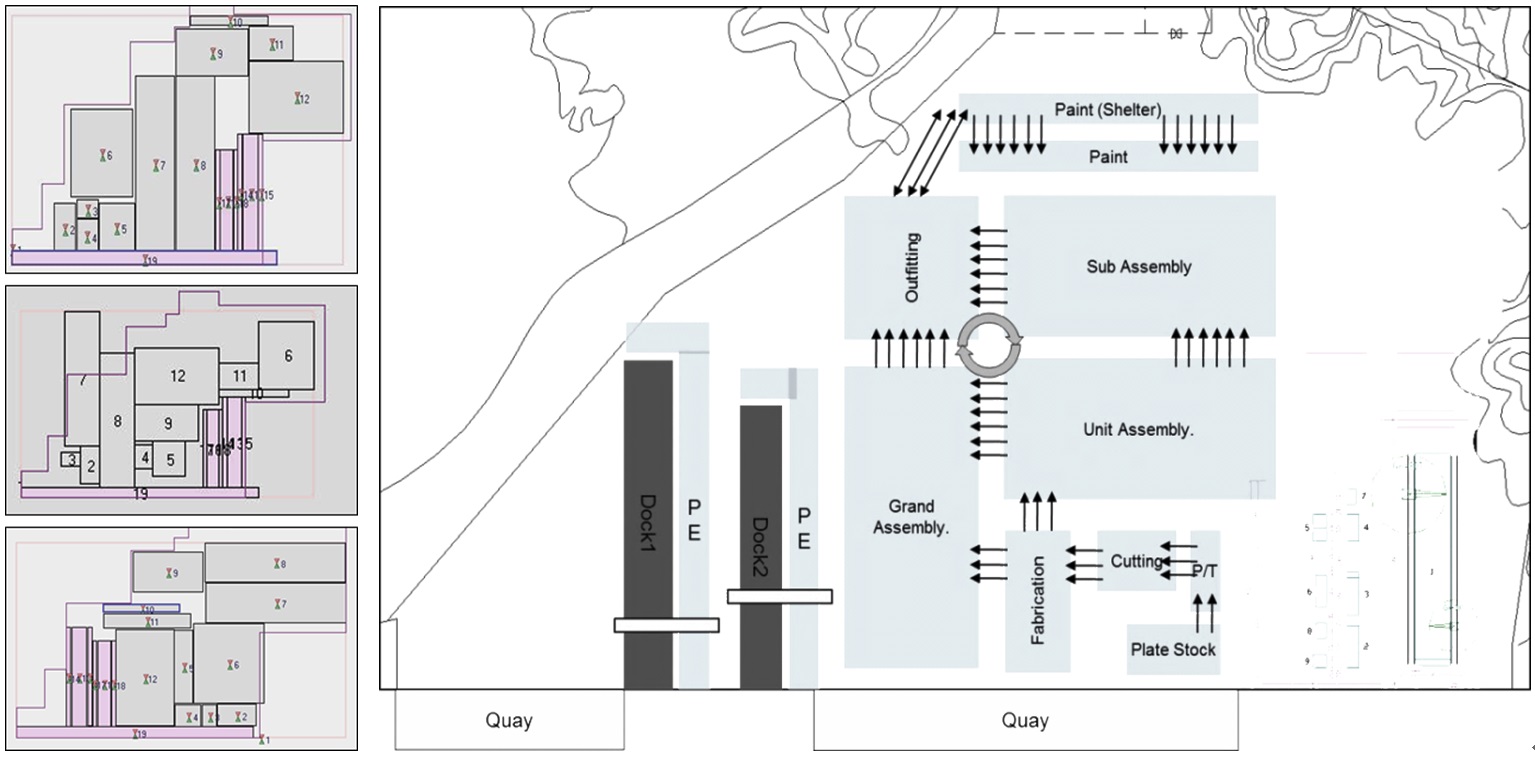
The left side of the Fig. 7 shows the iteration results of the optimization. The optimization results are different every time of the calculation because the random seeds are used. The final decision should be made by the layout engineer. In this paper, final shipyard layout is decided as shown in the right side of the Fig. 7.
The conducting of the unit cell arrangement is performed manually. The method of unit cell arrangement is to locate a small work area inside of a given work stage together with the assigning of a road and a crane. Also, the number of the cells should be satisfied with the results of Table 11. The conducting of the unit cell arrangement has a significant meaning because the required facilities such as overhead cranes, forming machines, etc. can be identified. The facility list is one of a main deliverable for the shipbuilding company.
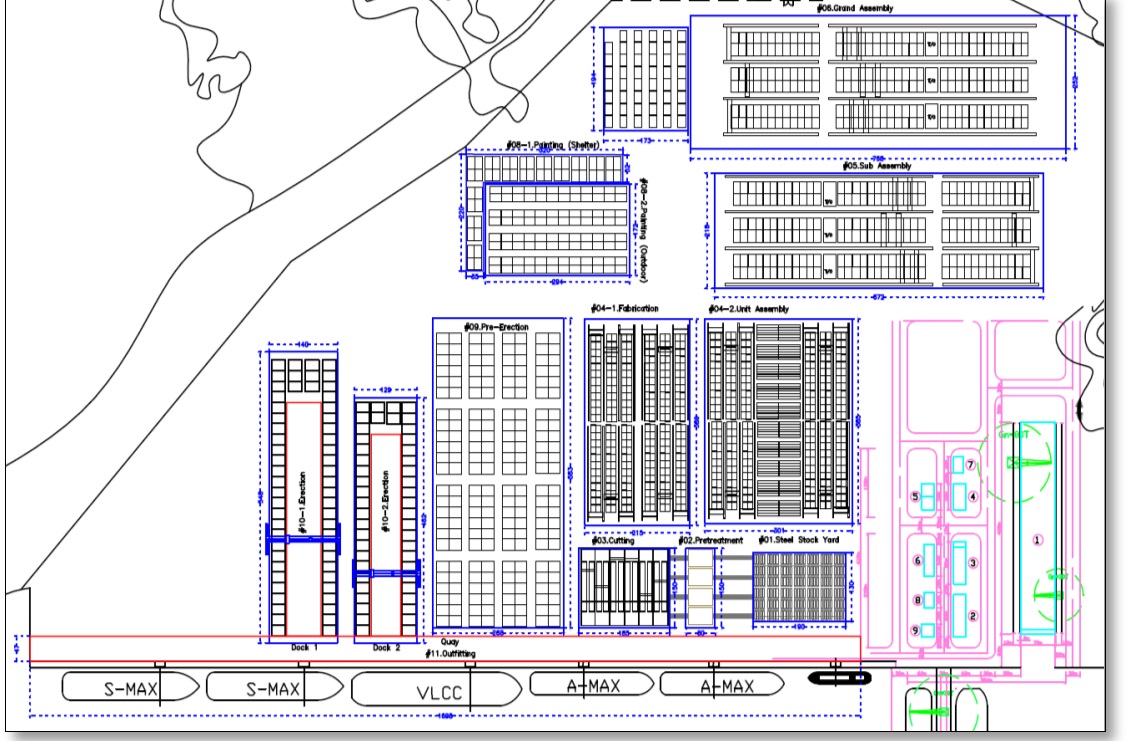
Fig. 8 shows a unit cell arrangement for the cutting work stage. The configuration of cutting work stage is determined by the result of Table 8 and the area for the plate stock and the cut part stock are added. Fig. 9 shows a unit cell arrangement for the grand assembly work stage. The number of the cell coincides with the results of Table 11 and the area of one unit cell is determined by considering the maximum size of the given ship block table (Table 2). Through all of the unit cell arrangement work, the whole shipyard layout is drawn in detail as shown in Fig. 10.
Paradigm shift of the global shipbuilding industry is being accelerated in these days. New shipbuilding business models have to be investigated in order to sustain a current competitiveness. One of the new opportunities is an engineering service about the new shipyard construction.
Previous methods or research cases about the shipbuilding layout was not suitable for the professional target because there were little considerations about the actual product data and the actual operation time data. Also, there were lacks of the comercial business requirements. In this paper, the shipyard layout design method is introduced based on the actual product data and the actual operation time with a reasonable calculation procedure. Also, the commercial requirements from the customer are reflected with an appropriate engineering consideration.
Lastly, the case study about the actual green field project at Venezuela is conducted for the preliminary phase. The proposing method and procedure is validated by being applied to the actual project.
This research lies in extension of the previous researches about the systematic layout design framework (Song et al., 2009; Song et al., 2010). The previous researches is focused on the establishment of the shipyard layout design system and the object of this current research is to provide an internal contents that can be used as functions of system.