Pressure tubes made of Zr-2.5 wt% Nb alloy are important components consisting reactor coolant pressure boundary of a pressurized heavy water reactor, in which unanticipated through-wall cracks and rupture may occur due to a delayed hydride cracking (DHC). The Canadian Standards Association has provided deterministic and probabilistic structural integrity evaluation procedures to protect pressure tubes against DHC. However, intuitive understanding and subsequent assessment of flaw behaviors are still insufficient due to complex degradation mechanisms and diverse influential parameters of DHC compared with those of stress corrosion cracking and fatigue crack growth phenomena. In the present study, a deterministic flaw assessment program was developed and applied for systematic integrity assessment of the pressure tubes. Based on the examination results dealing with effects of flaw shapes, pressure tube dimensional changes, hydrogen concentrations of pressure tubes and plant operation scenarios, a simple and rough method for effective cooldown operation was proposed to minimize DHC risks. The developed deterministic assessment program for pressure tubes can be used to derive further technical bases for probabilistic damage frequency assessment.
A few hundred zirconium alloy pressure tubes in a pressurized heavy water reactor (PHWR) serve as the nuclear fuel channel as well as the reactor coolant pressure boundary. For safe operation of the PHWR, reliable performance of the tubes should be maintained throughout its harsh life environment. However, due to high temperature, pressure and neutron flux, Zirconium alloy pressure tubes may be subjected to aging mechanisms such as 'delayed hydride cracking (DHC)', 'irradiation enhanced deformation' and 'changes of material properties'. To date, some pressure tubes in early reactors have leaked and two pressure tubes have ruptured due to the DHC[1].
In order to prevent incidents of tube failures, fitness for service assessment (FFSA) has to be carried out considering detected or postulated flaws[2]. The CANDU owners group (COG) developed the FFSA guidelines that were first published for trial use in 1991[3] and updated in 1996[4,5]. Subsequently, CSA N285.8 was published in 2005 as a code & standard for the FFSA of PHWR pressure tubes [6,7]. It provides extensive flaw assessment procedures and requires various input parameters such as flaw shapes (length, depth and root radius), tube geometries (diameter and thickness), hydrogen concentration of the tube and heatup / cooldown transients. Especially, the procedures for DHC initiation and growth assessment are very complicated compared with other procedures like ASME B&PV section XI or API (American Petroleum Institute) code. However, due to lack of details, it is difficult to understand how diverse input parameters affect the DHC and which of these parameters is more important than others.
The motivation for this research is to make technical bases of pressure tubes for the probabilistic assessment required by the code & standard as well as to recommend a simple method to reduce DHC risks. To get insight into the integrity of pressure tubes, we first developed a flaw assessment program according to CSA N285.8 procedures. Then, by using the program, effects of flaw shapes, pressure tube dimensional changes, hydrogen concentrations of pressure tubes and plant operation scenarios on DHC initiation and growth were examined. The present study on DHC behaviors of pressure tubes is restricted to the CSA N285.8 procedure, from a conservative point of view, which may lead to somewhat different results from real DHC behaviors of pressure tubes.
2. DETERMINISTIC FLAW ASSESSMENT PROGRAM
2.1 Assessment Program Summary
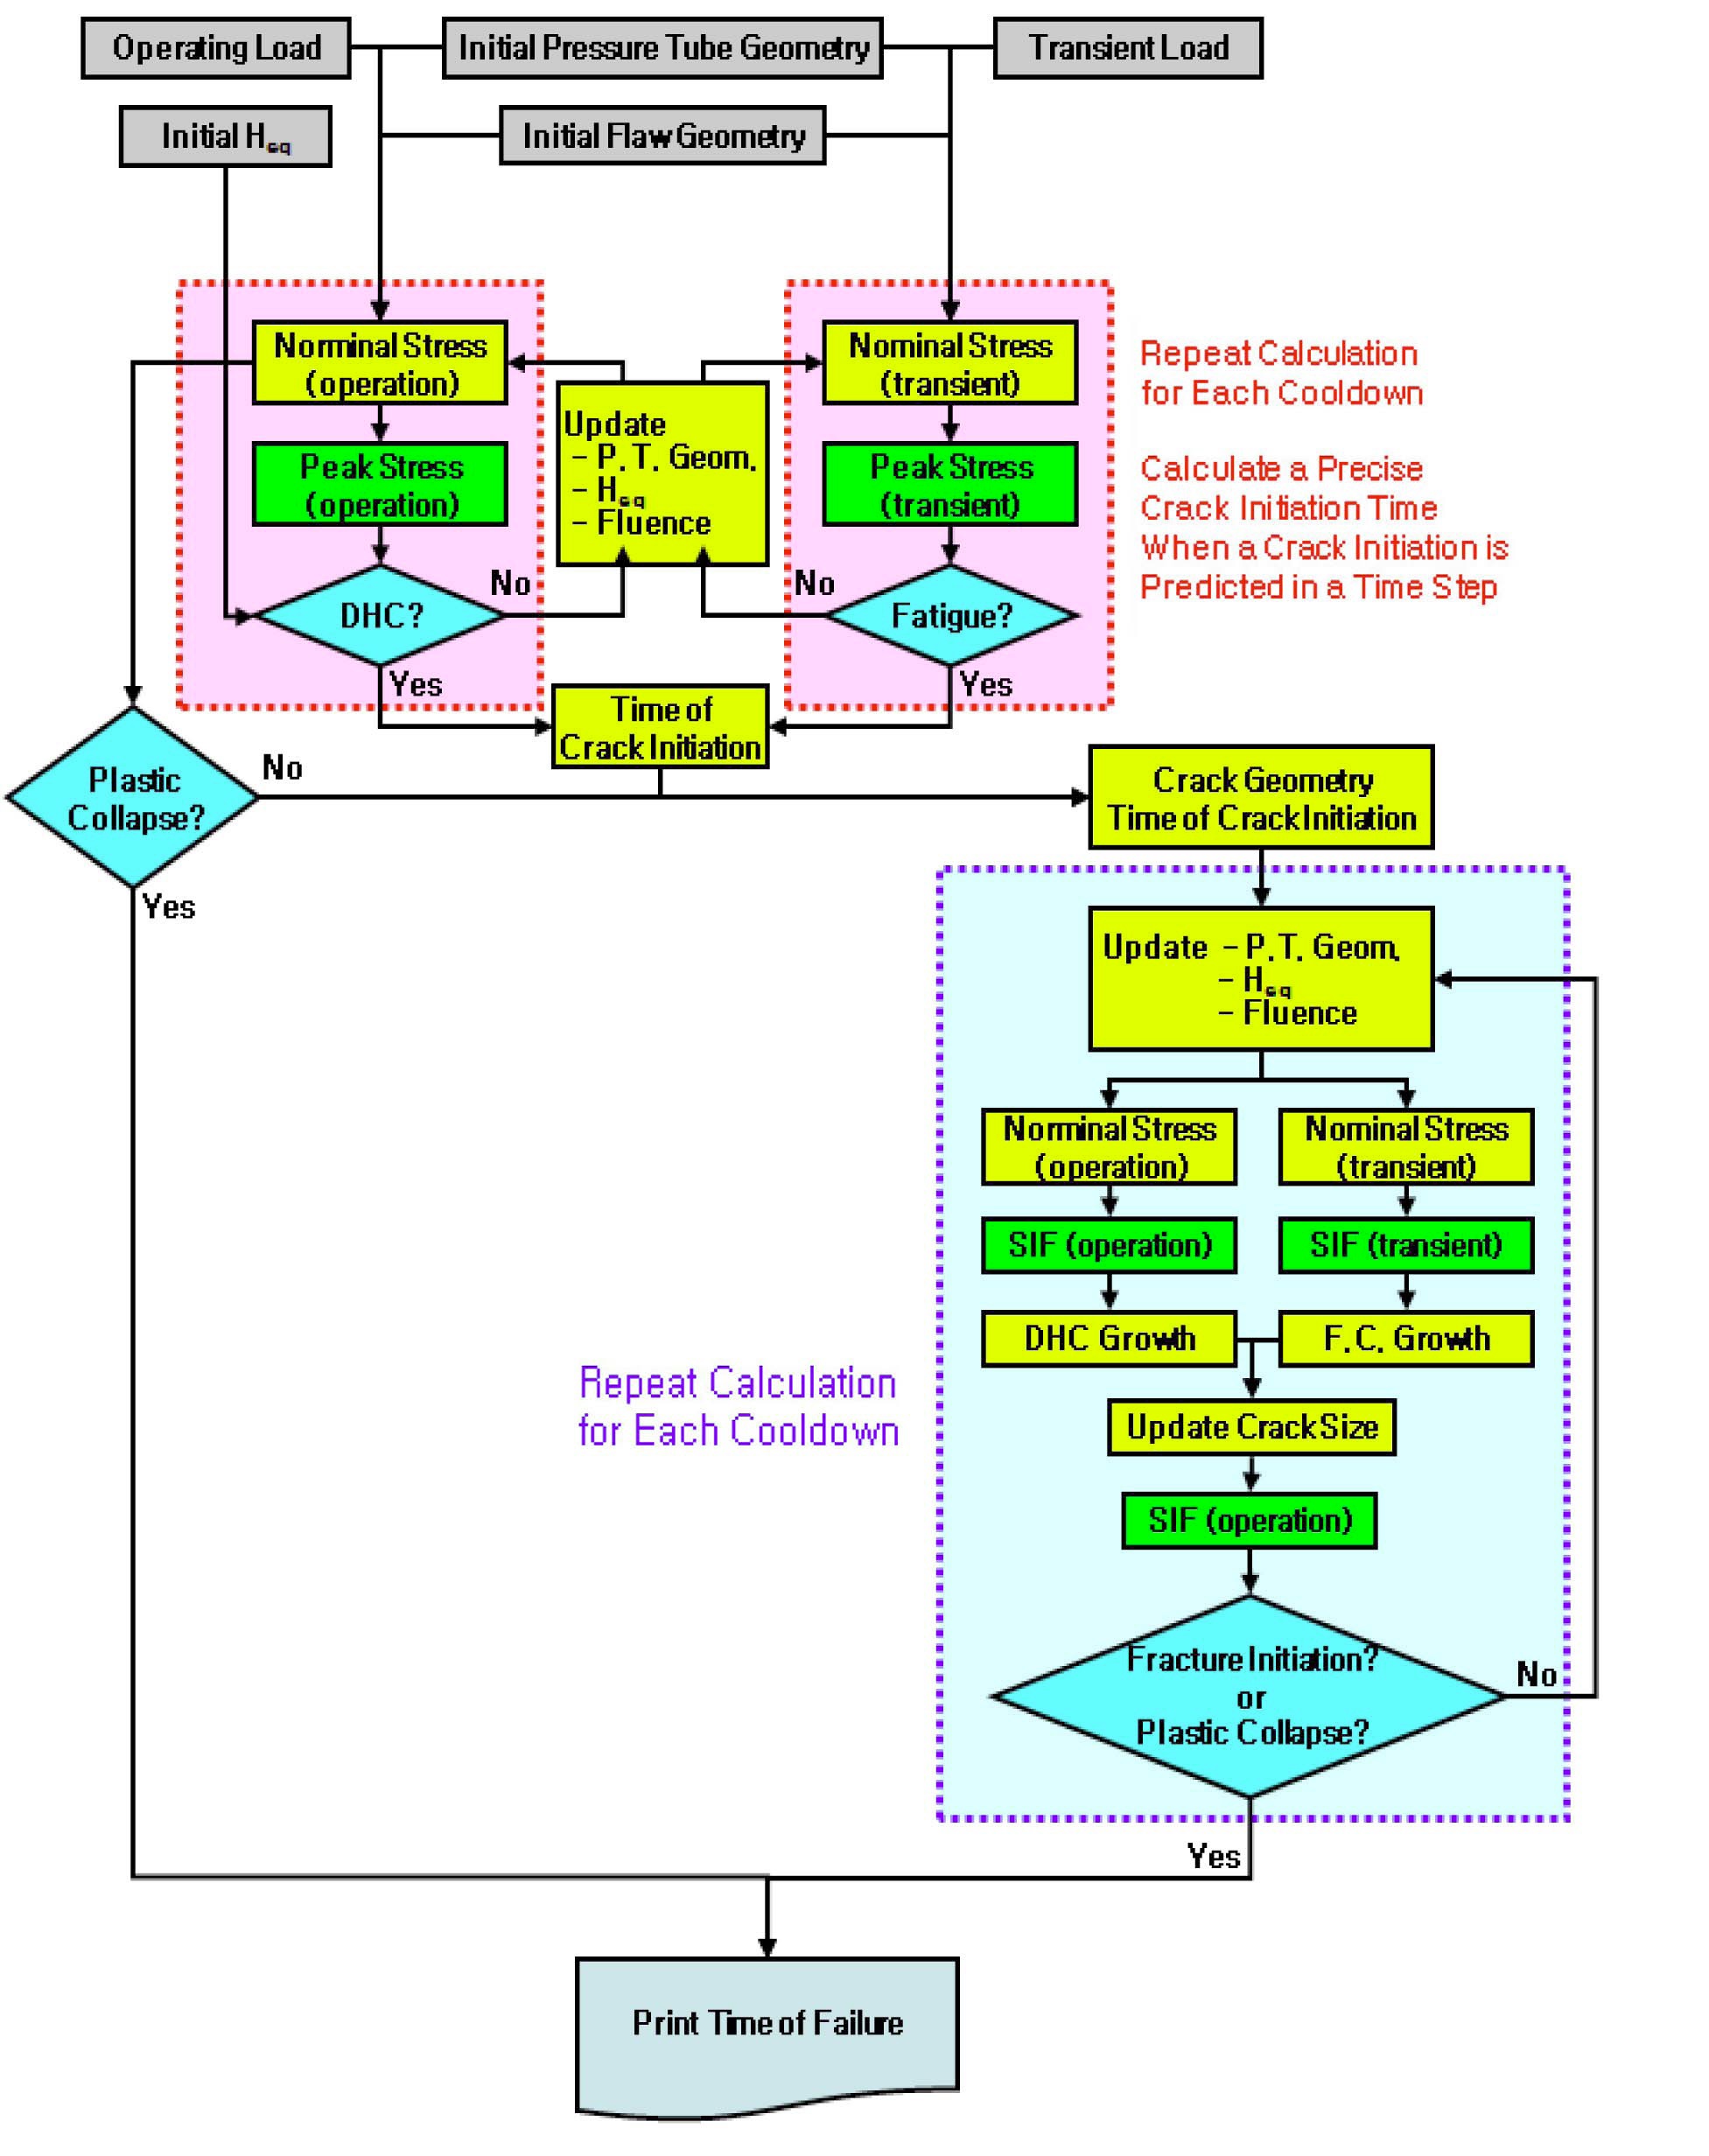
A deterministic flaw assessment program for pressure tubes was developed based on the procedure of CSA N285.8. It aims to predict crack initiation and growth by the DHC as well as final failure by fracture initiation and plastic collapse. Also, the program can provide the times for each event (crack initiation and final failure etc.) and consider the location of a flaw (channel location and axial position of the flaw in the pressure tube). The principal considerations for developing the assessment program are summarized in the following paragraph, which abide by the procedures prescribed in CSA N285.8.
Initial volumetric (blunt) flaws in the pressure tubes undergo normal operation and transient loads, which may lead to either fatigue crack and DHC initiation or plastic collapse during operation. Also, hydrogen concentration and neutron fluence increase continuously and nominal stresses increase due to dimensional change of the flawed tubes such as thickness reduction and diametral expansion. So, effects of the hydrogen concentration and neutron fluence increment as well as dimensional change in accordance with time elapse is taken into account for crack initiation evaluation. During these evaluations, the three aforementioned parameters are continuously revised and reevaluated at each time interval to justify the fracture initiation and plastic collapse. Fig. 1 shows a brief flow diagram for the assessment program developed in this study.
CSA N285.8 specifies evaluation options on the DHC initiation in terms of hydrogen concentration. Because pressure tube material contain deuterium as well as hydro-gen in PHWR condition, the hydrogen equivalent concen-tration (
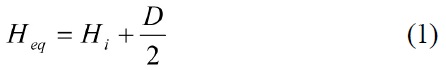
where,
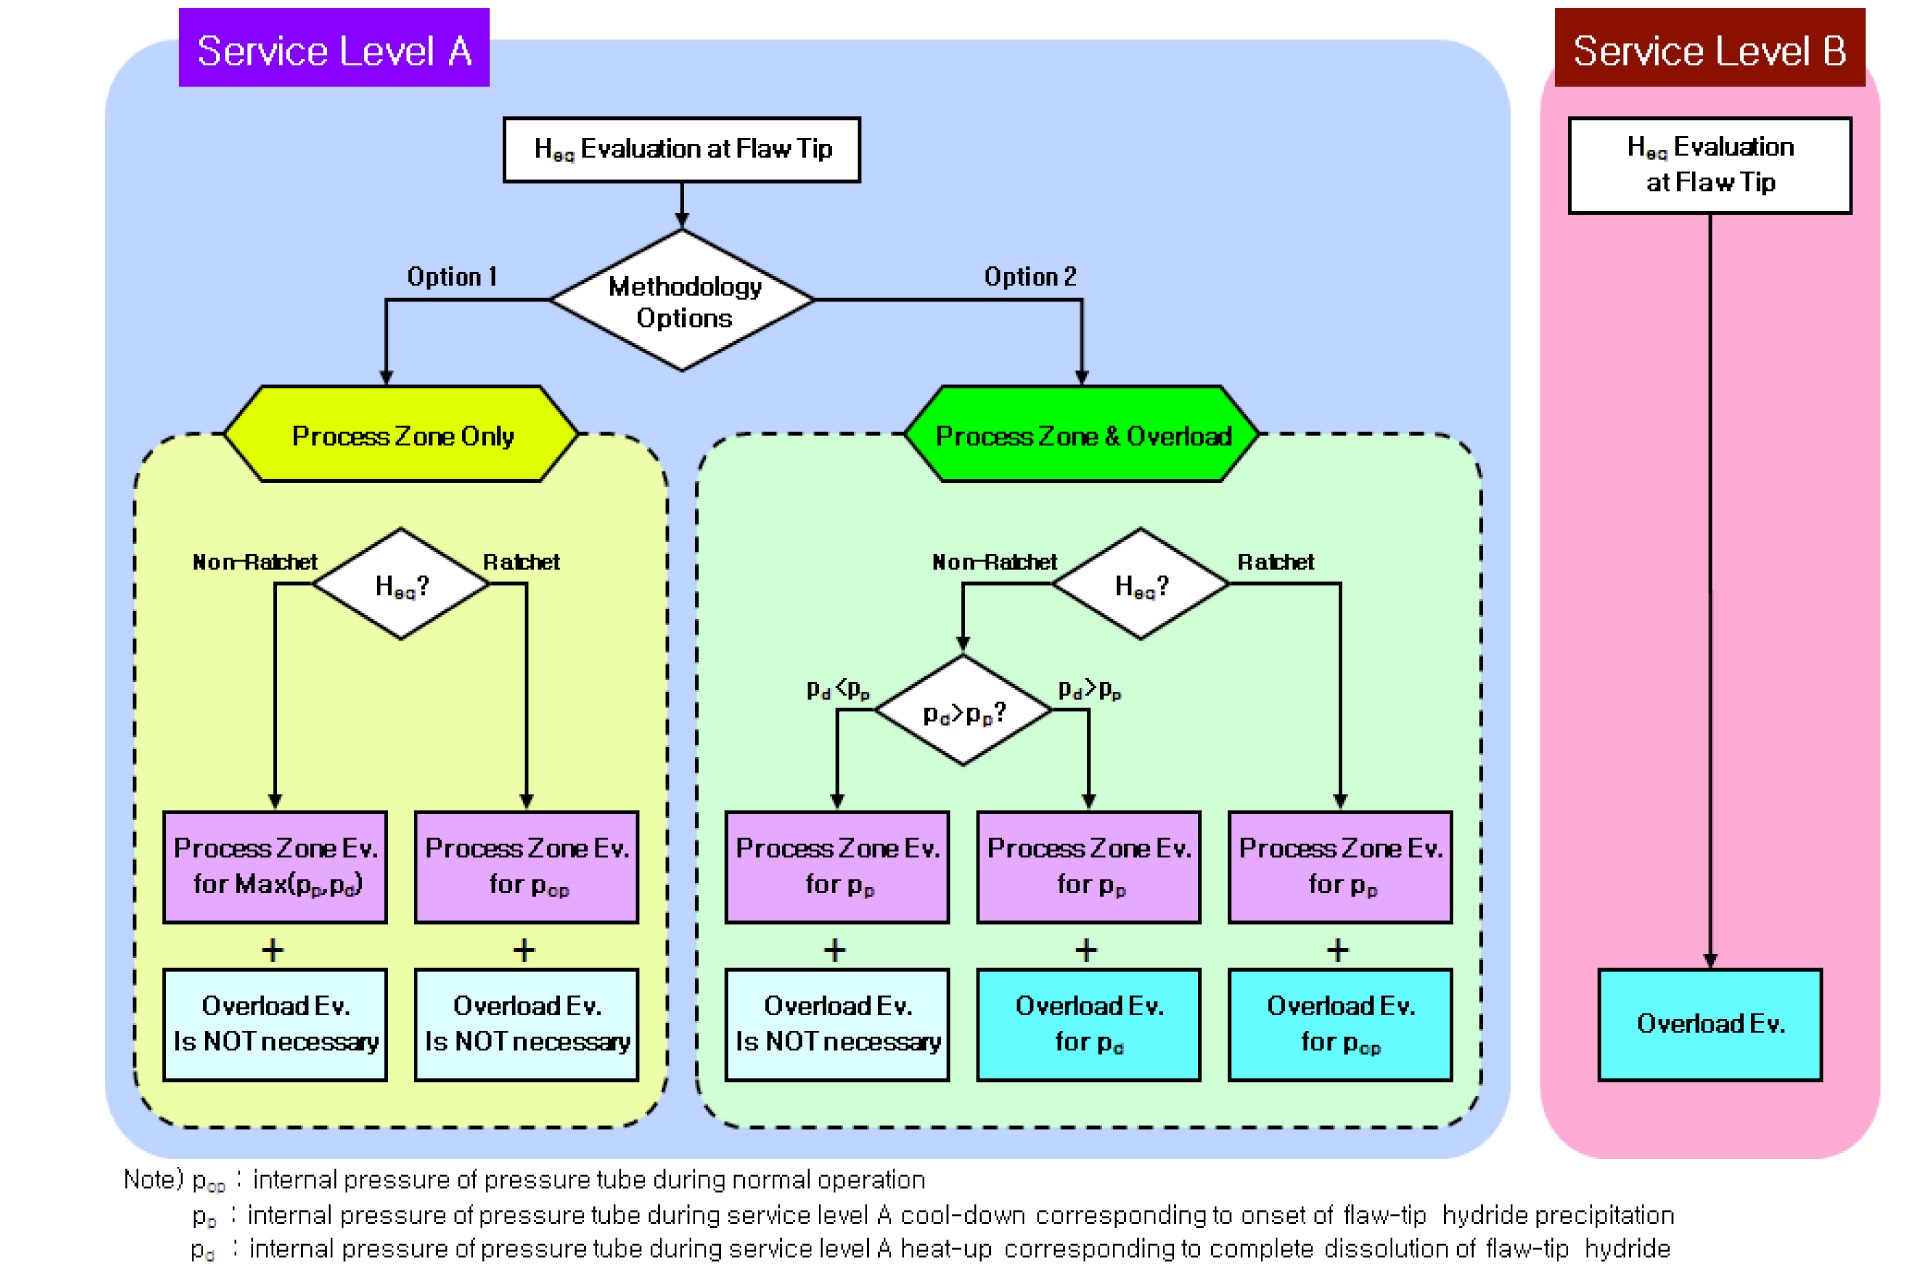
CSA N285.8 describes various options for DHC initiation assessment methods and their scope of application. In this study, the options are briefly depicted in Fig. 2. The DHC initiation assessment methods are classified into two groups; (1) a process-zone evaluation procedure appropriate for pressure tubes with a constant temperature (normal operation) condition or a temperature decrease (cooldown operation) condition, and (2) a hydrided region overload evaluation procedure appropriate for pressure tubes with a temperature increase (upset or heatup transients) condition which has not been documented in CSA N285.8. While the former includes a few kinds of calculation options, such as a threshold peak stress evaluation method and several explicit process-zone methods, all the calculation options are based on the same theory and provide almost identical results for the DHC initiation. So, with regard to the DHC initiation, the threshold peak stress evaluation method with the shortest calculation time was adopted in the flaw assessment program through this research.
During the cooldown transient of a PHWR plant, internal pressure and temperature are slowly decreased. Hydrogen is dissolved at the matrix of pressure tube material under high temperature conditions and is precipitated under low temperature conditions. The aforementioned threshold peak stress evaluation method considers that DHC initiation
occurs when a maximum applied peak stress under hydride precipitation condition is higher than a threshold value. CSA N285.8 presents a hydride precipitation temperature as follows
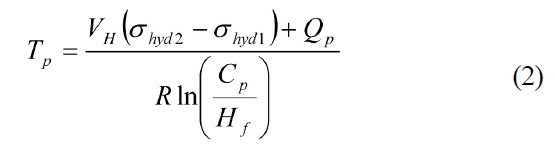
where,
The above equation represents that the higher hydrostatic stress gradient, the higher local concentration of hydrogen at the flaw tip which in turns lowers hydride precipitation temperature at the flaw tip. Here, the
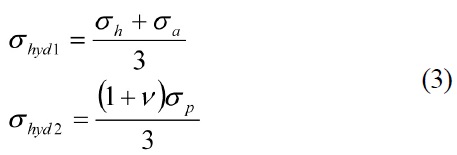
where,
CSA N285.8 considers that DHC growth occurs when the applied stress intensity factor is greater than a threshold value (
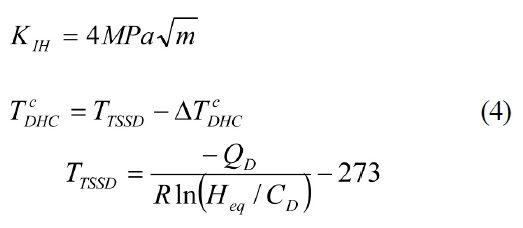
where,
2.4 Reliability of Flaw Assessment Program
The reliability of the flaw assessment program should be verified through a feasibility demonstration for key parameters such as the peak stress and stress intensity factor described above. However, since there are no comparable papers or open literature addressing DHC behavior in relation to CSA N285.8, validities of the key parameter calculation algorithms employed in the program were approved according to in-house qualification procedures. For example, a previous study by Lee et al.[8] showed that the stress intensity factor calculation formula contained in CSA N285.8 provides reliable calculation results compared with corresponding detailed finite element analysis results. Prior to this, also, another study by Kim et al.[9] examined various kinds of engineering formulae for the peak stress calculation of pressure tubes with a volumetric flaw. It showed that the peak stress value obtained from CSA N285.8 is a little bit conservative in general but sufficiently reliable when compared with three-dimensional finite element analysis result. Therefore, we consider that the program developed in this study can be used for deterministic evaluation of the DHC behaviors based on the peak stress and stress intensity factor in PHWR pressure tubes.
3. EFFECTS OF FLAW SIZE AND HYDROGEN CONCENTRATION
The DHC behaviors of volumetric flaws were estimated by using the program to investigate the effects of varying input parameters. Even though fatigue remains a more plausible crack initiation mechanism than delayed hydride cracking, in general, evaluation of the fatigue crack initiation was excluded by considering inherent over-conservatism of the relevant procedure in CSA N285.8-05[6] and prime object dealing with the DHC assessment of the present study.
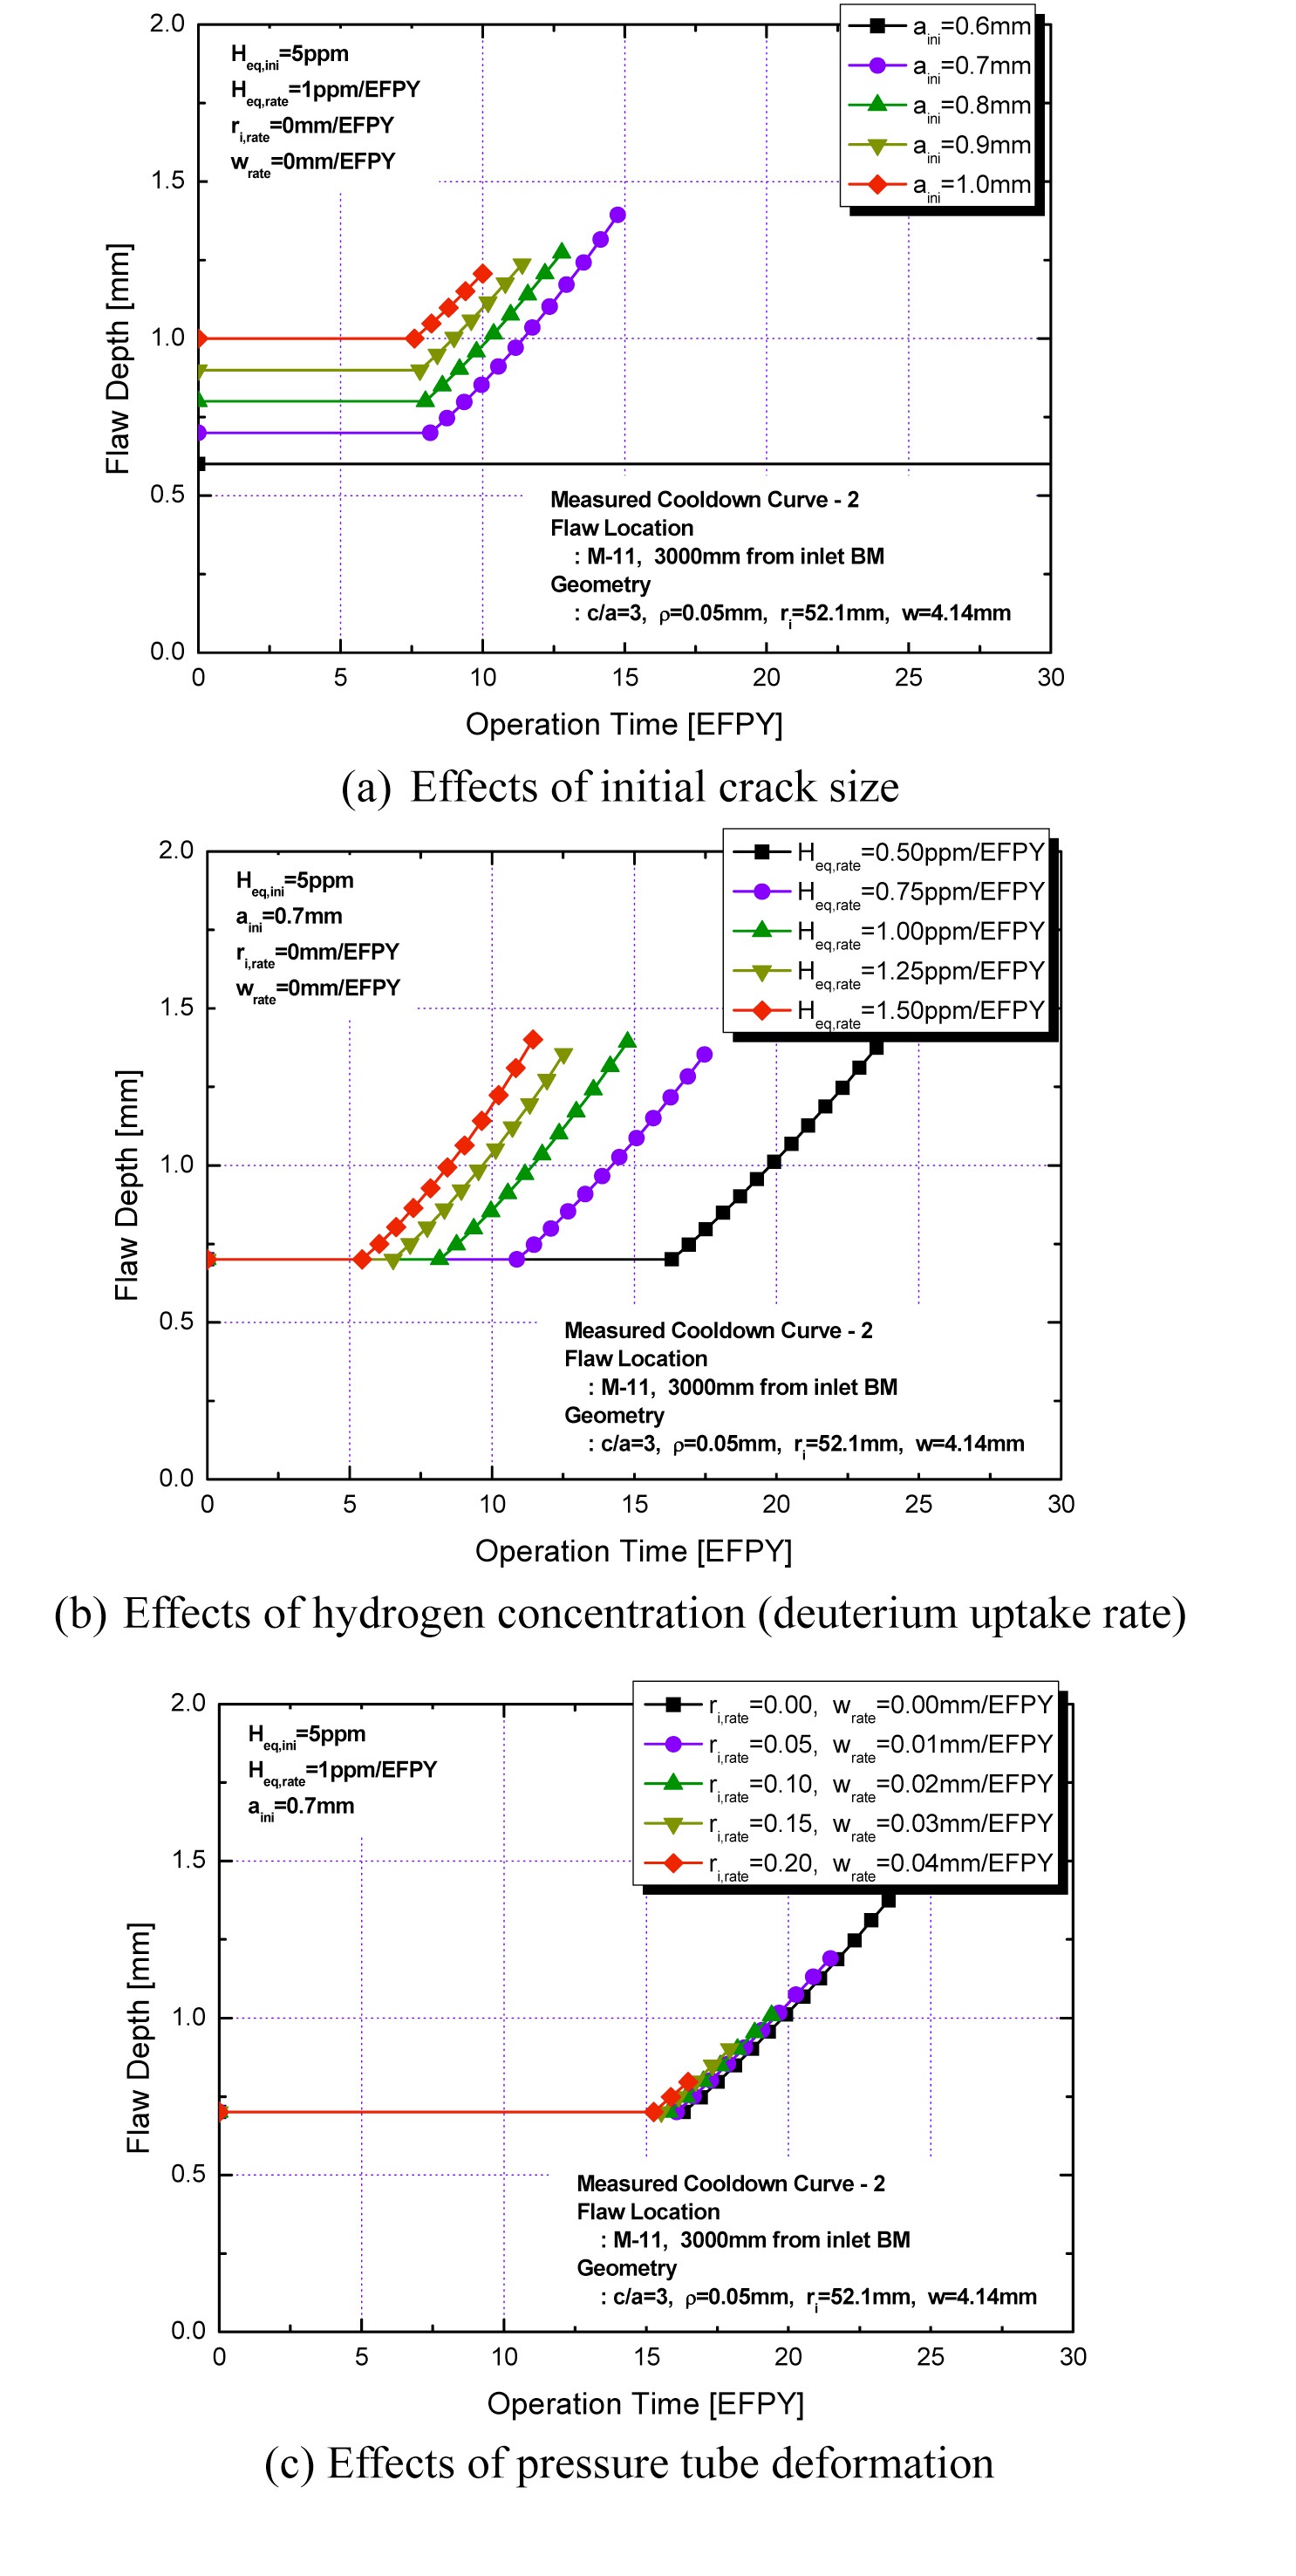
A postulated volumetric flaw at the center of a high power fuel channel, which is 3,000mm away from the inlet burnish mark of a pressure tube, was chosen for the evaluation under a representative cooldown transient. Fig. 3 shows the resulting flaw behaviors, in which the crack initiation and growth from the volumetric flaw are dependent on the initial flaw size,
Fig. 3(a) illustrates that the crack initiation time is slightly retarded with a decrease of the flaw depth from 1.0mm to 0.7mm and crack initiation does not occur when
the initial flaw depth is sufficiently shallow like 0.6mm. Fig. 3(b) shows that the onset of crack initiation with an increase of
As depicted in Fig. 3, higher
4. EFFECTS OF COOLDOWN TRANSIENTS
4.1 Simplified Cooldown Transients
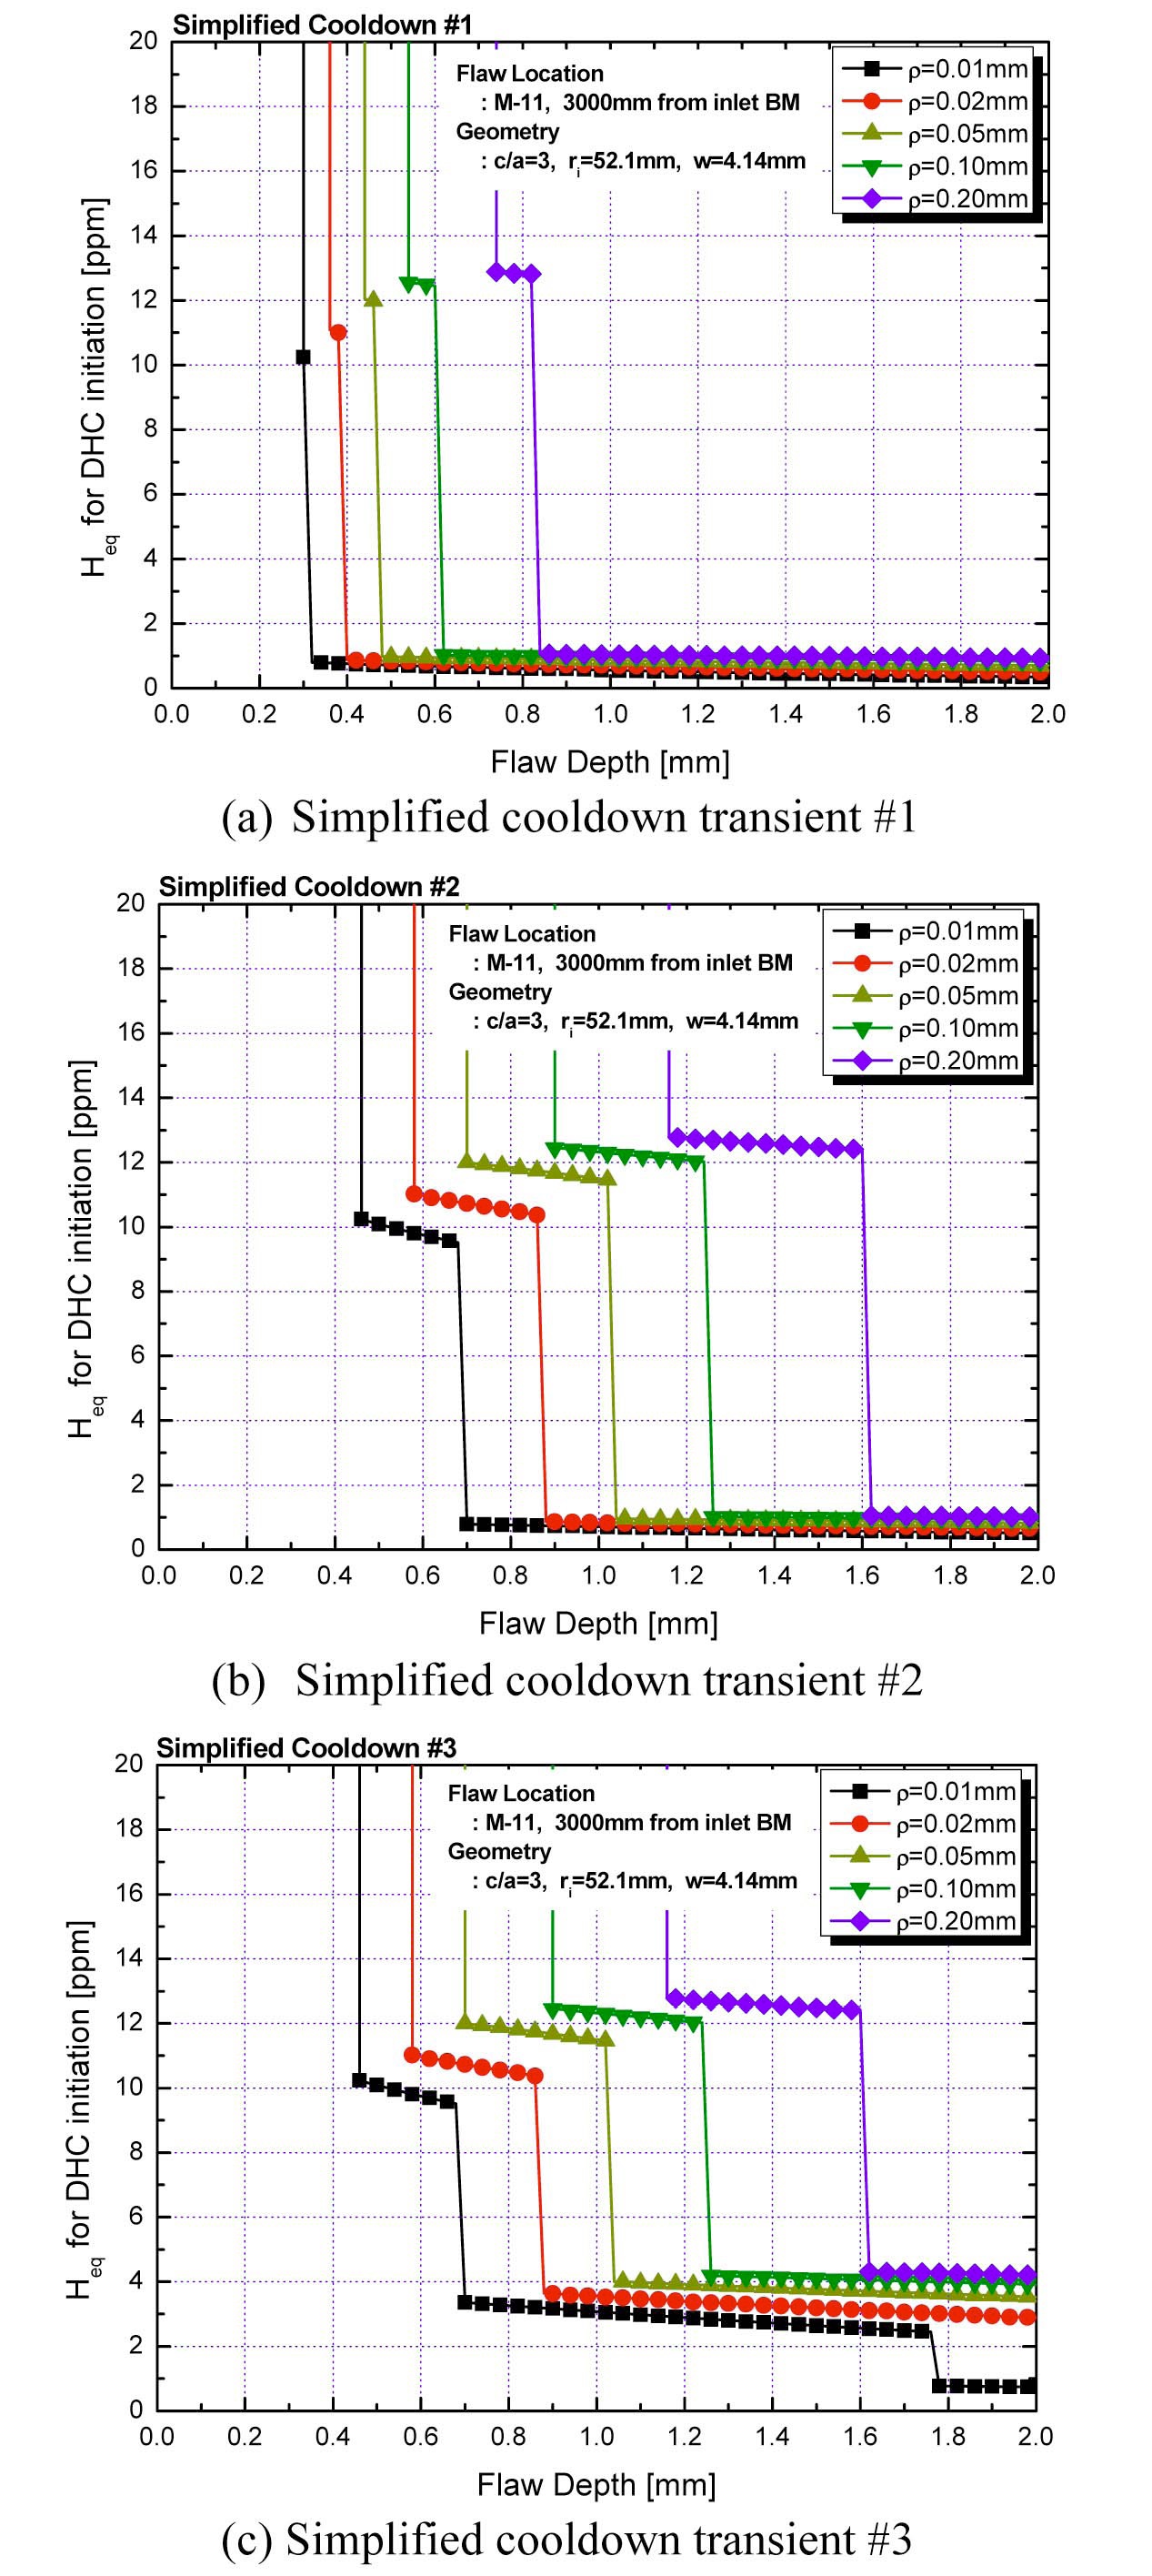
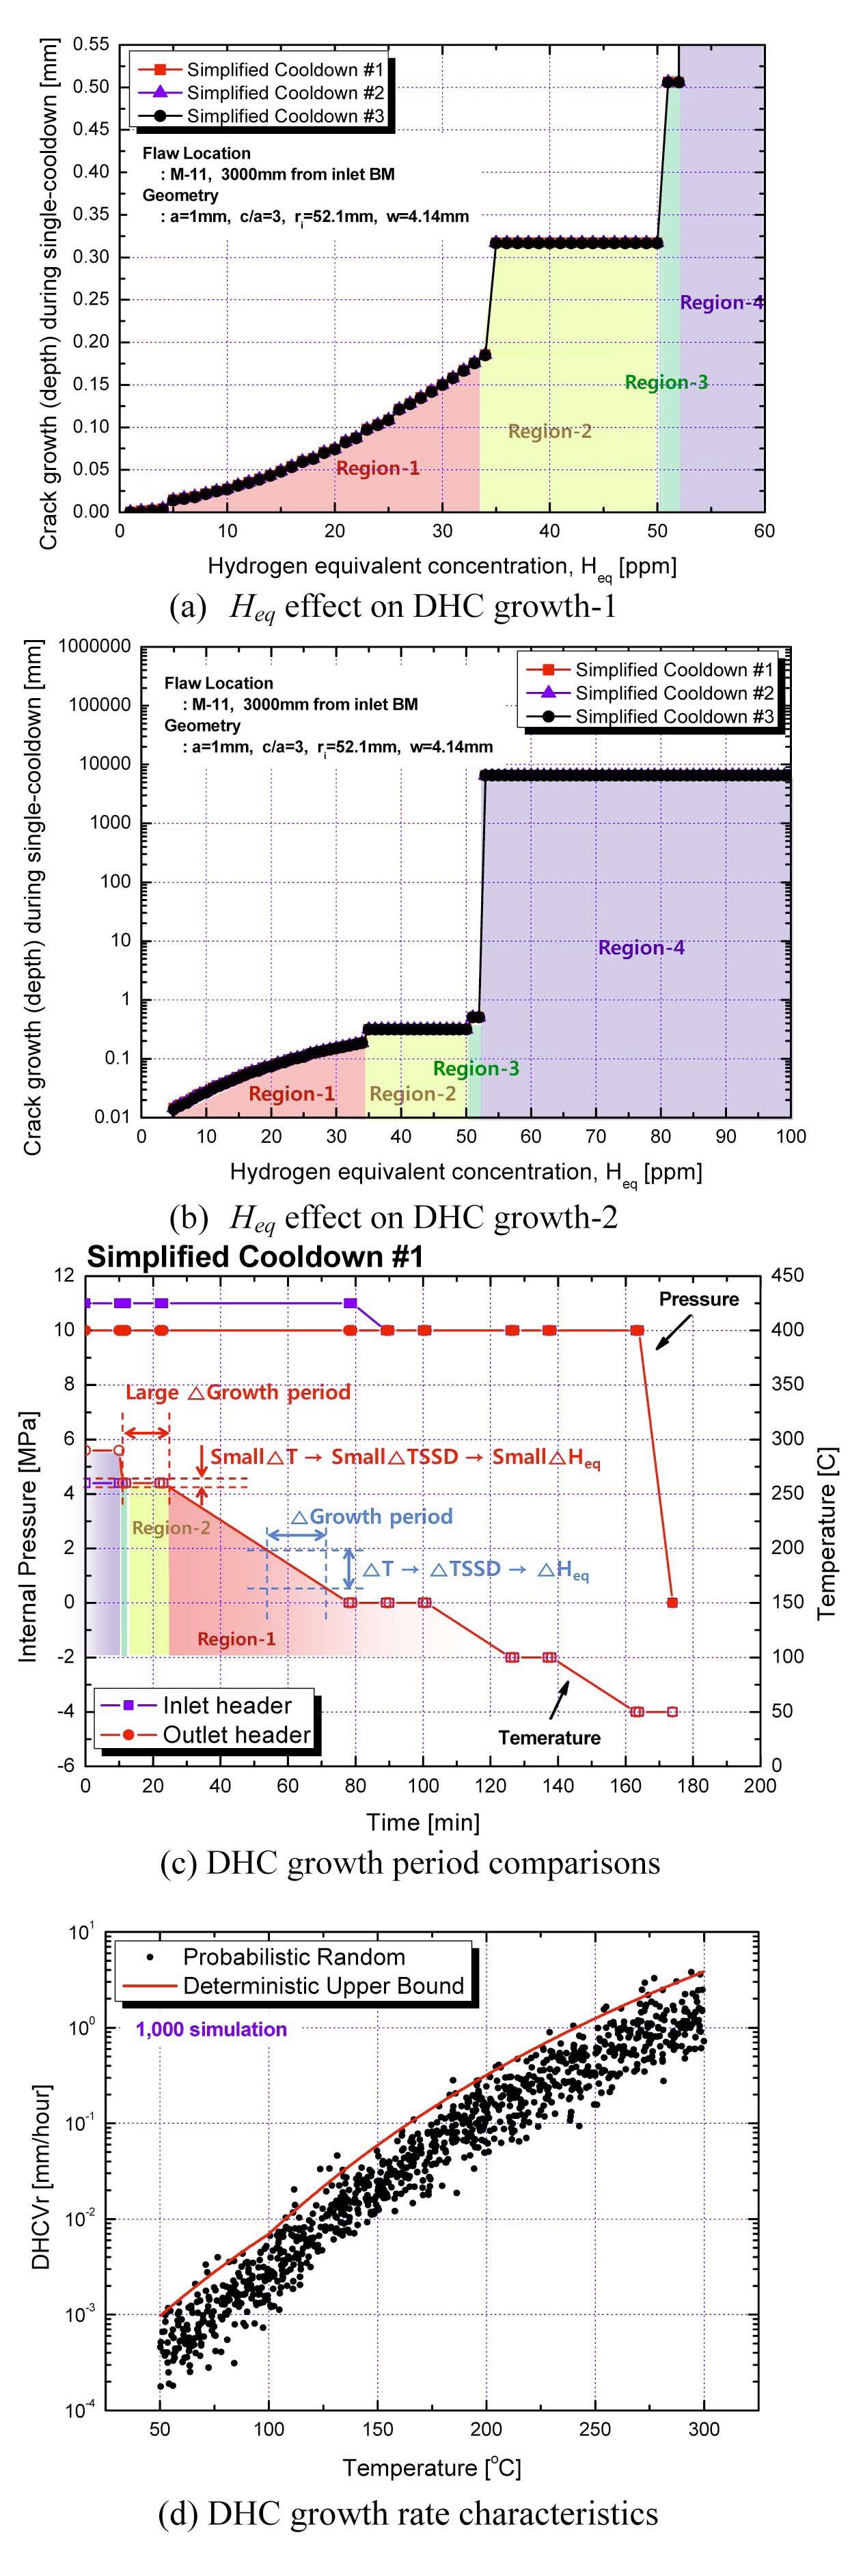
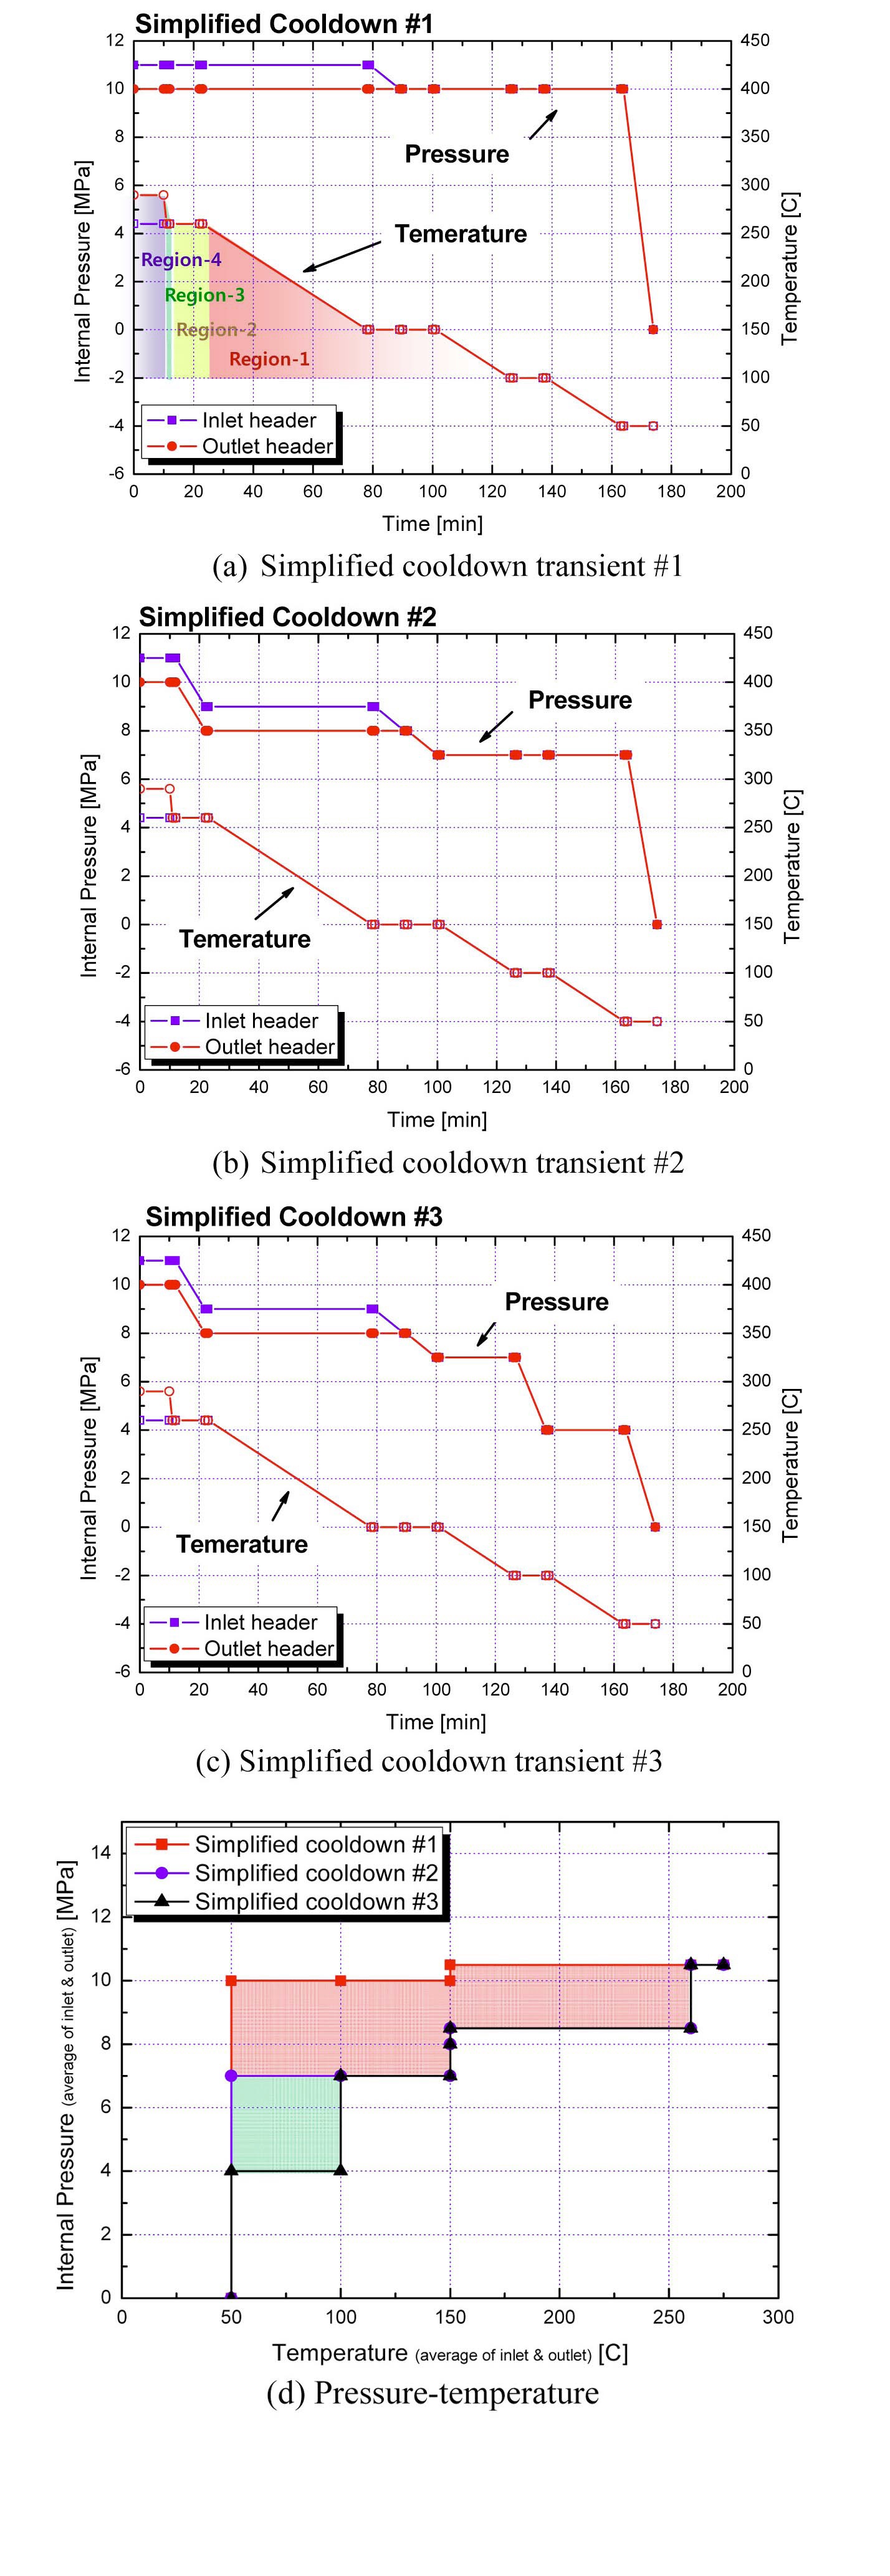
In order to exclude effects of complexity of the plant cooldown transient in a PHWR reactor and to facilitate the understanding of cooldown transient effects, the DHC behaviors were evaluated under simplified hypothetical cooldown transients. The simplified cooldown transient #1 in Fig. 4(a) represents the case that operating pressure is sustained until temperature becomes sufficiently low. The simplified cooldown transient #2 in Fig. 4(b) defines that two step depressurization operation is conducted at temperature of 260℃ and 150℃, respectively. In the simplified cooldown transient #3 shown in Fig. 4(c), additional depressurization is assumed when the temperature reaches to 100℃. Fig. 4(d) represents the plot of three simple cooldown transients in a pressure-temperature plane.
4.2 DHC Initiation under Simplified Cooldown Transients
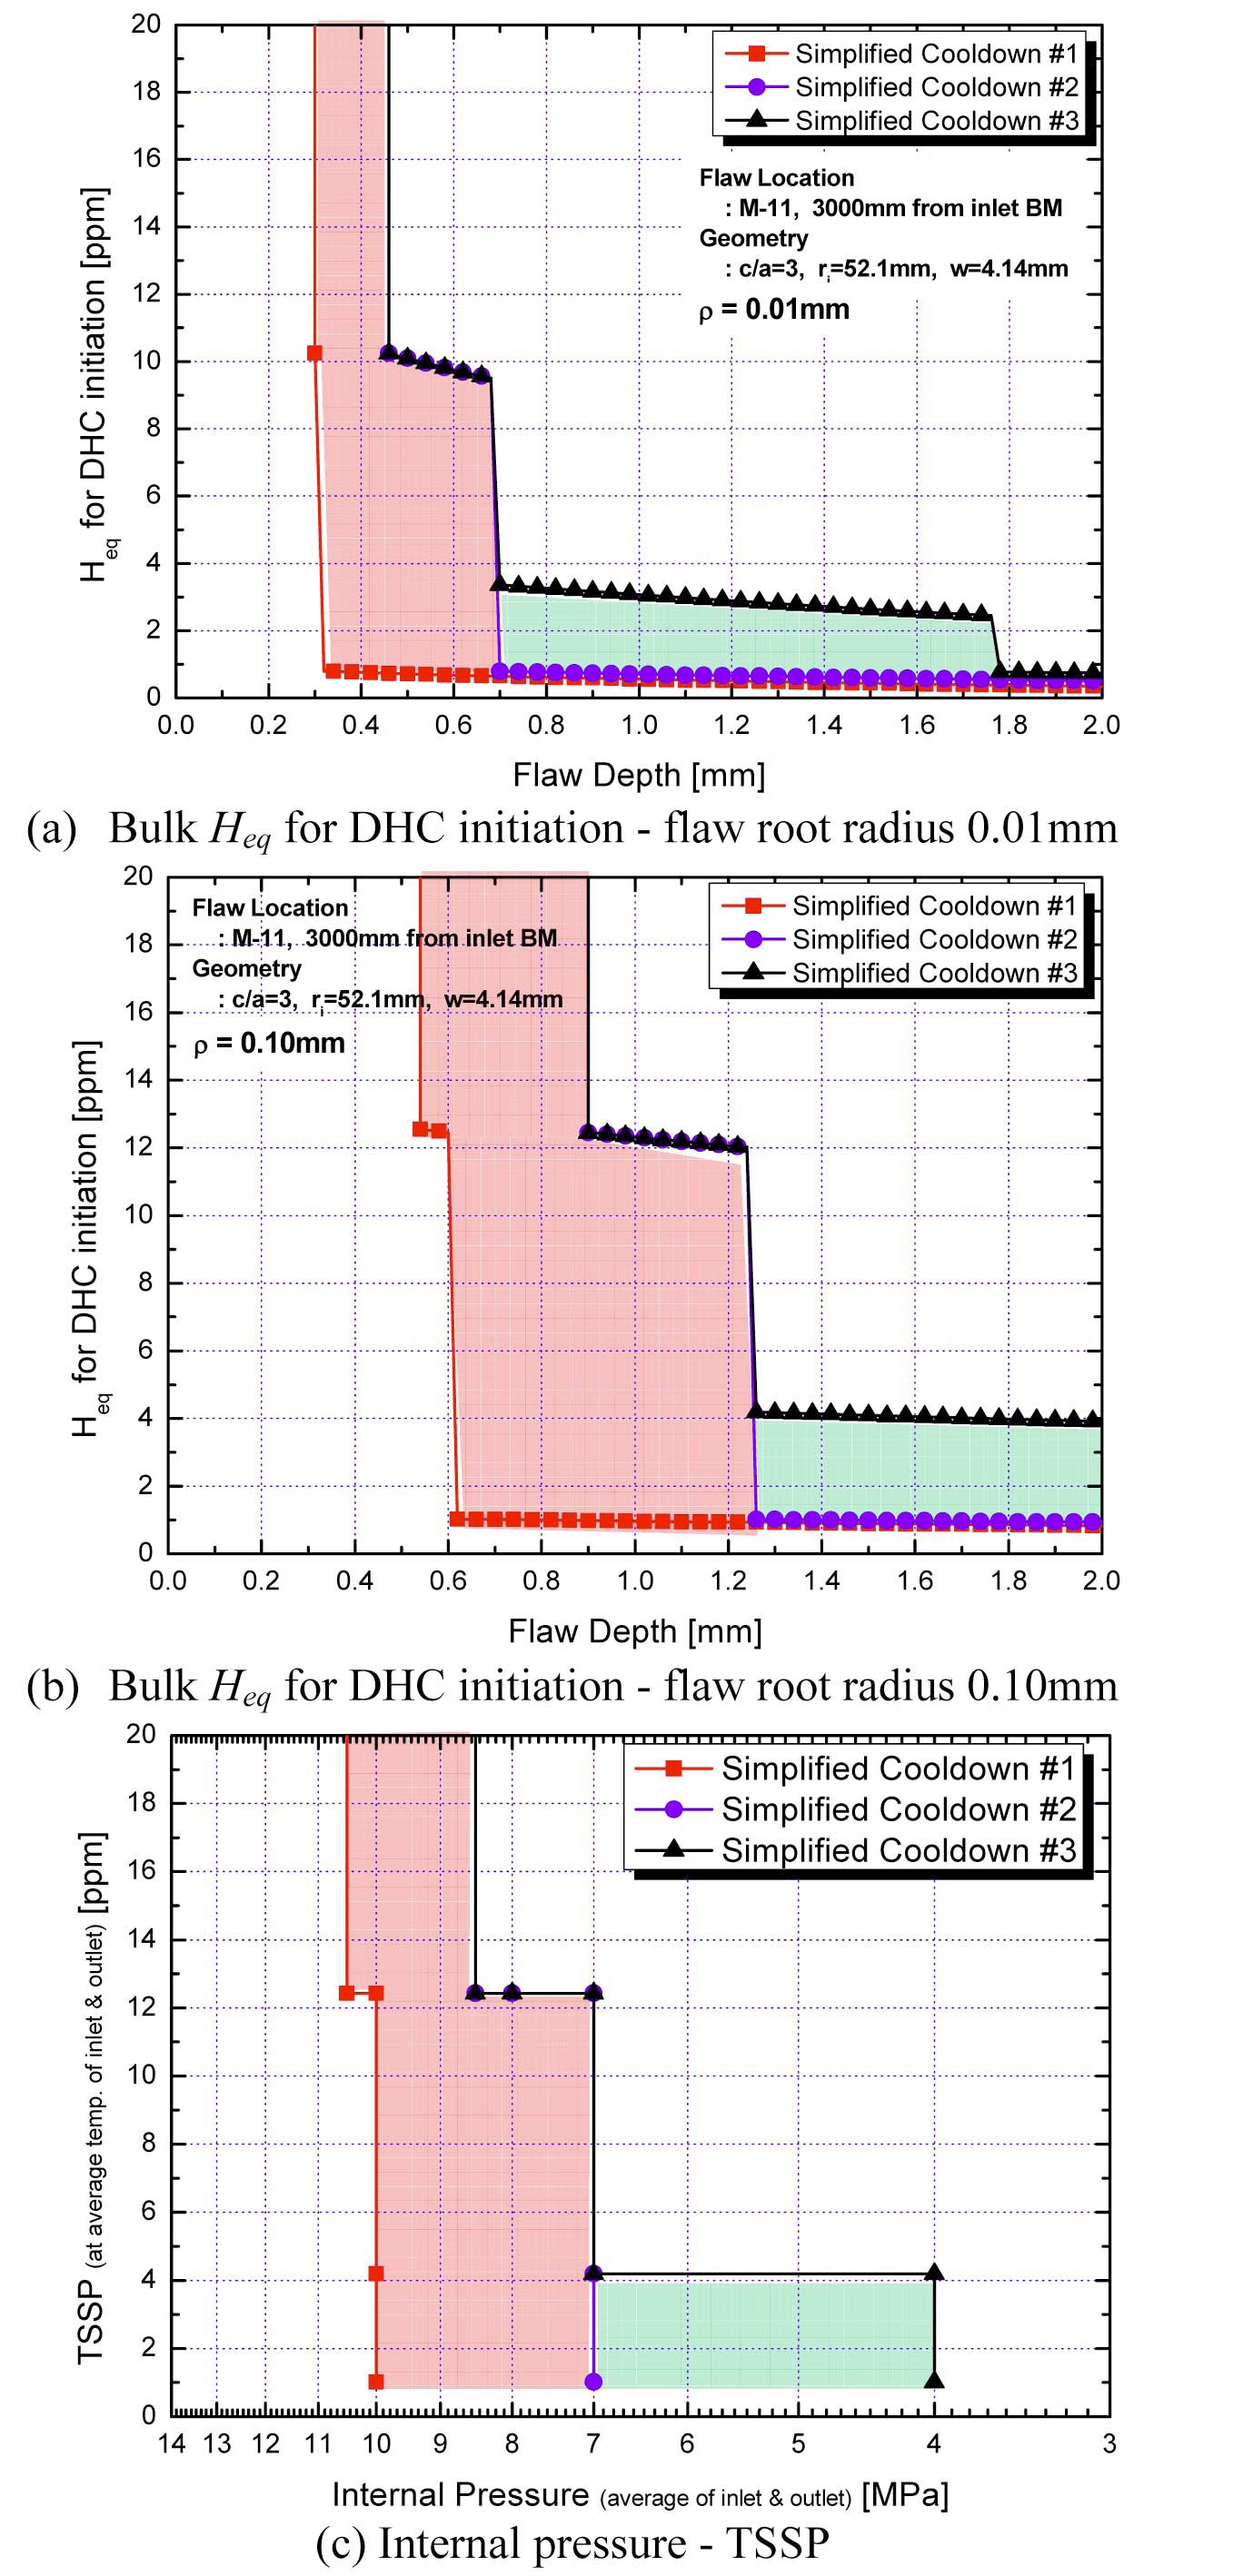
Characteristics of threshold bulk
Fig. 5 represents variation of the threshold bulk
Fig. 6(a) and 6(b) are to compare effects of three
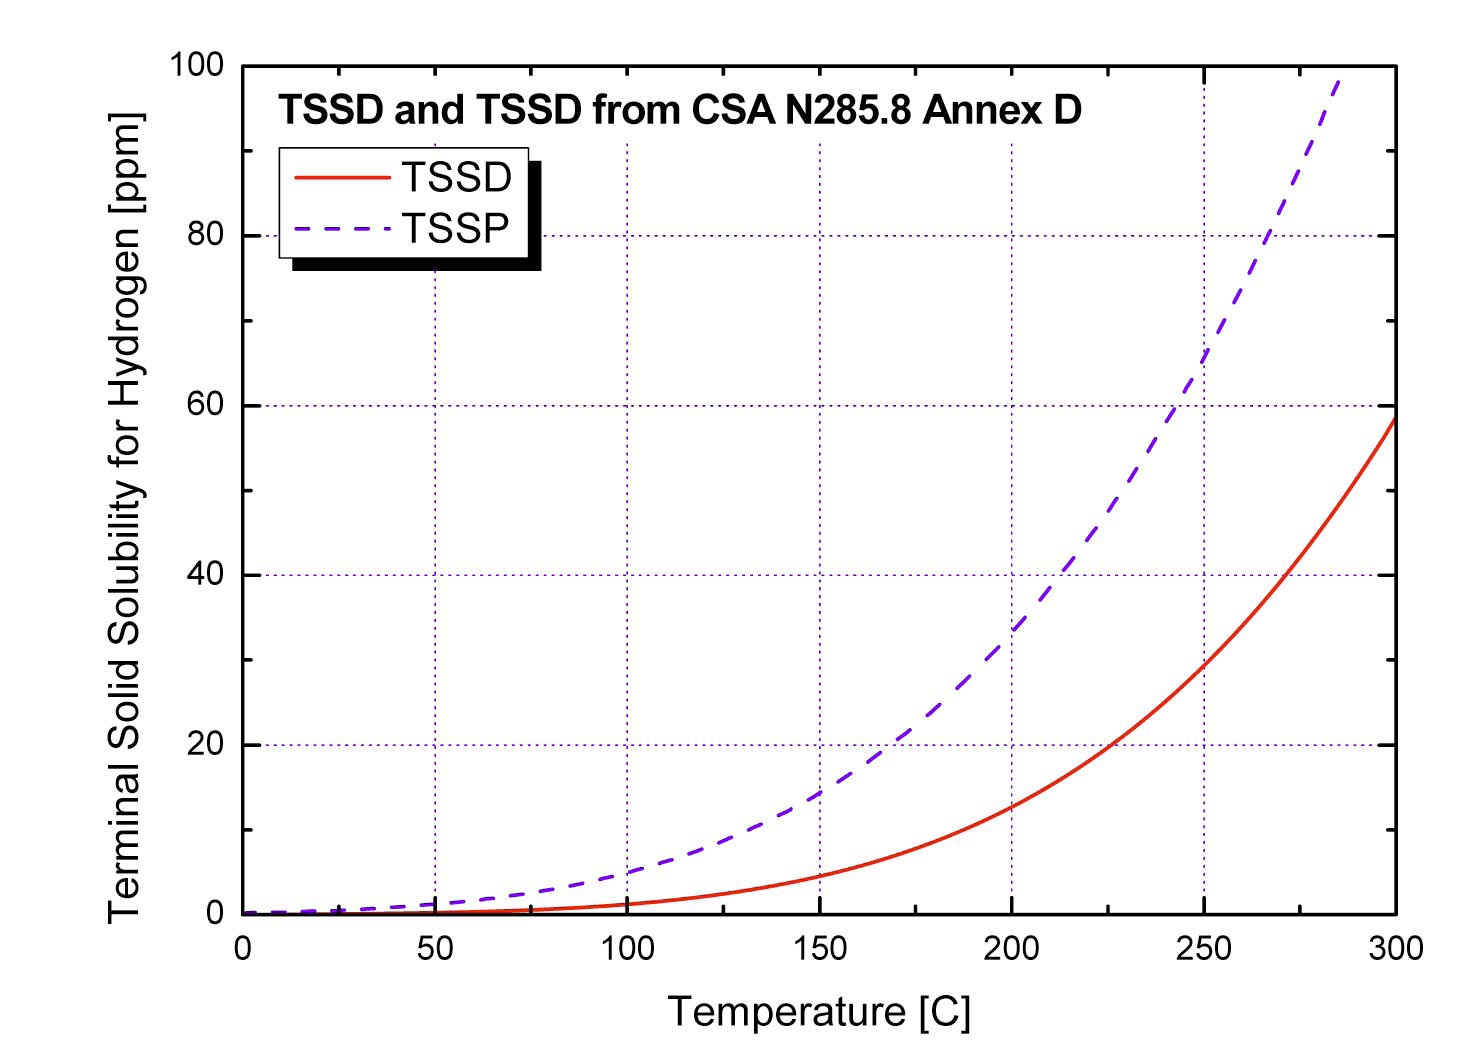
kinds of simplified cooldown transients on the DHC initiation when ρ=0.01mm and 0.10mm cases, respectively, in which differences among these transients are illustrated by shaded regions. It has to be recalled from Fig. 4(d) that three kinds of simplified cooldown transient are plotted on the internal pressure against temperature. By transforming the temperature of Fig. 4(d) to terminal solid solubility of hydride precipitation (TSSP) and exchanging x- and yaxes of the graph, we can make Fig. 6(c) that is similar to Fig. 6(a) and 6(b). Here, the TSSP is a kind of threshold
shows the relationship between TSSP and temperature presented in CSA N285.8, which is used in the evaluation.
The evaluation results can be interpreted that, at a certain bulk
4.3 DHC Growth under Simplified Cooldown Transients
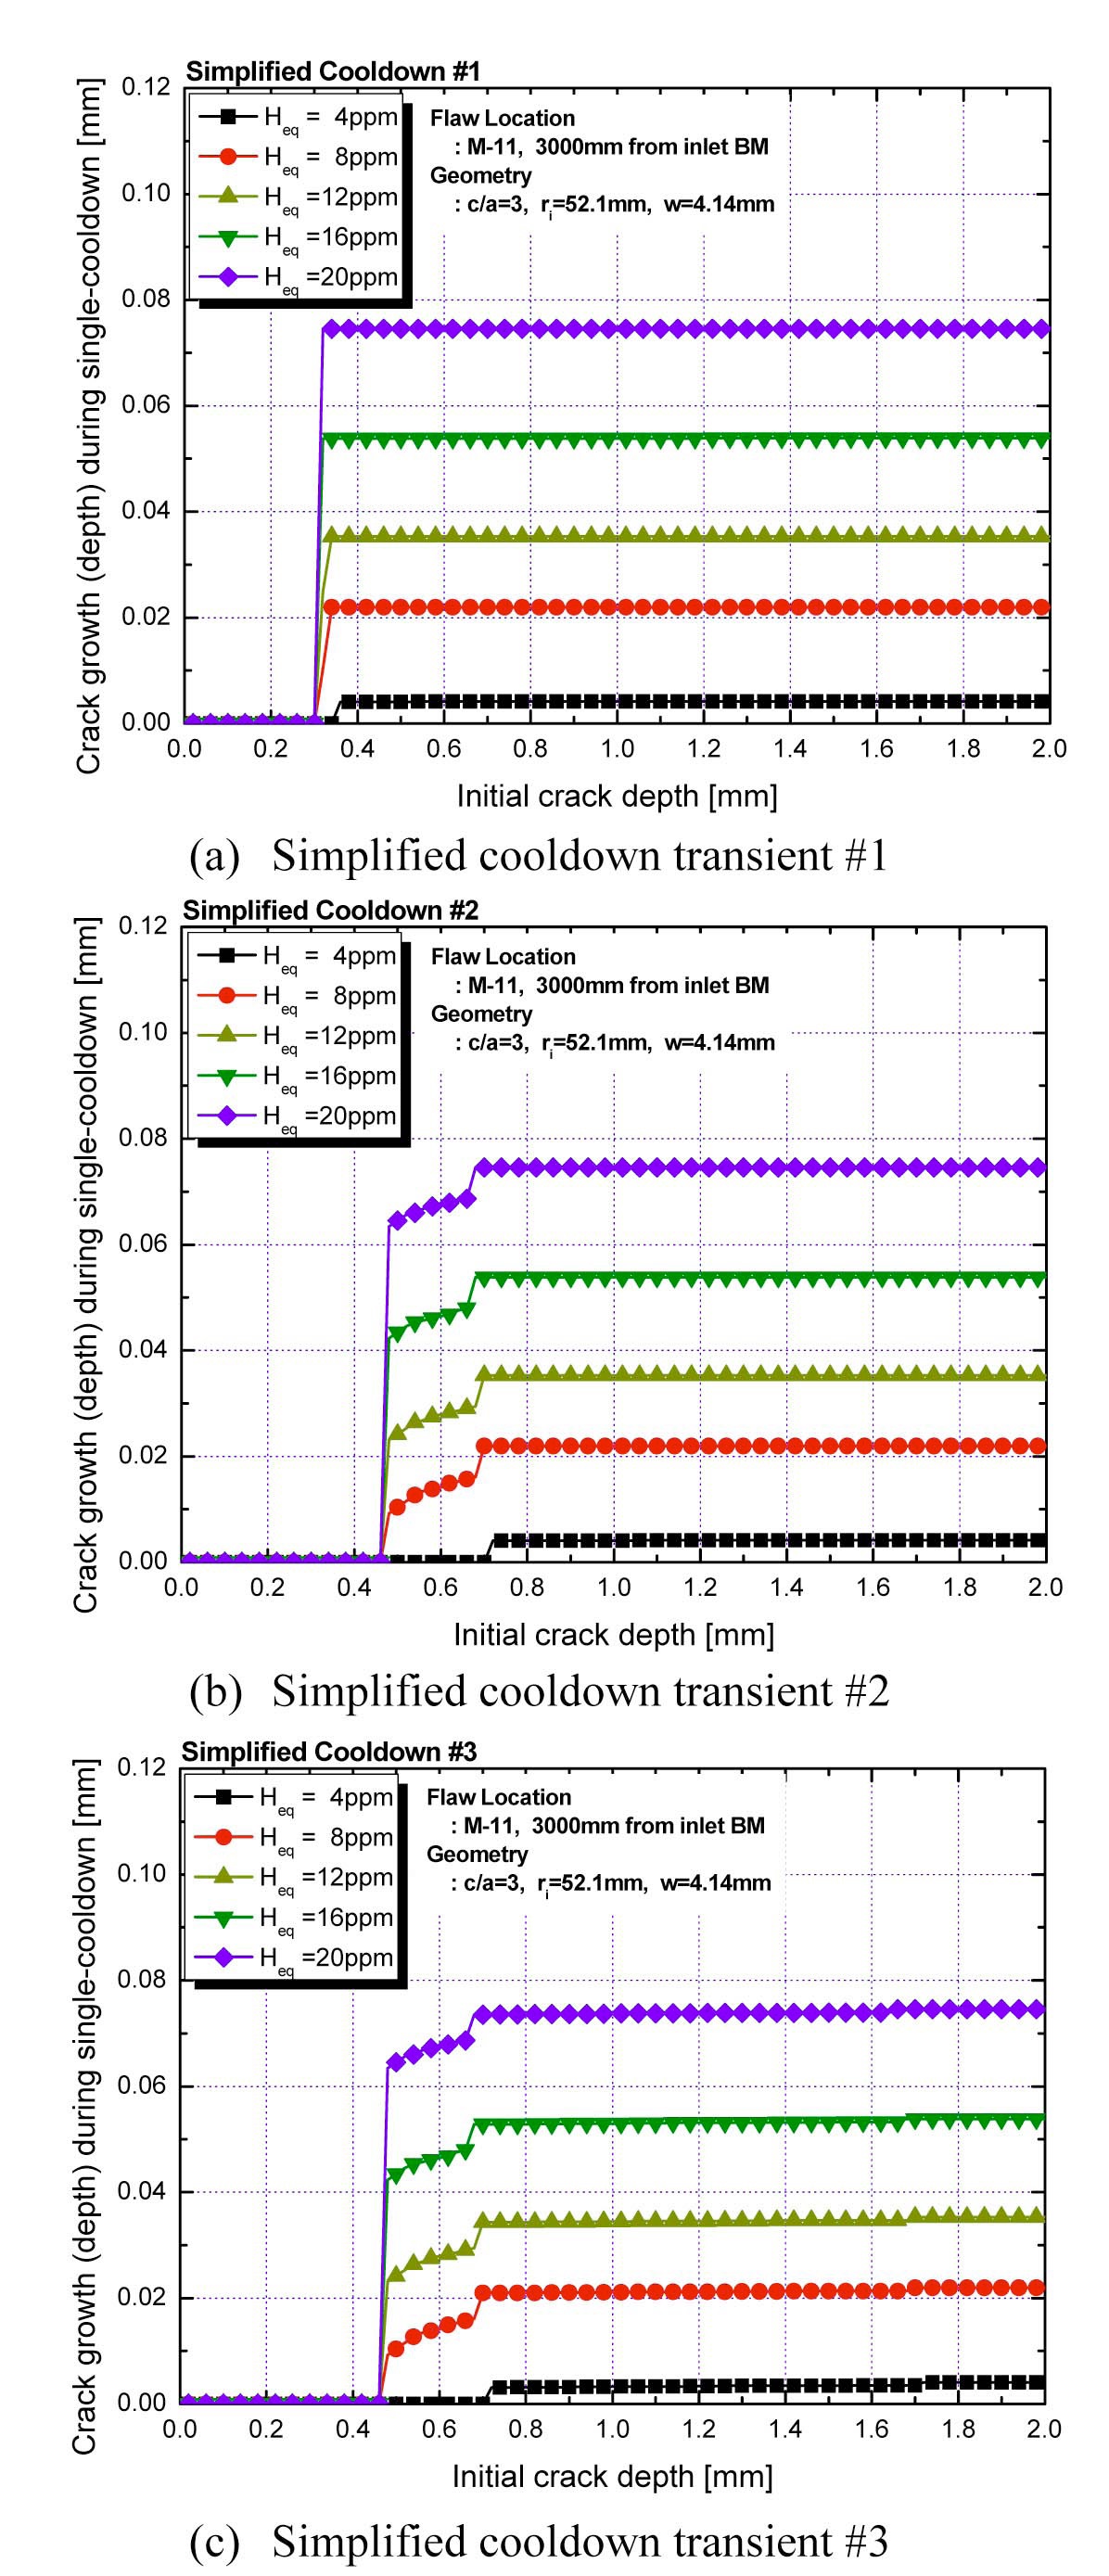
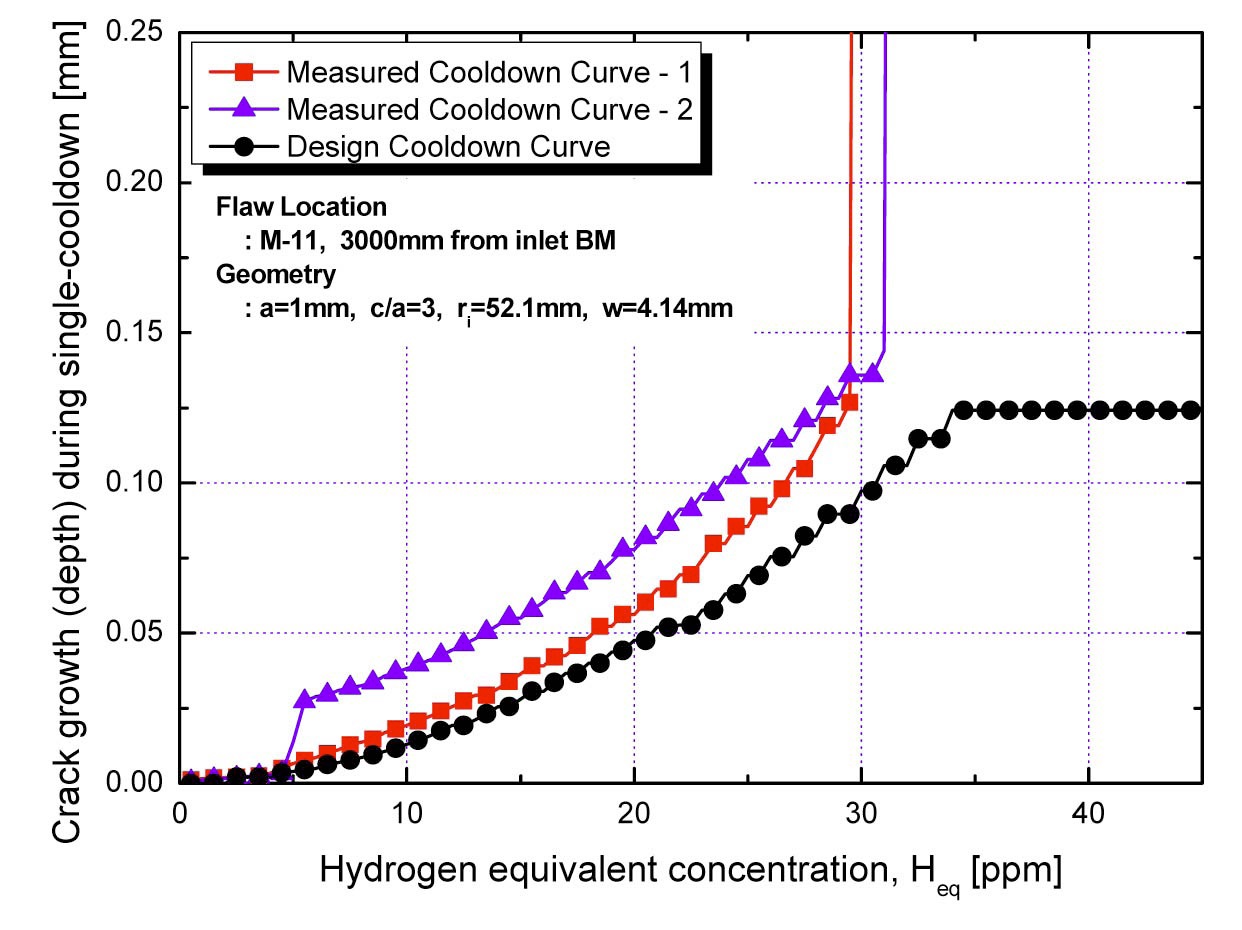
For investigating characteristics of flaw growth, the amount of DHC growth rates during single cooldown operation was calculated using the developed assessment program. Similar to the previous section, an initial crack was postulated at the center of a pressure tube at a high power channel under simplified hypothetical cooldown transient conditions. Also, in order to exclude unnecessary complications from diverse input parameters, changes of
Fig. 8 represents variation of the DHC growth rates against the initial crack depth with different
Fig. 9 represents variation of the DHC growth during single cooldown operation against bulk
amount of DHC growth increases gradually according to the increasing bulk
Especially, the amount of crack growth abruptly increases when the bulk
induces large increment of the DHC growth period, about 15 minutes in Region-2, which phenomenon is graphically illustrated in Fig. 9(c).
A similar trend is observed in the region with the
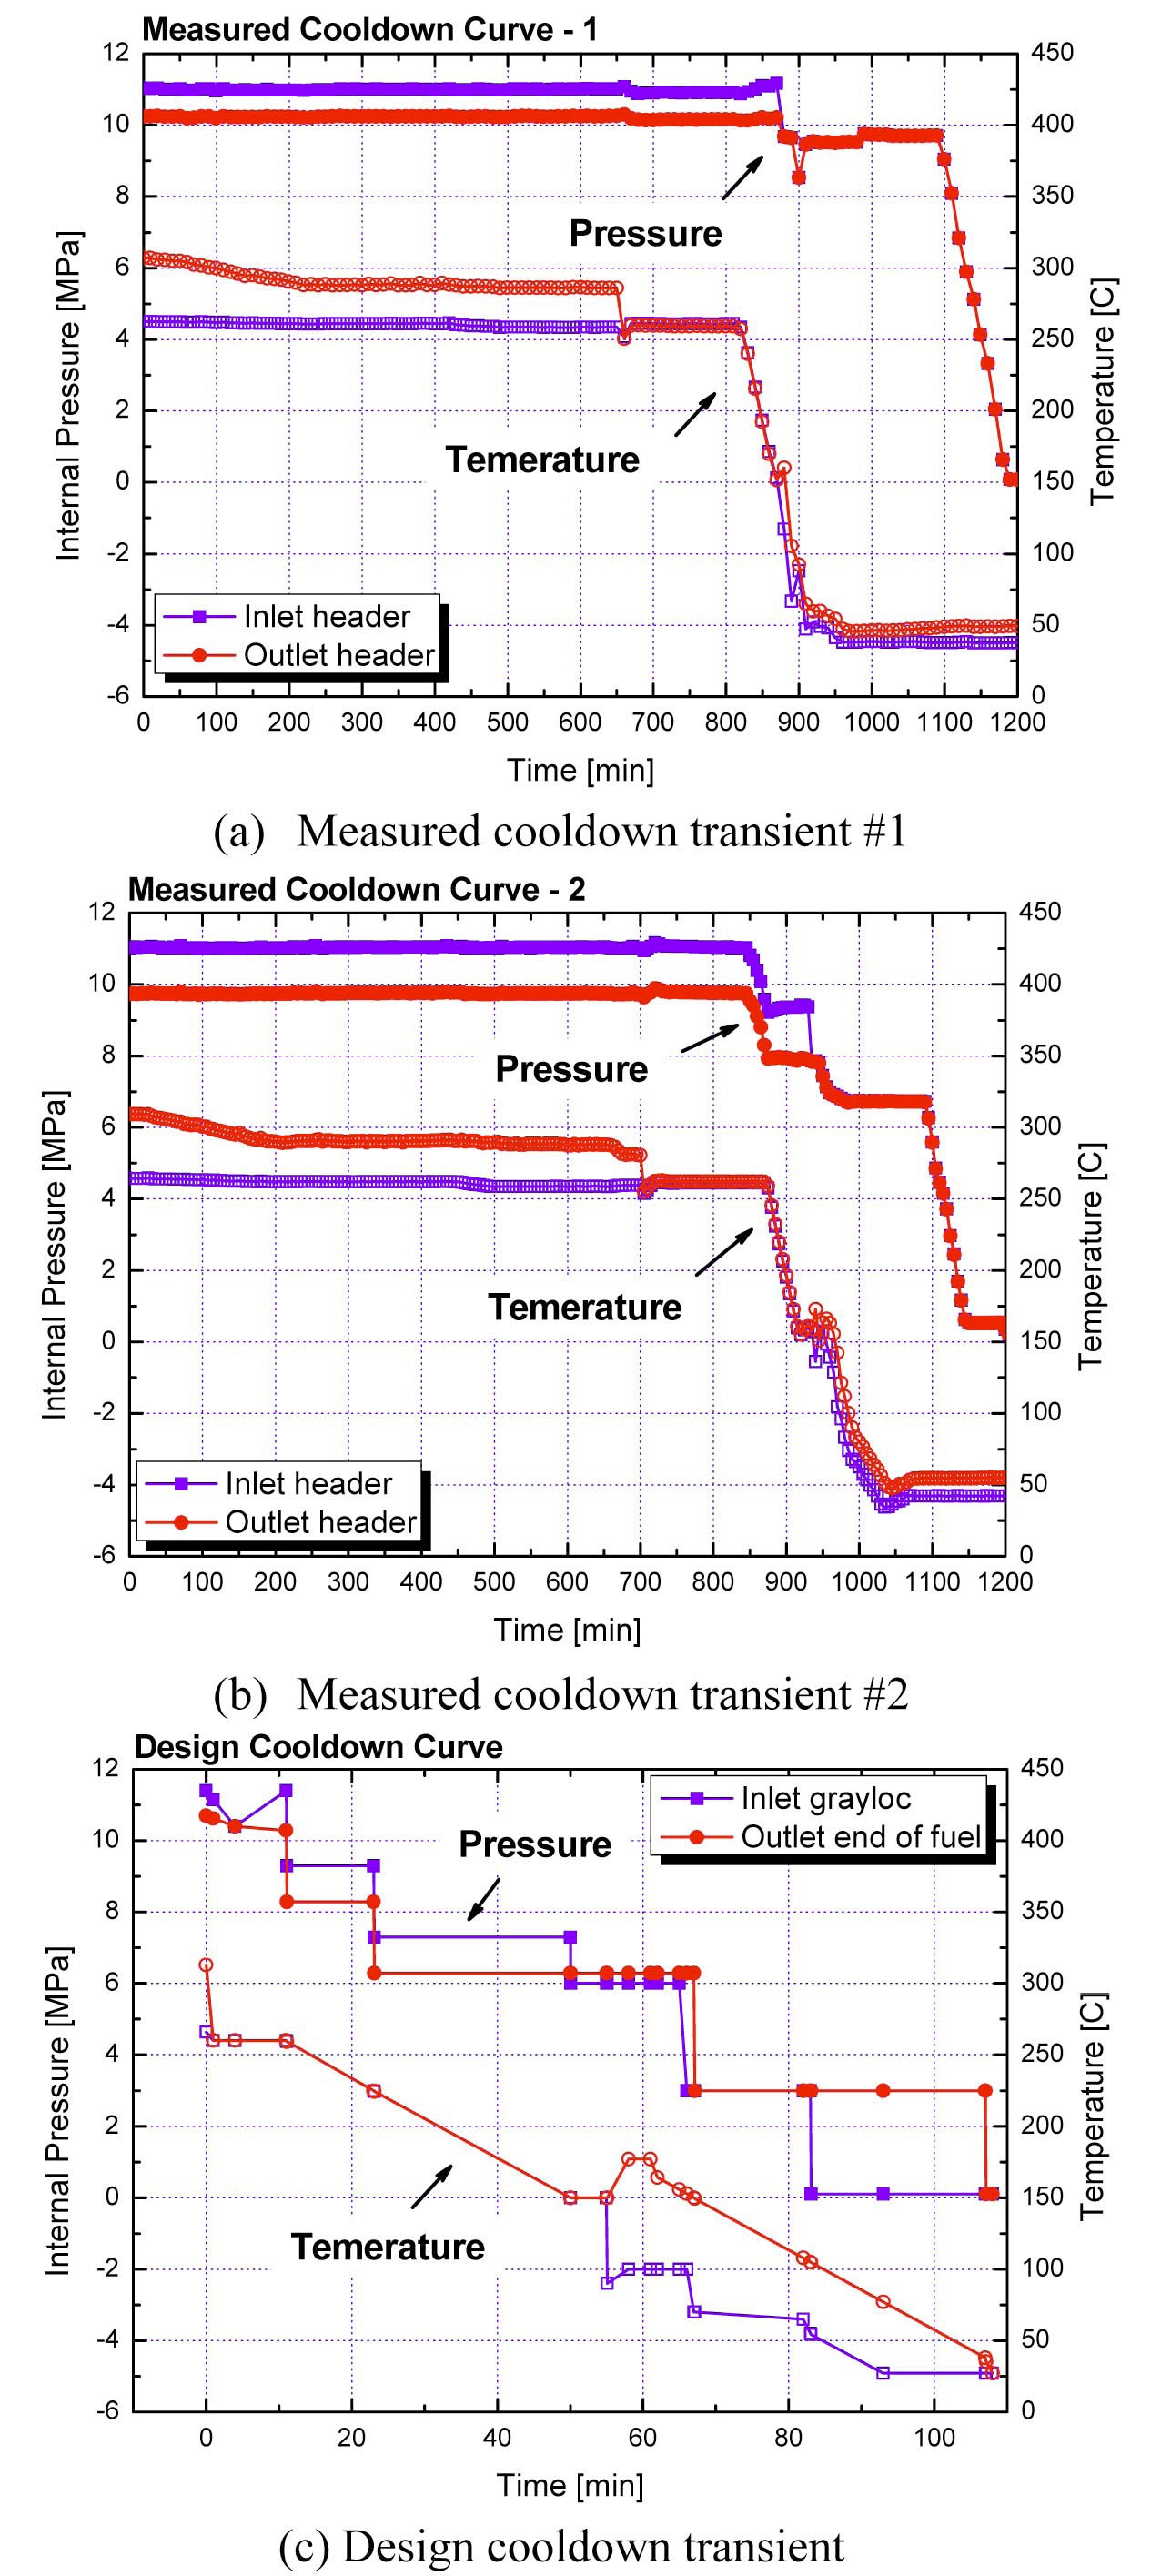
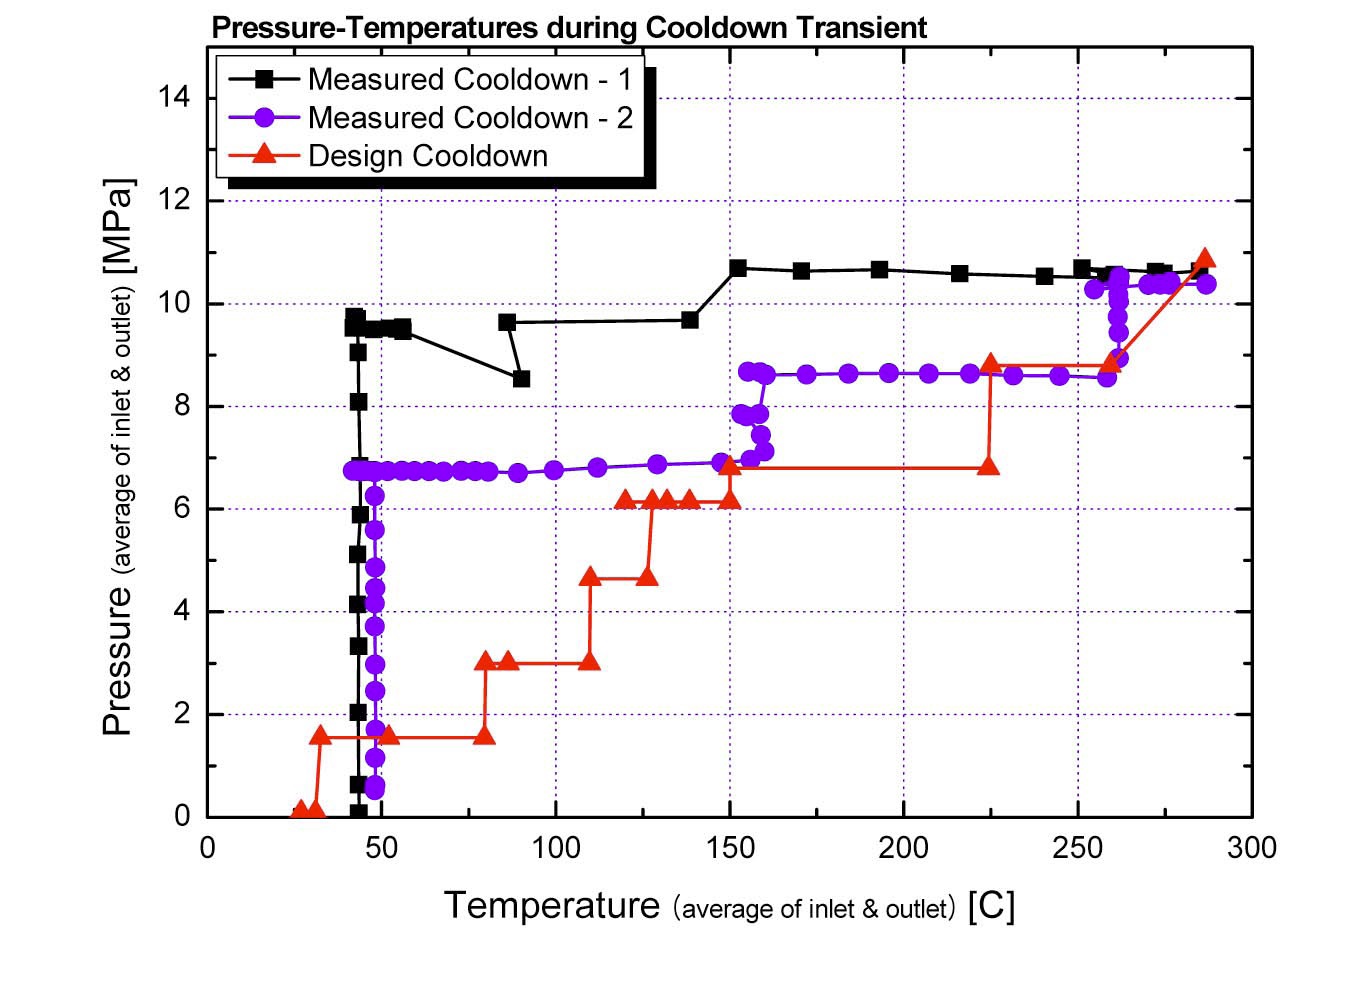
4.4 DHC Behaviors under Plant Cooldown Transients
In the previous sections, effects of the initial flaw size and
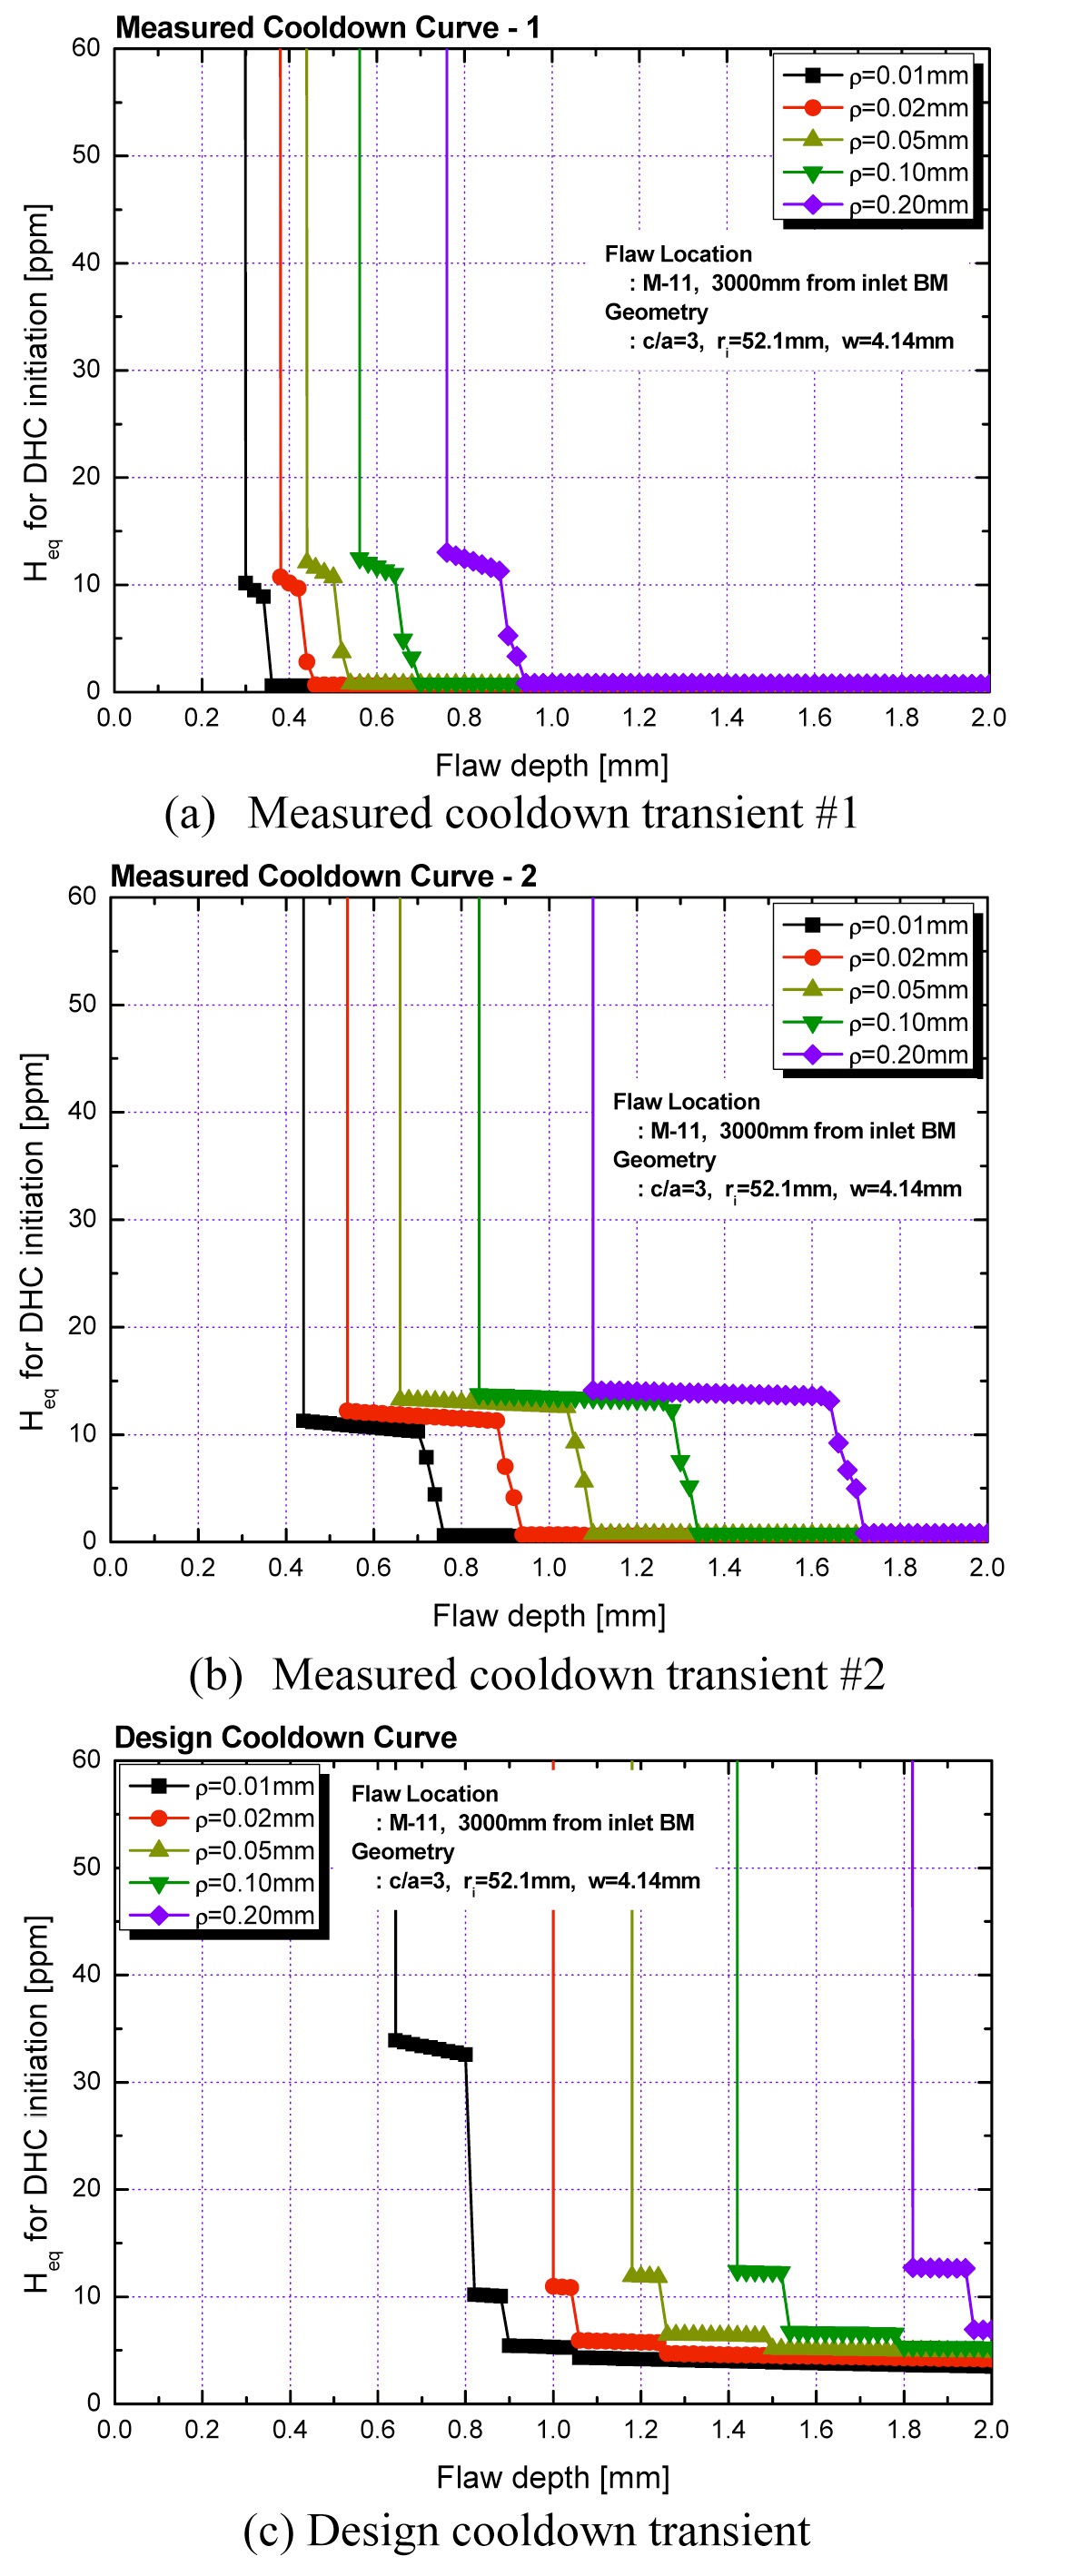
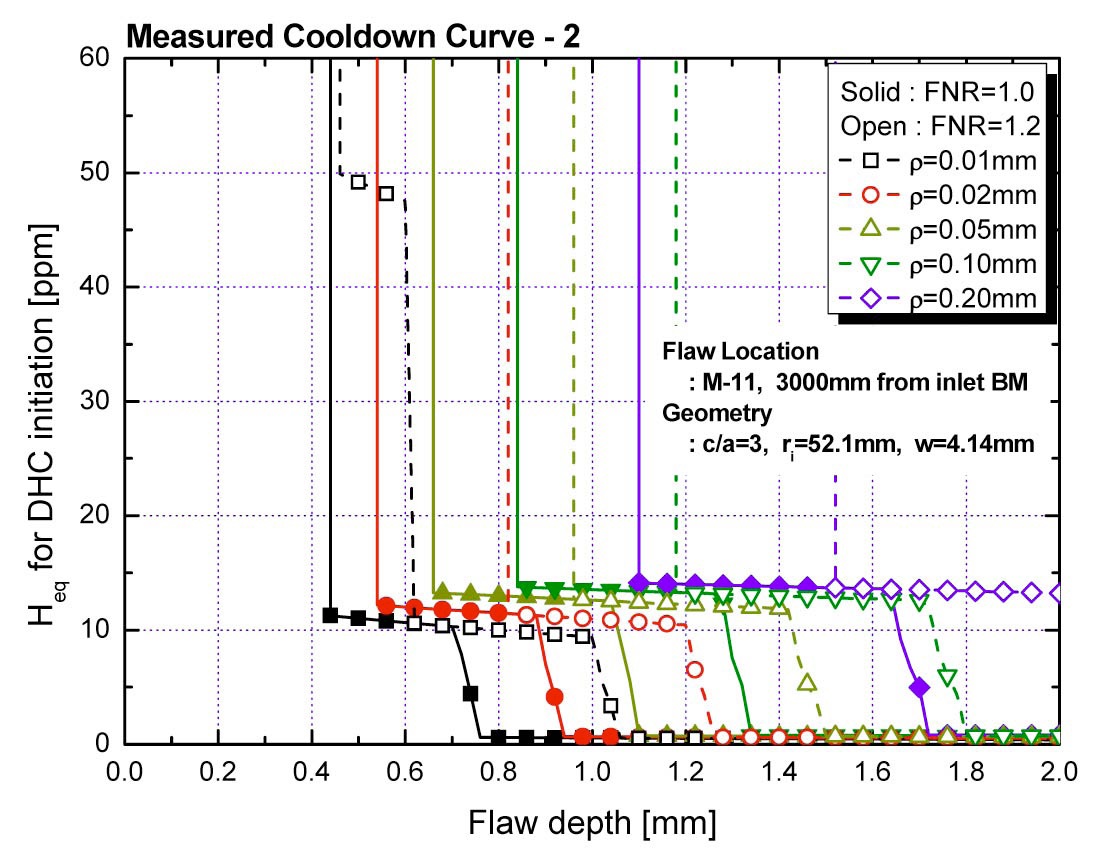
Fig. 12 shows characteristics of the bulk
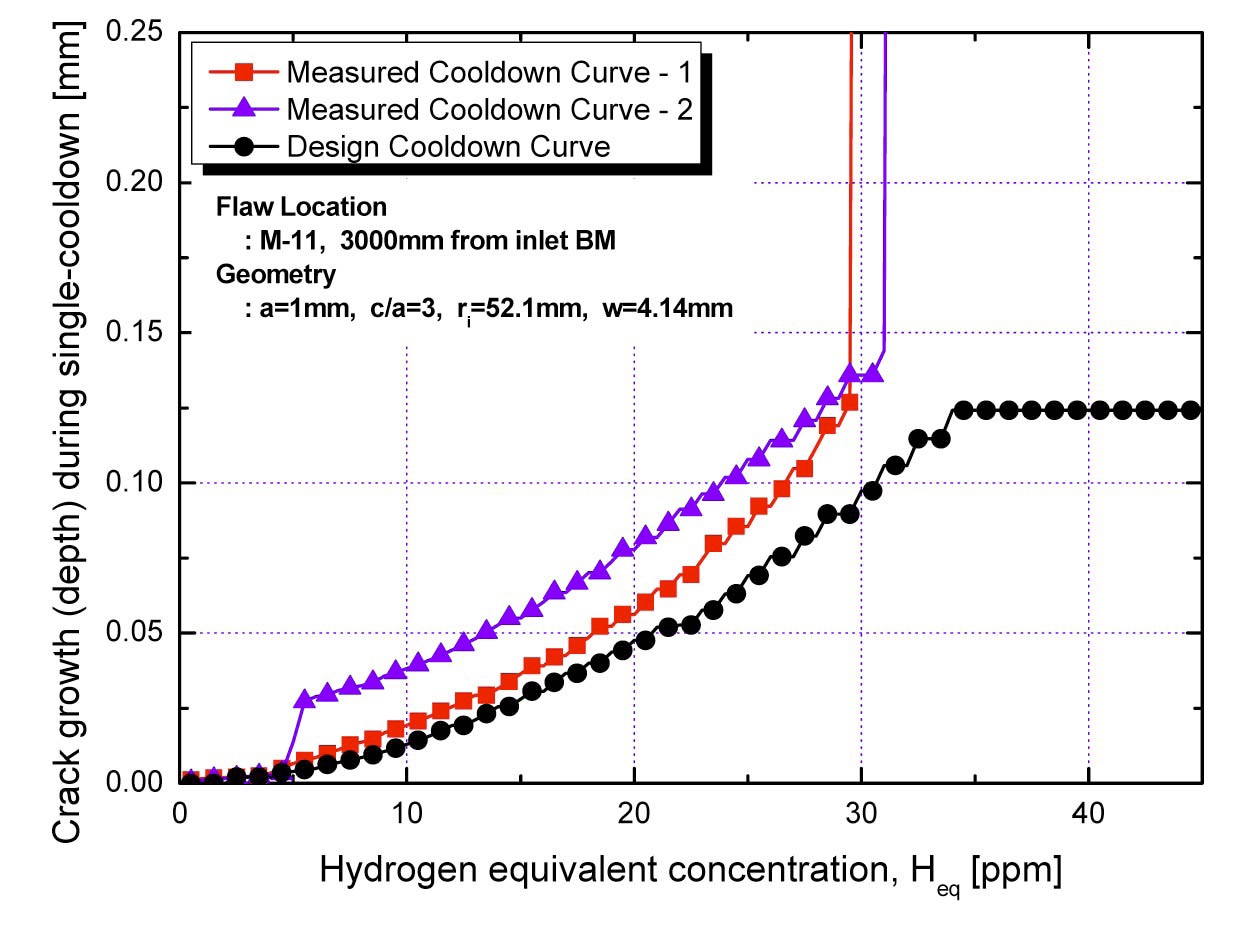
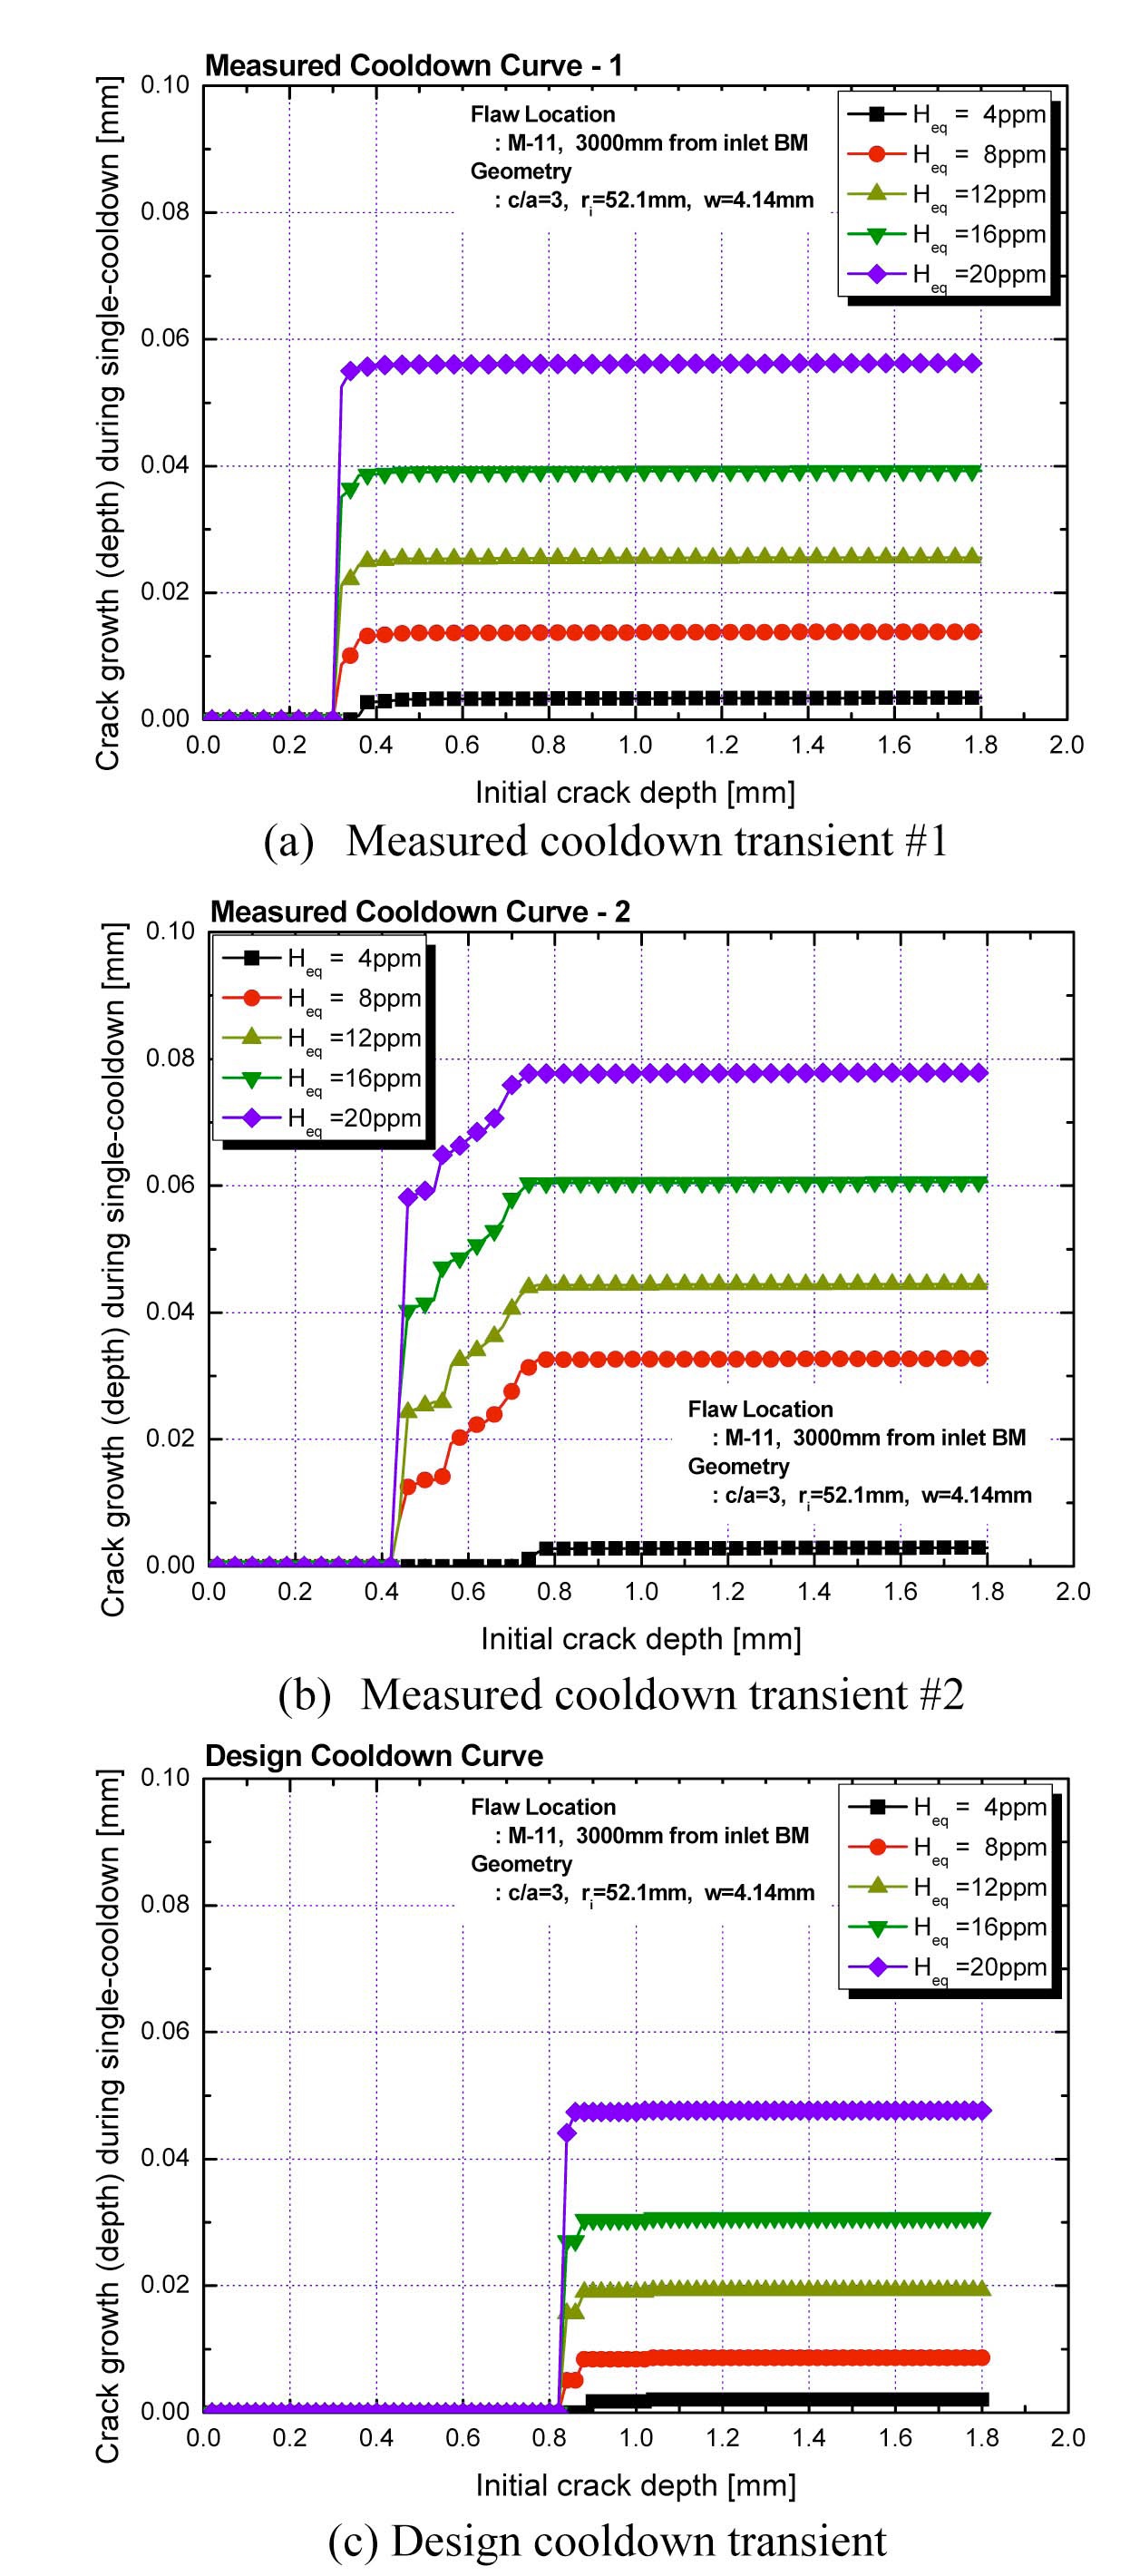
Fig. 14 shows characteristics of the DHC growth by single cooldown operation. In this figure, depressurized transients increase the threshold crack depth for DHC growth. However, when the initial crack is deeper than 0.9mm, early depressurization effects are disappeared. In
case of the measured cooldown transient #2 with two-step depressurization, the crack growth rate is greater than that of the measured cooldown transient #1 as shown in Fig. 15. This DHC growth behavior can be interpreted as the increased crack growth period effect according to the decrease of average cooldown rate, i.e. the increased period at high temperature during a cooldown, instead of the depressurization effect. It is also supported by the evaluation results depicted in Fig. 9, in which the pressure reduction effect is not observed under the simplified hypothetical cooldown transients having the same cooldown rate. Therefore, it can be summarized that the early depressurization can contribute to the increase of the threshold initial crack size for the DHC growth under the cooldown transient
and rapid cooling from high temperature is effective to reduce the amount of DHC growth during a cooldown operation.
5. EFFECTS OF HEATUP OPERATION SCENARIO
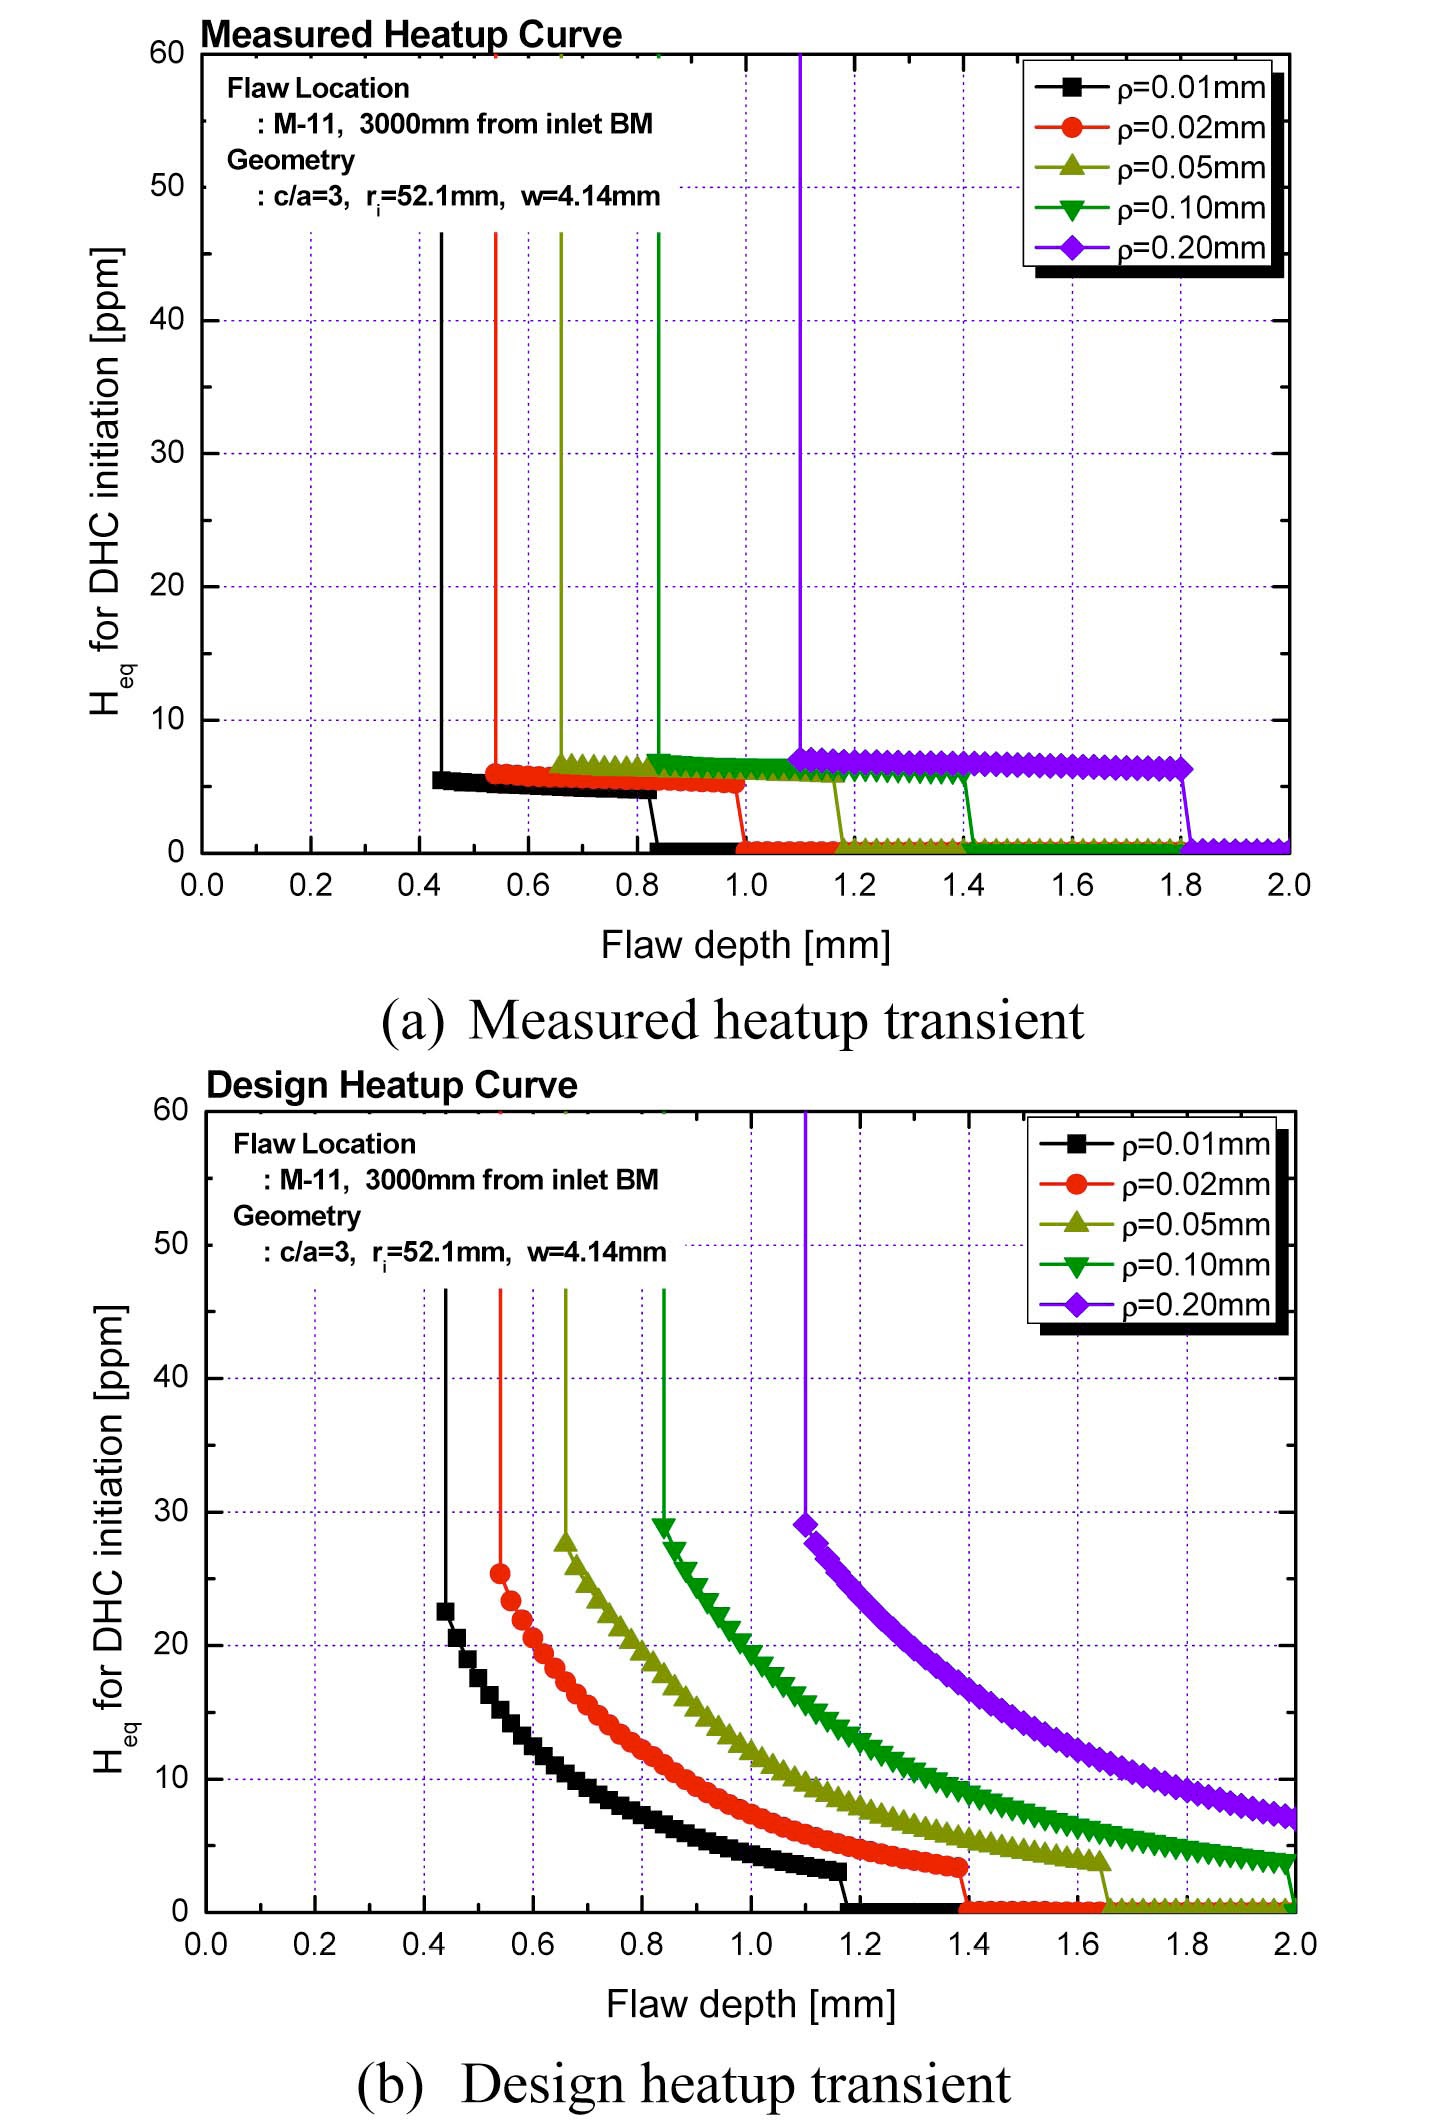
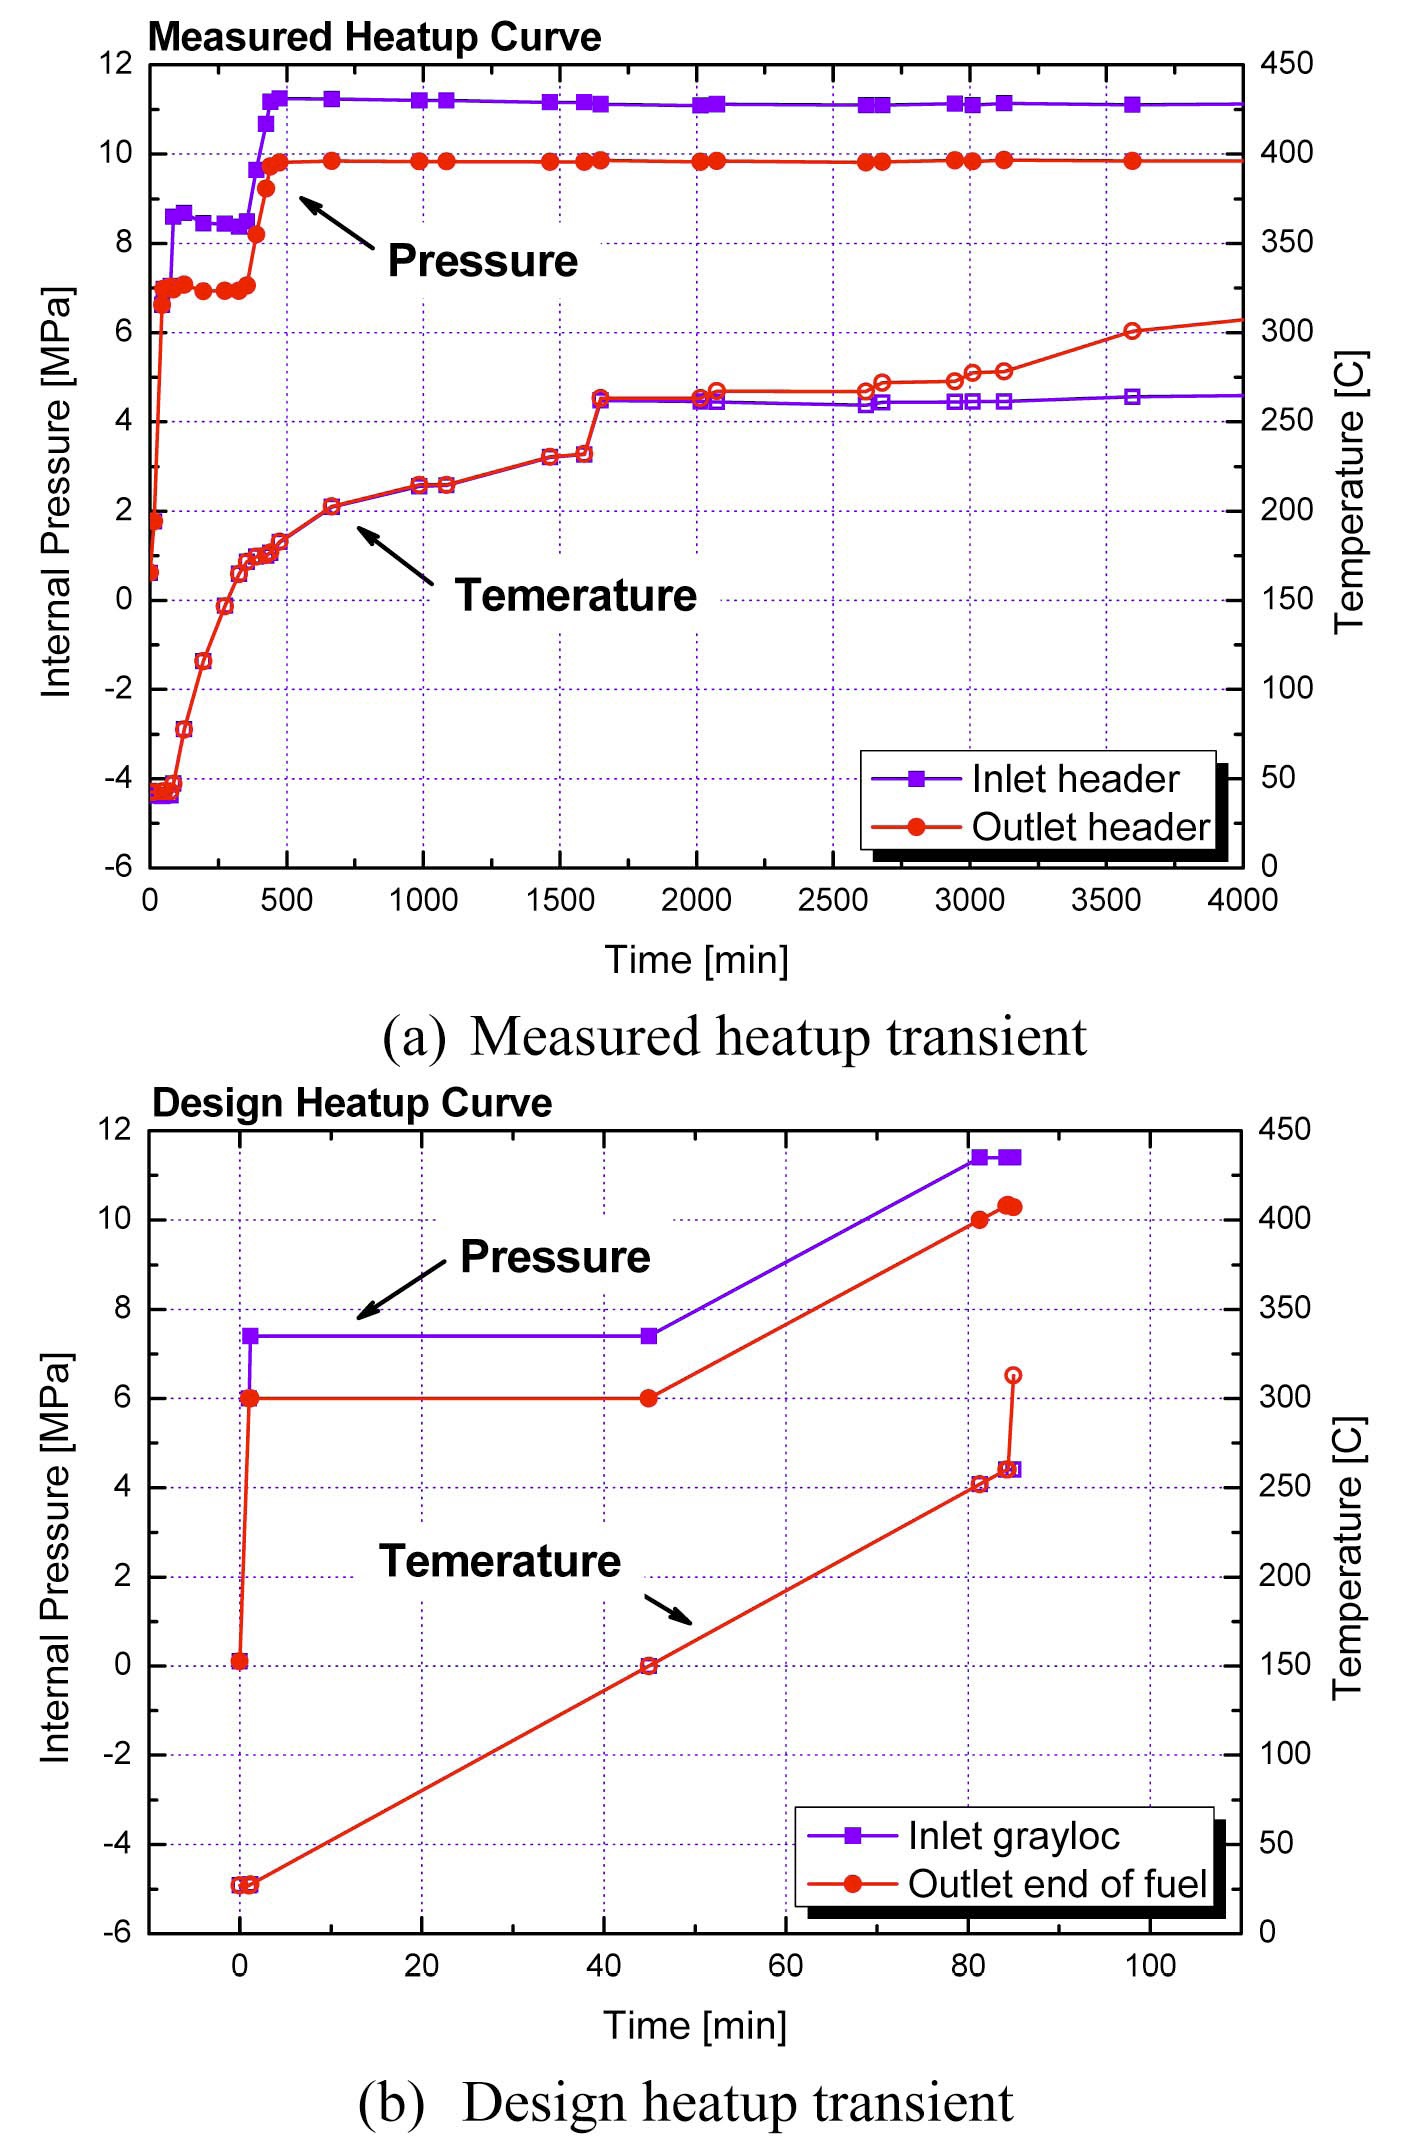
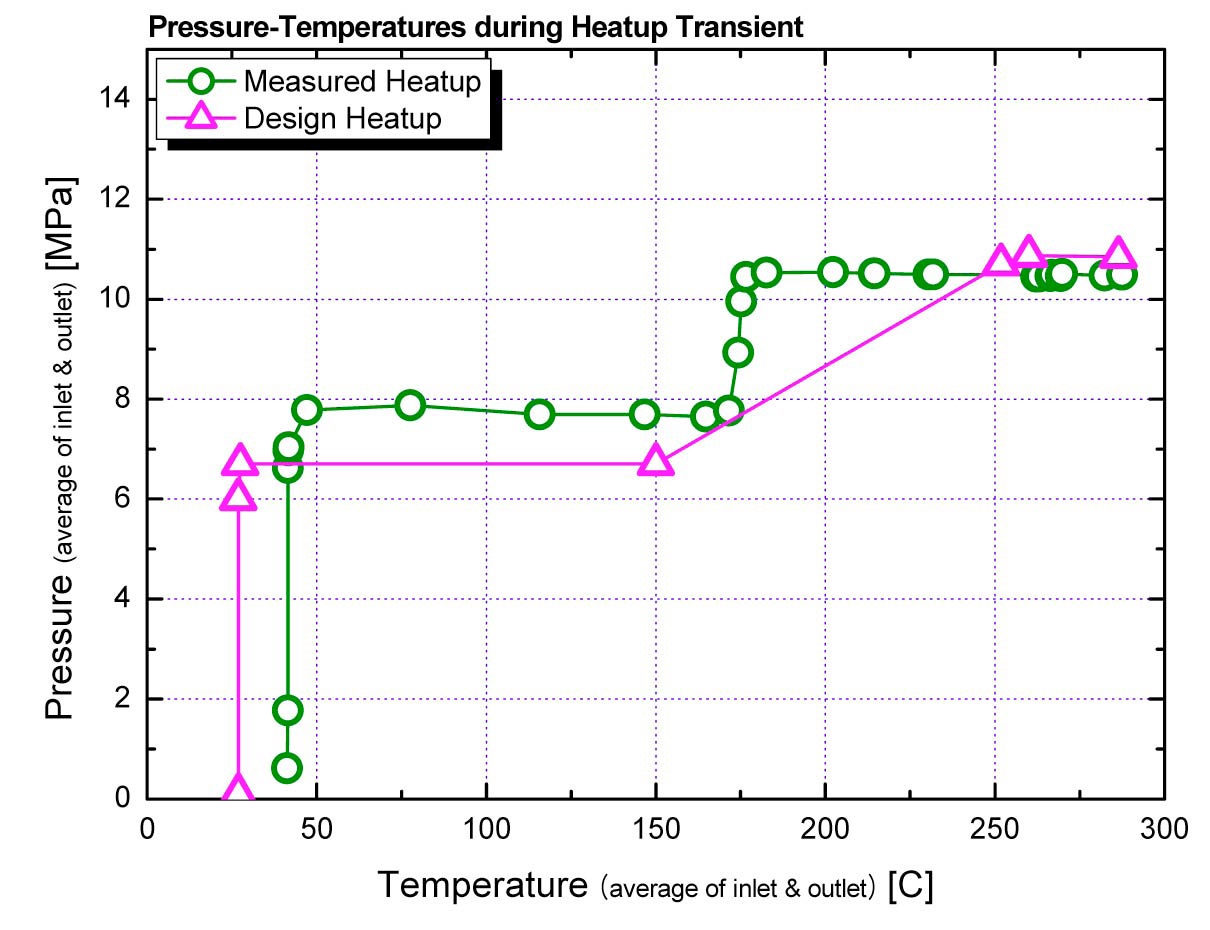
While the DHC growth has been evaluated under the normal and cooldown operating conditions, in case of the DHC initiation, heatup operation should also be considered. As illustrated in Fig. 2, the DHC initiation under the heatup operation can be evaluated by using the process-zone evaluation procedure or the hydrided region overload evaluation procedure. However, since details of the latter procedure are not established yet but the former procedure is available from CSA N285.8, characteristics related to the DHC initiation were examined in this section based on the process-zone evaluation procedure. Fig. 16 represents two kinds of heatup transients; the one in Fig. 16(a) is measured from a Korean PHWR plant[10] and the other in Fig. 16(b) is extracted from a design stress report of the same plant[11]. These plant heatup transients were translated into the corresponding pressure-temperature curves as shown in Fig. 17. Here, the pressure in the design stress report is lower than the measured one for a given temperature.
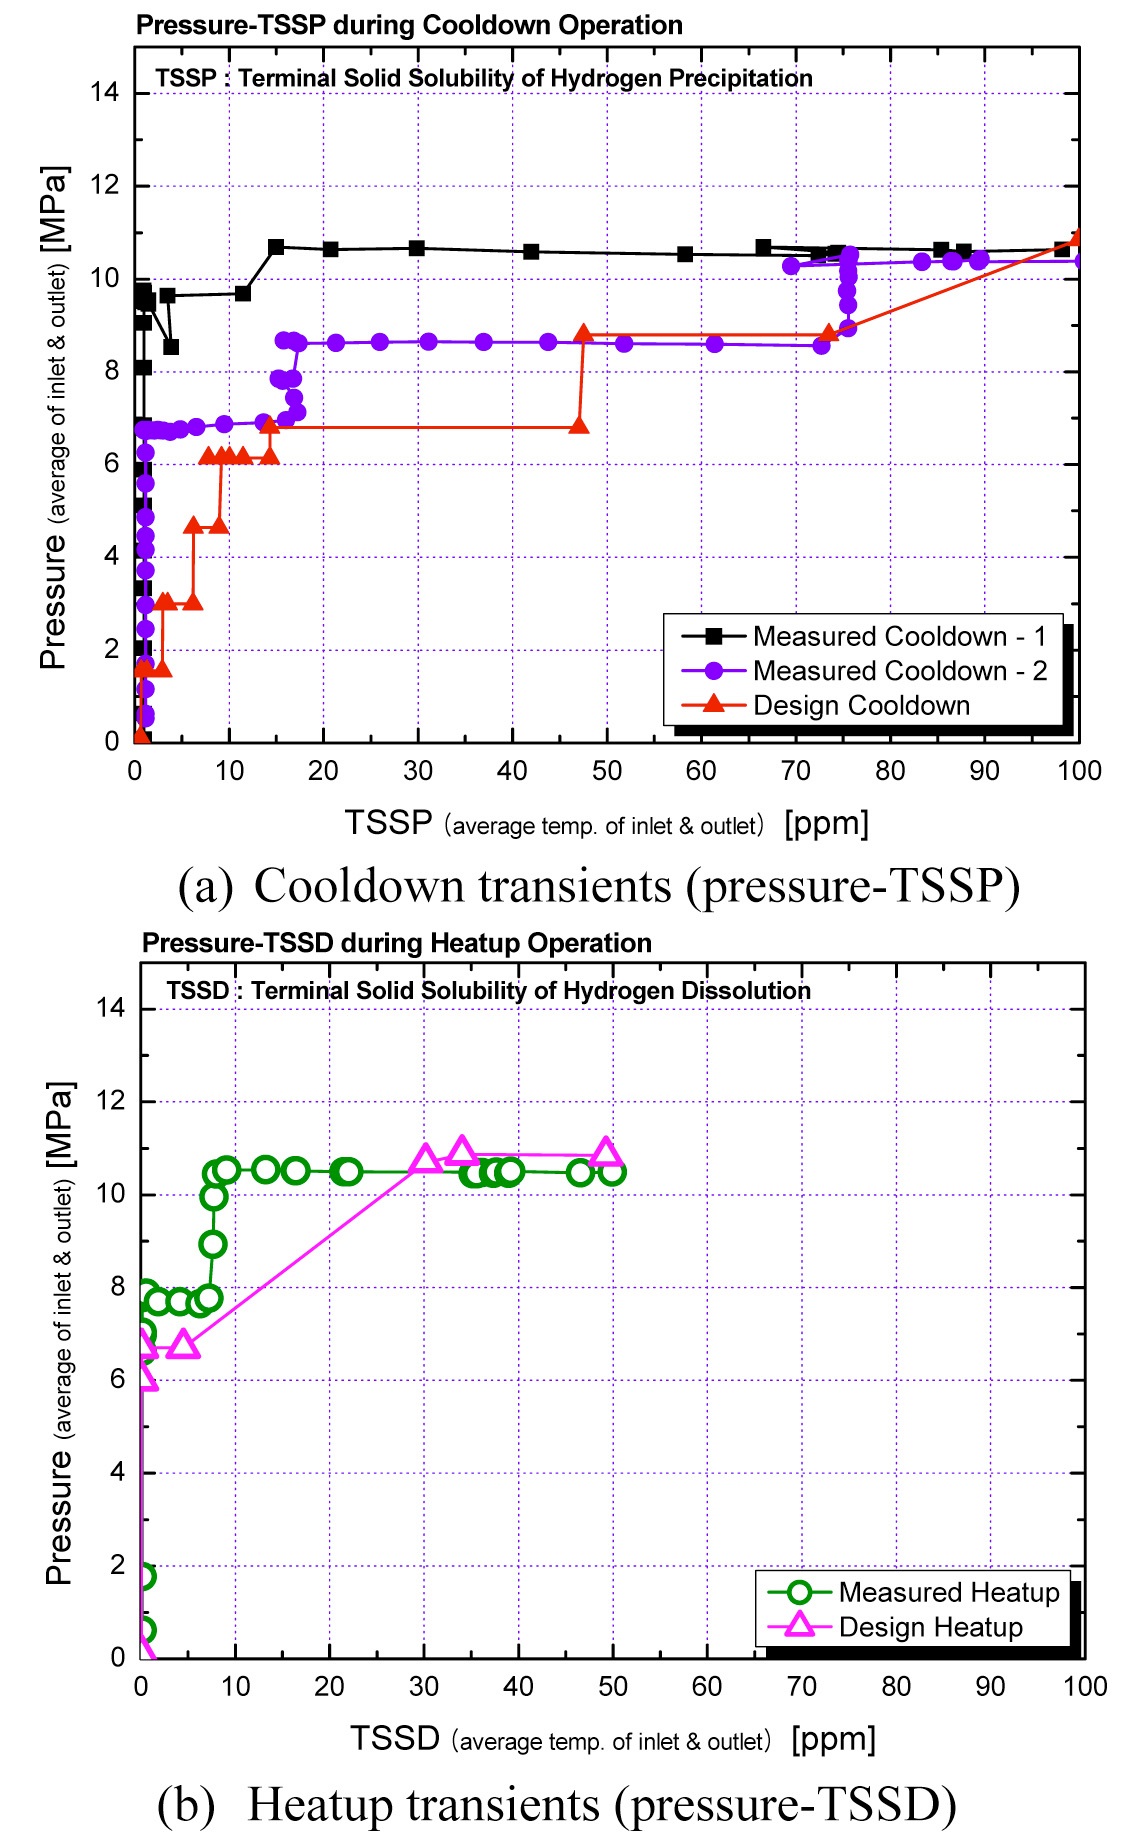
CSA N285.8 recommends that evaluation of hydride existing conditions during heatup transients have to be based on the TSSD instead of the TSSP. This is because pressure tube materials have undergone a dissolution process due to the increase in temperature, when the hydrides precipitate, during the heatup operation. Therefore, the pressure-TSSP curve in Fig. 7 to represent the DHC initiation characteristics during the cooldown operation should be converted to the pressure-TSSD curve during the heatup operation. Fig. 18 compares the pressure-TSSP curves during the cooldown operation and pressure- TSSD curves during heatup operation. From the figure, it is anticipated that the measured heatup curve evaluates the
DHC initiation at lower hydrogen equivalent concentration than the measured cooldown transient #2 curve.
Fig. 19 represents the threshold bulk
specimens during specimen heating as compared with specimen cooling. So, the DHC initiation evaluation by using the process-zone evaluation procedure is thought to be overly conservative. In this context, the hydrided region overload evaluation procedure[14-17] being developed may be more appropriate to derive meaningful results on the DHC initiation under the heatup transient and upset condition in the future.
6. DISCUSSION ON COOLDOWN OPERATION PROCEDURE
Except for early PHWR reactors, the initial hydrogen concentration of the pressure tubes is about 2~6ppm, and the increasing rate of
(1) Depressurization during cooldown operation can contribute to reducing DHC risks but it must not cause diminishment of the reactor stability. For example, the depressurization under lower temperature than 100℃ is not effective to reduce the DHC risk. Depressurization with a temperature higher than 150℃ is more effective to reduce the DHC risk, especially for the pressure tubes which have higher Heq. Figs. 5(a) and 7 can be used for determining most effective depressurization temperature taking into account plant specific Heq.
(2) Rapid cooling from high temperature is effective to reduce the amount of DHC growth during a cooldown operation. The cooling rate must not be higher than the limit value from original design specification or operating procedure of the plant.
In addition, a probabilistic assessment program for pressure tube flaw integrity is being developed based on the present study. It is expected that, in the near future, effective cooldown procedures can be deduced from probabilistic assessment techniques and plant specific quantitative analyses for reduced DHC risks depending on cooldown operating scenarios.
In this research, a deterministic DHC evaluation program was developed based on CSA N285.8 procedure prior to expanded probabilistic damage frequency assessment. It was used for systematic structural integrity assessment of the pressure tubes with a volumetric flaw, from which the following conclusions were made.
(1) The DHC initiation time of volumetric flaws is mainly dependent on the flaw size, radius at the flaw-tip, initial hydrogen equivalent concentration, deuterium uptake rate (Heq rate), cooldown and heatup operation scenarios. The effect of the pressure tube deformation was relatively insignificant.
(2) The DHC can be initiated earlier for sharper flaw, deeper flaw and higher Heq.
(3) The DHC initiation can be roughly estimated by using the pressure-TSSP curve translated from the cooldown operation curve.
(4) The DHC initiation and subsequent growth can be mitigated through a cooldown operation with depressurization at higher temperature. However, this beneficial effect disappeared when the initial crack was large enough to cause the crack growth.
(5) Application of the process-zone evaluation procedure led to overly conservative results during the heatup process.
(6) Brief recommendations to reduced DHC risks were derived from deterministic evaluation results. Further specific recommendations can be deduced based on probabilistic assessment techniques, which will be reported for the next step of this study.