Thermal stratification has continuously caused several piping failures in nuclear power plants since the early 1980s. However, this critical thermal effect was not considered when the old nuclear power plants were designed. Therefore, it is urgent to evaluate this unexpected thermal effect on the structural integrity of piping systems. In this paper, the thermal effects of stratified flow in two different safety injection piping systems were investigated by using a coupled CFD-FE method. Since stratified flow is generally generated by turbulent penetration and/or valve leakage, thermal stress analyses as well as CFD analyses were carried out considering these two primary causes. Numerical results show that the most critical factor governing thermal stratification is valve leakage and that temperature distribution significantly changes according to the leakage path. In particular, in-leakage has a high possibility of causing considerable structural problems in RCS piping.
Excessive thermal stresses that can be generated by thermal stratification have caused severe piping failures in nuclear power plants since the early 1980s. This type of failure is becoming a world-wide problem and will become more wide spread as more experience is accumulated in the operation of existing nuclear power plants. Thermal stratification occurs because of the density difference between the relatively hot and cold coolants in horizontal pipes. Temperature distribution along the stratified pipe is not only nonlinear in axial, radial, and circumferential directions but also variable with time during operation. Accordingly, the stratified flow can produce local stresses as well as global bending stresses in a piping system, which can lead to thermal fatigue cracking and deformation [1-4].
Despite these serious problems, much of nuclear class 1 piping, which adopted ASME B&PV Code, Section III, Subsection NB-3600, was not designed with consideration of the effects of stratified flow such as nonlinear circumferential temperature and non-uniform stresses. For this reason, US NRC issued NRC Bulletin 88-08 and 88-11 to request an appropriate evaluation of the main piping in operating or designed plants using non-destructive testing, experiments, and numerical analysis [5-6]. However, even now, the fatigue design on the branch lines connected to the main piping of the reactor coolant system (RCS) does not properly reflect the effects of thermal stratification.
The safety injection system (SIS) is one of these branch lines. This line is connected to the cold leg of the RCS to supply boric acid solution and remove excessive heat in the event of an accidental depressurization of the RCS. Therefore, during normal operation, all valves in the SIS are closed to maintain the SIS cold coolant stagnantly. There are two well-known factors which provoke thermal stratification in this system. The first factor is the turbulent penetration of hot coolant from the RCS to the branch line. RCS flow is more rapid and relatively hot compared to the branch line flow so it is possible to produce turbulent penetration near the branch. The second factor is leakage through damage in the first closed valve. For instance, in 1996, due to the nonlinear temperature distribution caused by valve leakage, a through-wall crack developed in a horizontal pipe of the SIS in Dampierr Unit 1 [7]. Hence, it is critical to analyze in detail the effects of turbulent penetration and valve leakage on the thermal fatigue of stratified piping by considering the flow characteristics directly. In particular, since piping stresses due to thermal stratification are non-uniform across a section, a numerical approach can be effective in predicting non-uniform thermal stresses.
In this study, we estimate the properties of stratified flow in SIS piping and evaluate thermal stresses directly by considering thermal stratification using a coupled CFDFEM method. Geometric features, operating conditions and evaluation procedure which are considered in this research are described in section 2. As a first step, CFD analyses are performed to realize the phenomena caused by turbulent penetration and valve leakage and determine the temperature distribution throughout the pipe. Secondly, from coupled CFD-FE analyses, the key method of this research, the exact thermal stresses are calculated by directly considering the temperature profile from the CFD analyses. Finally, the results of several numerical analyses explained the effects of turbulent penetration, leakage path, and geometric features on temperature and thermal stress distributions. This two-step approach could reduce the effort needed to estimate the heat transfer coefficient and enhance the accuracy of the heat transfer analysis by considering a more realistic heat transfer coefficient. Furthermore, these results can be used to estimate the critical failure mechanism and location due to thermal stratification as well as to maintain the integrity of SIS piping.
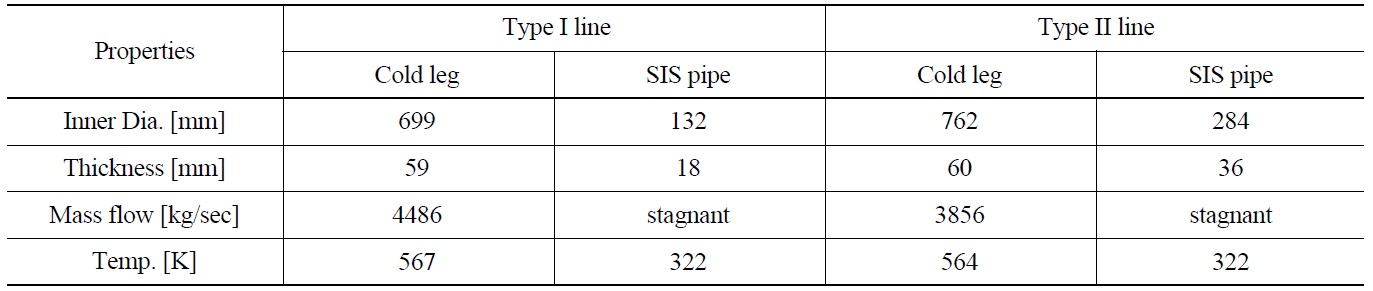
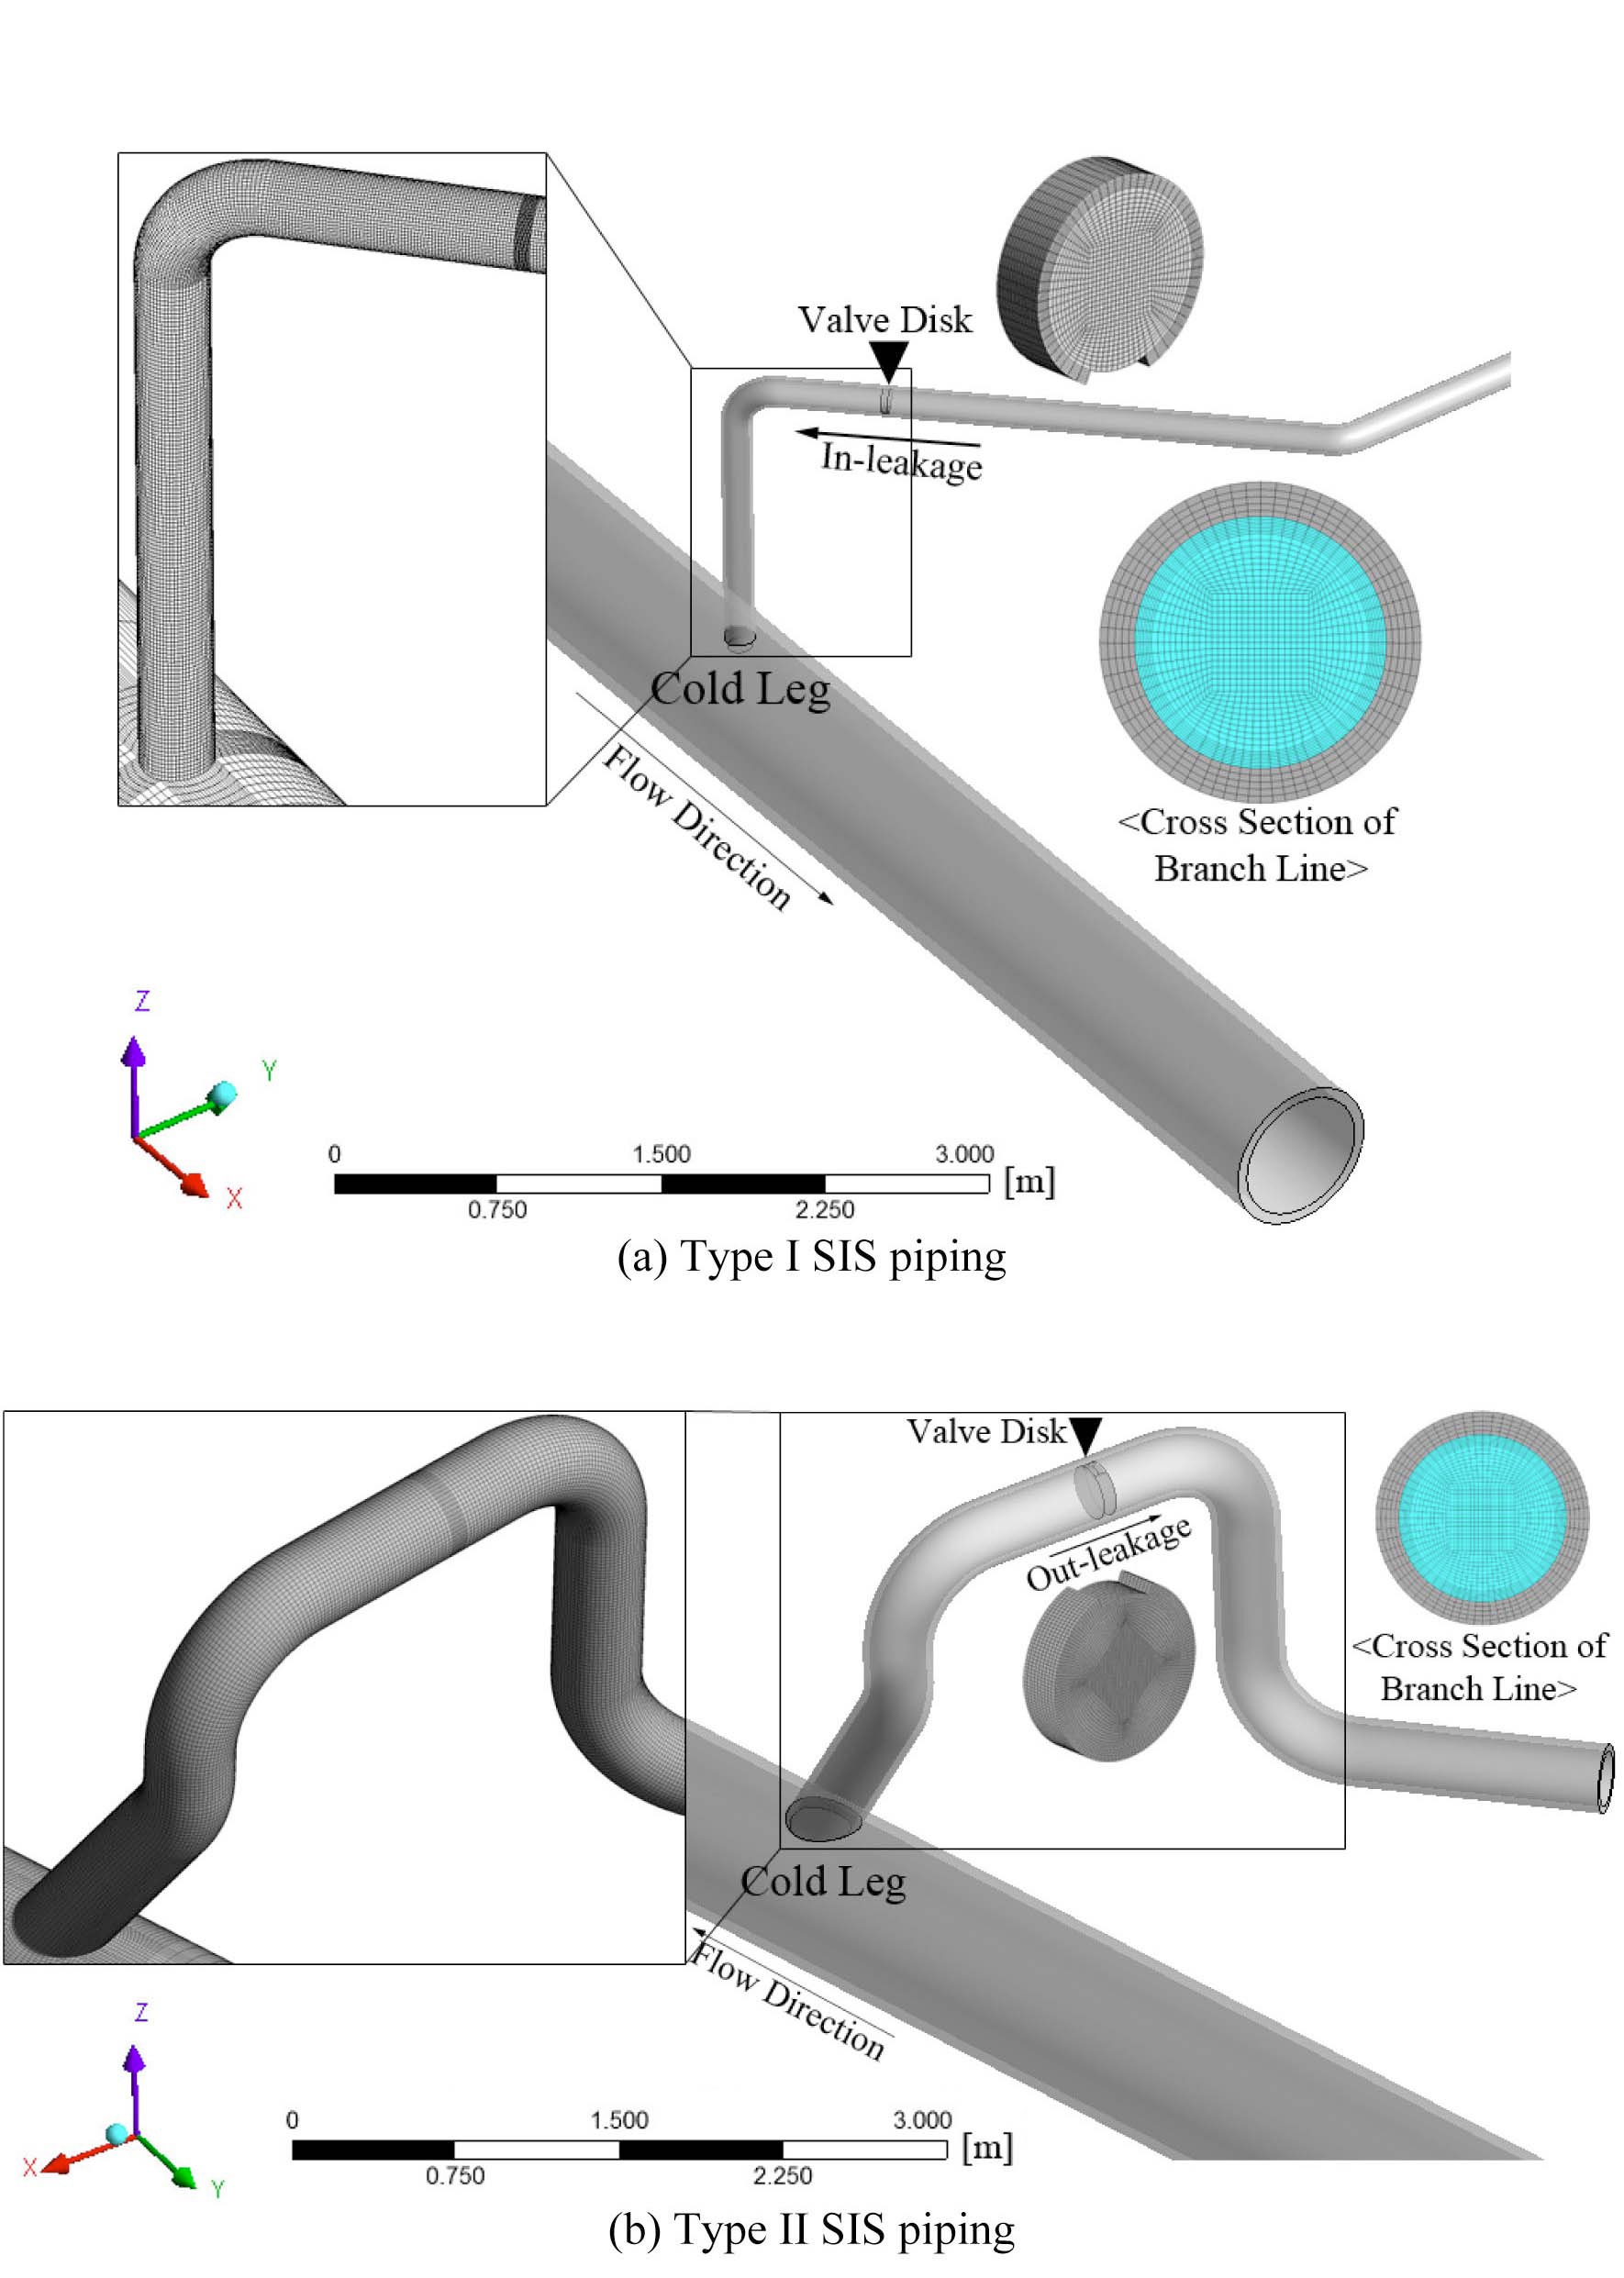
Two different types of SIS piping in pressurized water reactor (PWR) plants were considered in this study. Figs.1(a) and (b) shows the schematic diagrams of each SIS pipe. The SIS pipe is connected to the upper RCS cold leg and all valves in these lines are closed during normal and startup operating conditions. The geometric features and hydraulic conditions of each SIS pipe are presented in Table 1. The pipe diameter of a type II line is twice as large as that of a type I line and the type II line has a thicker wall and consists of a long horizontal pipe compare to the type I pipe. However, in a type I line, the length of the vertical pipe connected to the cold leg is twice that of the type II line. Generally, it is difficult to generate turbulence penetration in a pipe which has a long vertical line and a
[Table 1.] Geometric Features and Hydraulic Conditions of SIS Piping

Geometric Features and Hydraulic Conditions of SIS Piping
small diameter [8-10]. Therefore, the effects of geometric features on the thermal stratification phenomenon were analyzed qualitatively based on these popular views.
In addition to the geometric effects, hydraulic conditions such as turbulence penetration and valve leakage are also critical factors of thermal stratification. The temperature distribution, especially, can vary according to the leakage path. For instance, in type I lines which have a damaged first closed valve, cold coolants can leak from the branch line to the RCS (in-leakage). On the other hand, in type II lines, relatively hot coolants can leak from the RCS to a branch line (out-leakage) because of different design and operating conditions. Therefore, we also carried out a thermal hydraulic analysis to determine the effects of
turbulence penetration and the leakage path on thermal distribution. In this research, all valves were simplified to a valve disk whose thickness was assumed to be twice the pipe thickness. In addition, the different valve leakage positions were set according to the leakage path to promote the stratification phenomenon. The type I model was assumed to have a leak of cold coolants at the bottom of the valve disk. In contrast, the type II model was assumed to have a damaged part at the top of the valve disk so that a leak of hot coolants could rise.
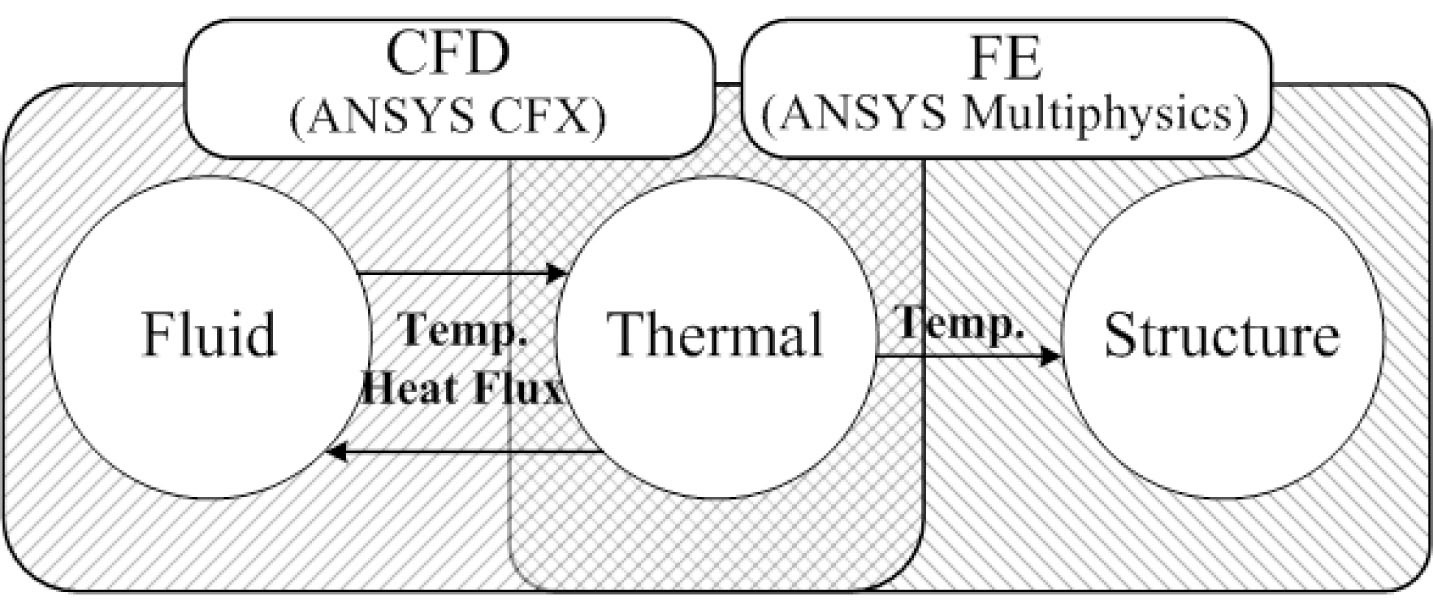
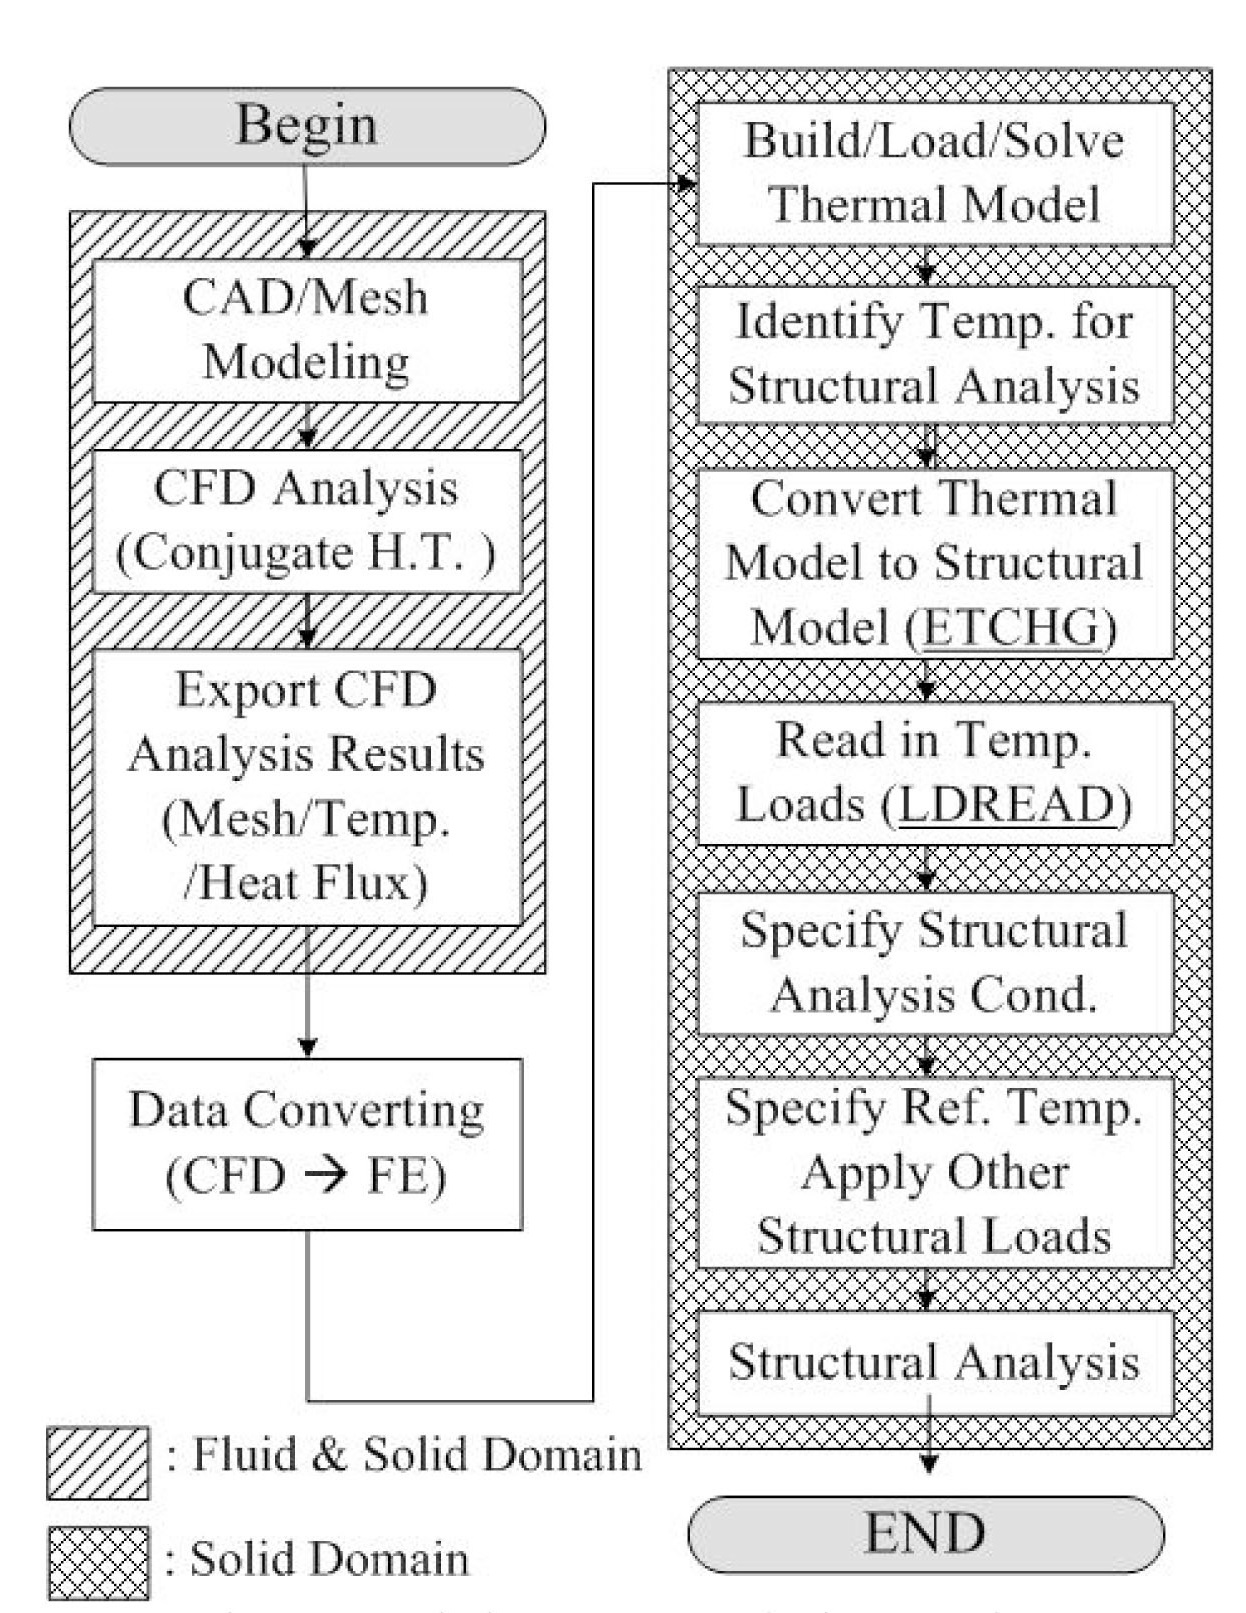
Thermal distribution in SIS piping is not only asymmetrical but also variable with time. For this reason, it is difficult to appropriately evaluate thermal stress caused by stratified flow using ordinary stress analysis methods, which uses the average value of the heat transfer coefficient in each region [11-13]. To overcome this limitation, we utilized the direct coupling method and the one-way sequential method [14]. Using the direct coupling method, the thermal variation of the flow and the pipe were calculated simultaneously in the CFD analysis. In this method, the thermal variation of the pipe can affect the flow characteristic. Also, by employing the one-way sequential method, the temperature distribution in a stratified pipe can be input as thermal loading in the structural analysis. Fig. 2 shows the concept of our coupled CFD-FE analysis strategy. A similar method was used by Kim et al., Chapuliot et al., and Lee et al. on different evaluation targets [7,15-16]. Based on this concept, we evaluated the thermal stress of SIS piping according to the procedure represented in Fig. 3. The details of the evaluation procedure are as follows.
First, the geometry and mesh of the piping are generated for numerical analysis as shown in Fig. 1. Then, CFD analysis is carried out through ANSYS CFX ver.12 [17] considering the conjugated heat transfer condition to calculate the thermal parameters of the piping. After finishing the CFD analysis, results such as the temperature of each node and the heat flux of each element are exported. Also, only the mesh information related to the solid region is exported. Before conducting the FE analysis using ANSYS ver.12 [18], all data are converted to the input data format for thermal structural analysis. Specifically, all mesh and temperature distribution data with time are directly imported into the FE analysis model without any
calculation of the heat transfer coefficient. Next, from the transferred data, a thermal model is built and then analyzed by a mesh-based parallel code coupling interface (MPCCI). Then, the thermal model is converted to a structural model, and the temperature distribution is read in temperature loads. Finally, after specifying several structural analysis conditions, structural analysis is performed.
To carry out a thermal hydraulic analysis of thermal stratification, we assumed the followings. Thermal flow is unsteady, incompressible and three dimensional. Also, the effects of radiation heat transfer and viscous dissipation are neglected. To take into account the thermal interaction between the pipe wall and stratified flow, the conjugate heat transfer analysis is incorporated into the CFD analysis.
The Reynolds number of the stratified flow in the SIS is estimated to be in the turbulent region. Therefore, to describe the turbulent flow accurately, we applied the shear stress transport (SST) turbulent model. The SST model is widely used for accurate boundary layer simulation especially for flow separation and swirl flow, because it applies a
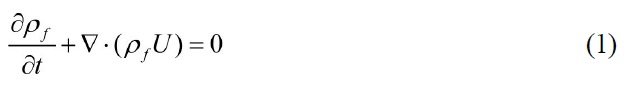
The temperature-dependent density difference was directly considered to calculate the buoyancy term so that the properties of light water were considered according to the variation in temperature. Consequently, in this study, the Unsteady Reynolds-Averaged Navier-Stokes (URANS) equations were used as the governing equations. The Cartesian form of the governing equations is as follows.
Continuity equation
where
Momentum equation
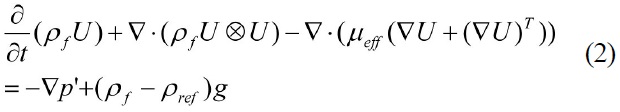
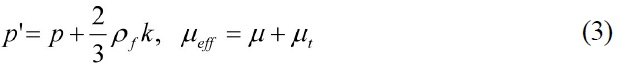
where
Energy equation
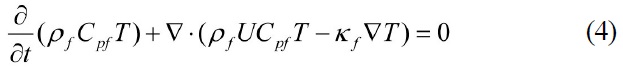
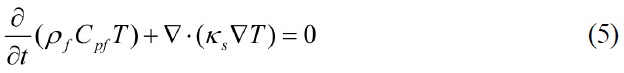
where
Shear stress transporting
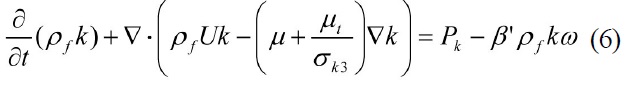
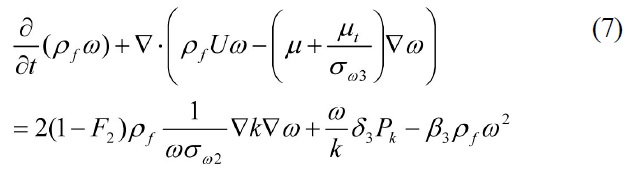
where
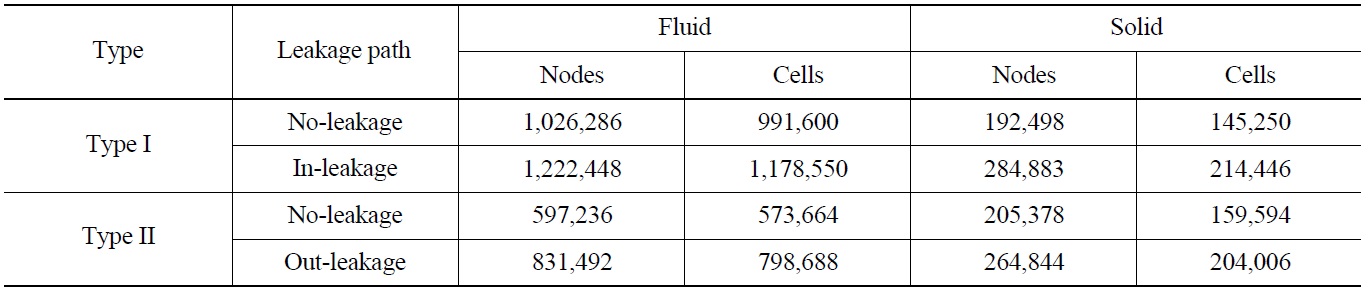
[Table 2.] Grid System Information

Grid System Information
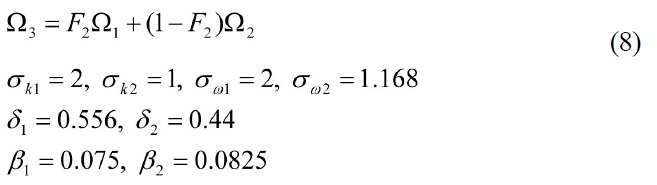
coefficients
The initial temperature of each SIS pipe was assumed to be the design temperature, 322 K. Also, the initial flow of the SIS was assumed to be stagnant. In addition, all outer surfaces of the piping were assumed to be adiabatic and a no-slip condition was applied to all inner surfaces of the piping. In the type I SIS piping model, temperature and flow rate of the coolant at the inlet of the cold leg were 564 K and 4,486 kg/sec, respectively. Similarly, in the type II SIS piping model, temperature and flow rate of the coolant at the inlet of cold leg were 567 K and 3,856 kg/sec, respectively. The area average of static pressure over the outlet was assumed to be zero. The end of each branch line was assumed to be isolated and to have a 322 K low temperature wall. All valves in the SIS piping were assumed to be isolated in no-leakage models. On the contrary, in leakage models, the allowed leakage rate, which was provided by the leakage test, 7.5D ft3/day, was applied as the leakage rate. Based on several accident reports, the leakage area was assumed to be 3 percent of the total disk area [21].
The CFX code based on the finite volume method was used for thermal hydraulic analysis. In this study, a total four CFD analysis models were considered. The grid system information on each model is described in table 2. To accurately calculate the near-wall flow, an automatic near-wall treatment method for the SST turbulent model was applied. This method automatically switches from wall functions to a low-Re near wall formulation as the mesh is refined. In addition, to discretize the governing equations, the convection terms were approximated by a higher order bounded scheme. Convergence of the iterative computations for each time step, 0.5 s, was determined when the RMS residuals of all the major parameters became less than 10-4. To satisfy this convergence criterion, iterations of less than 10 times per time step were needed. The total calculation time was 1,500 s for no-leakage models and 3,000 s for leakage models.
3.4 Results of Thermal Hydraulic Analysis
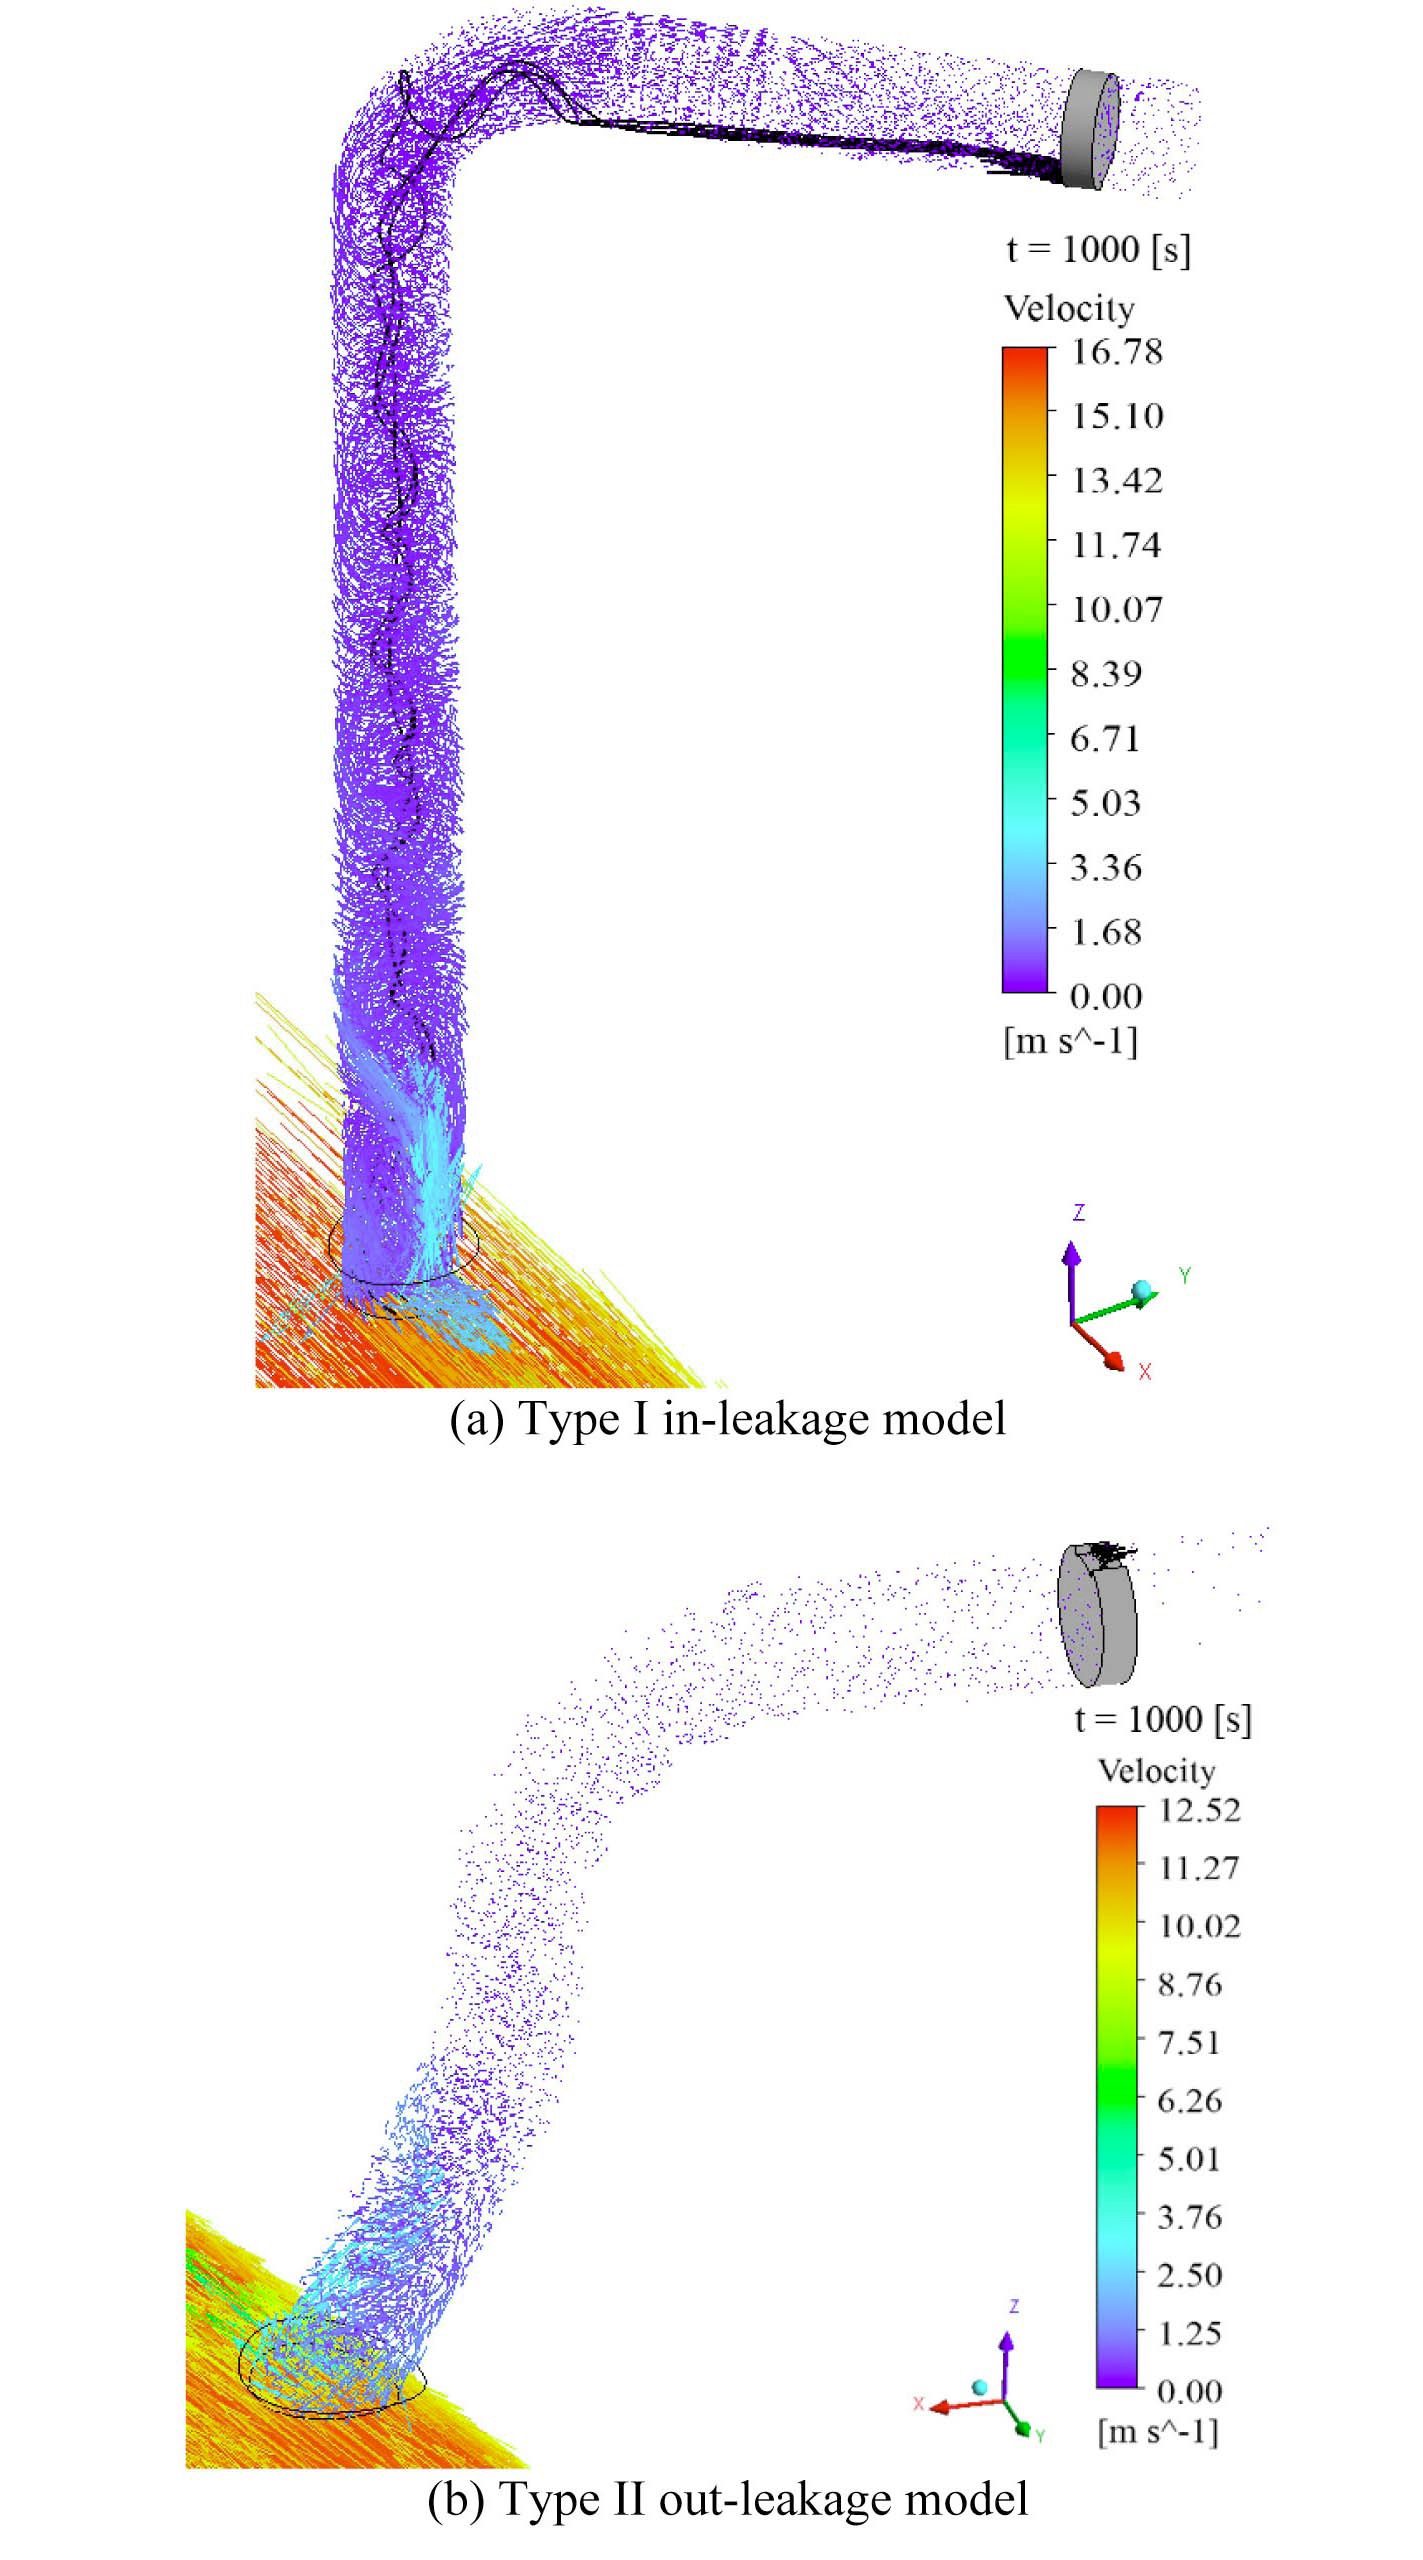
Figs. 4(a) and 4(b) display the primary flow velocity vectors and stream lines in the leakage models. These figures provide a qualitative understanding of the effect of pipe geometry and hydraulic conditions on the flow characteristics. Compared with the type II out-leakage model, the type I in-leakage model shows strong turbulent penetration and swirl flow develop from the branch point
to the first 90-degree elbow. This difference is due to the fact that the turbulent penetration increased with flow velocity in the cold leg and a relatively large pressure difference was induced by the geometric features (small diameter and long vertical part). A similar feature also appears in both no-leakage models. In addition, stream lines starting from the leakage interface mostly reach the first 90-degree elbow connected with the vertical line in the type I in-leakage model. On the other hand, stream lines are not well developed in the type II out-leakage model since the coolants are incompressible and the second valve is closed. This means that the flow of the out-leakage model is produced only by natural convection near the first valve.
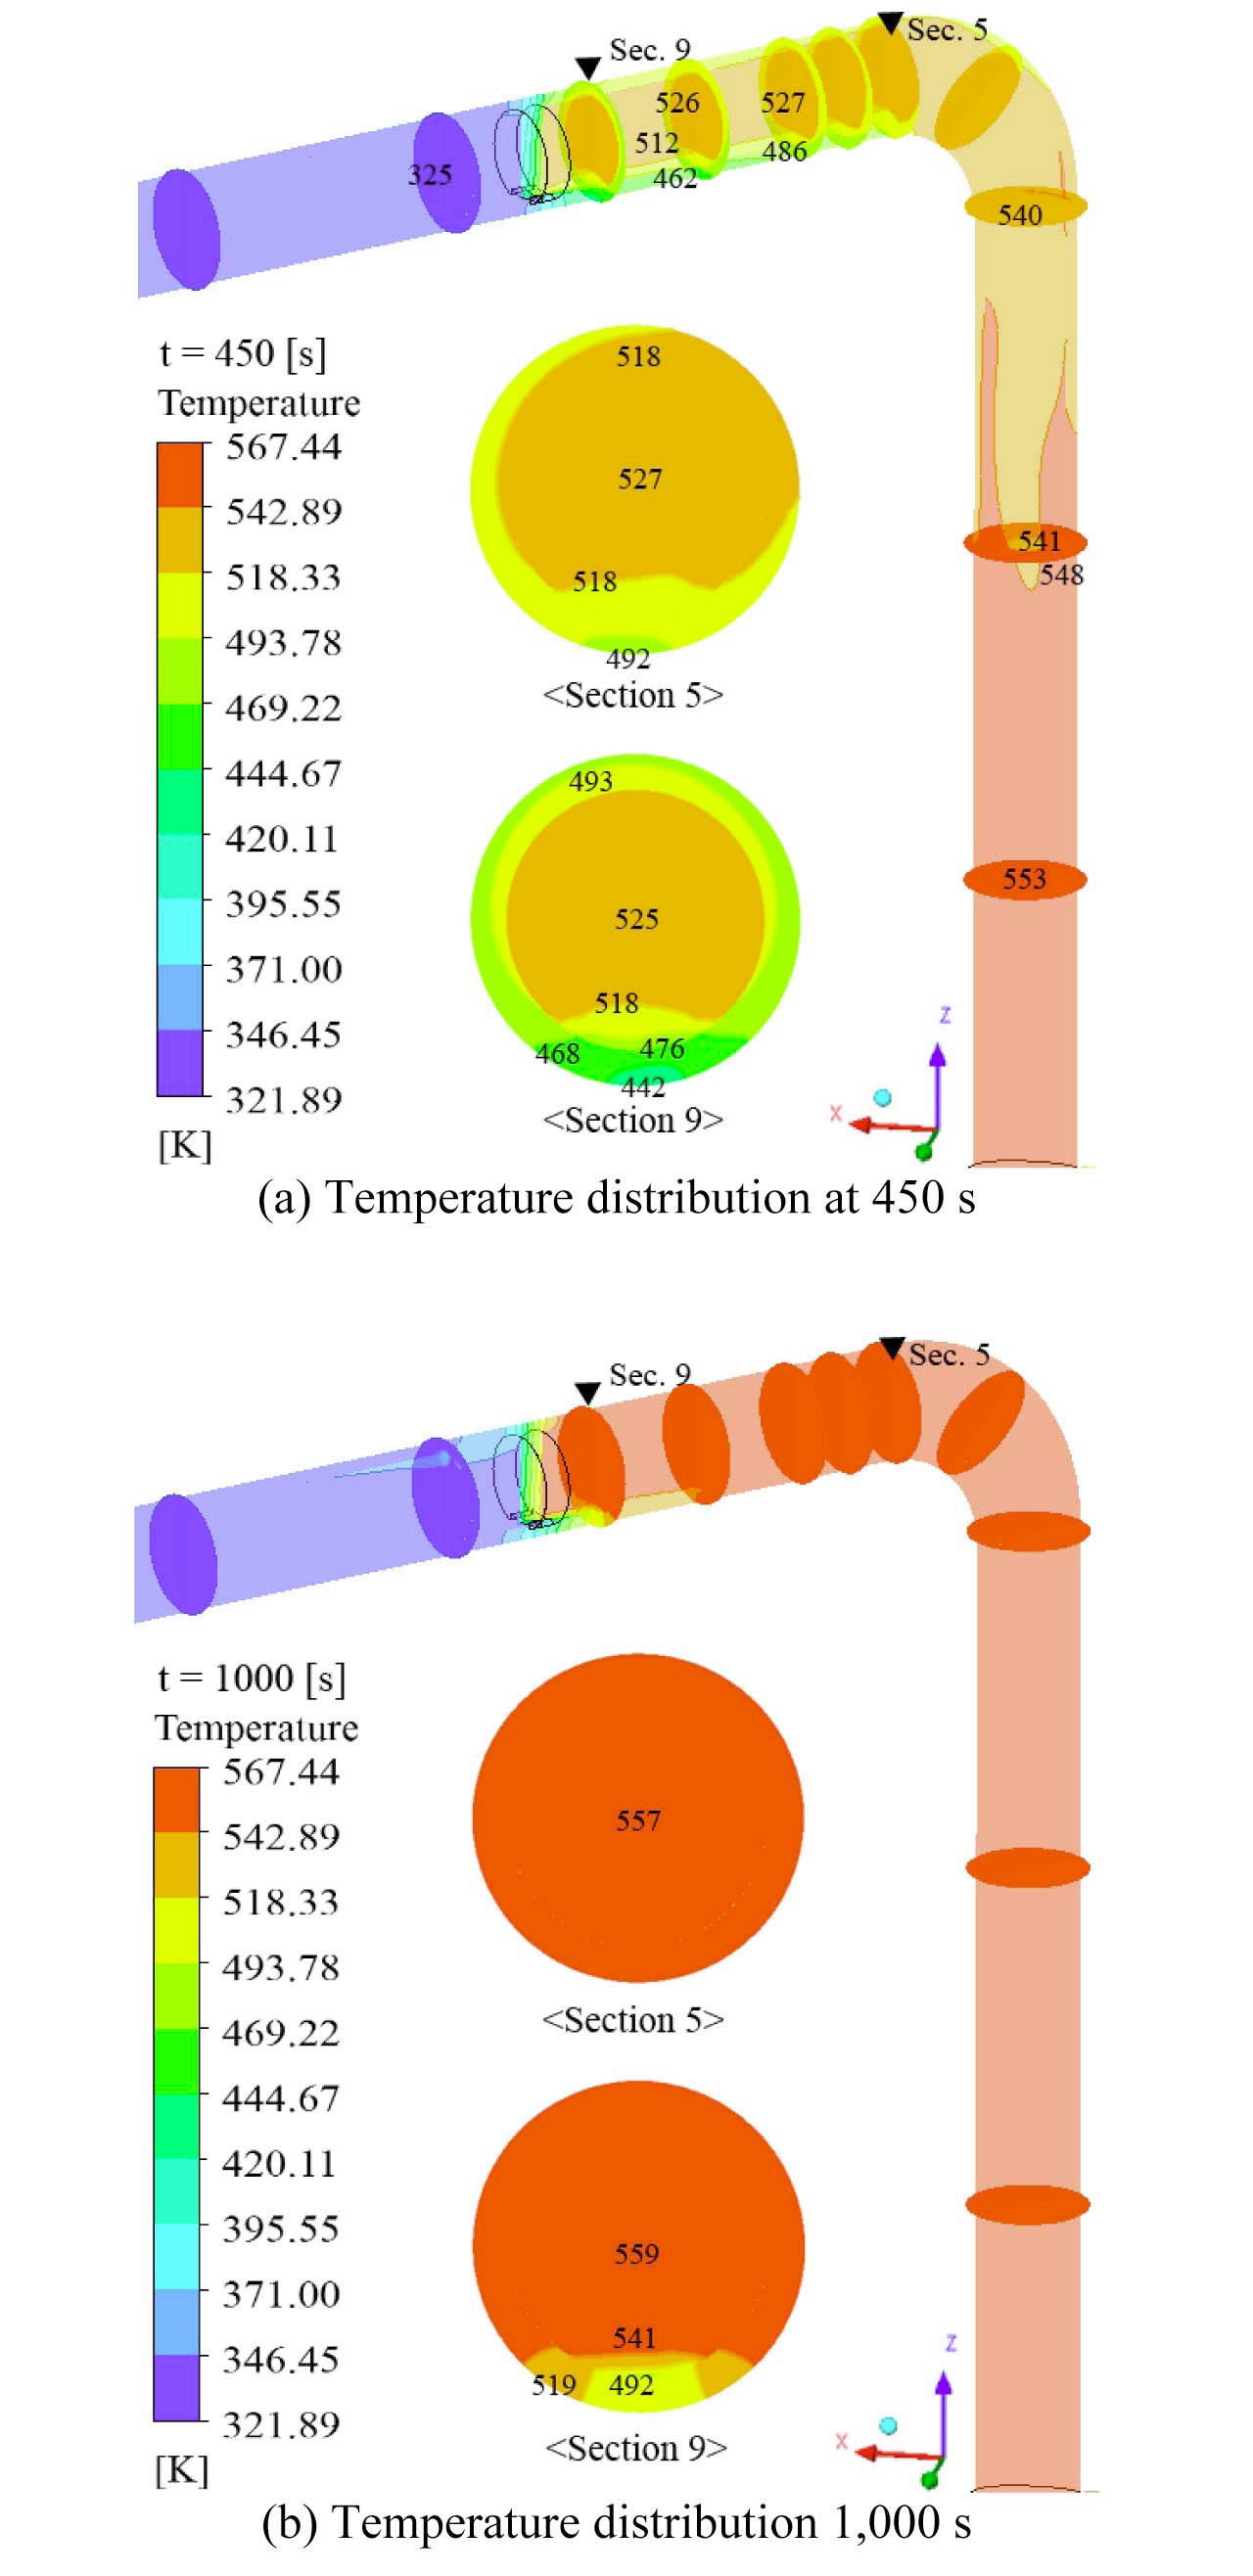
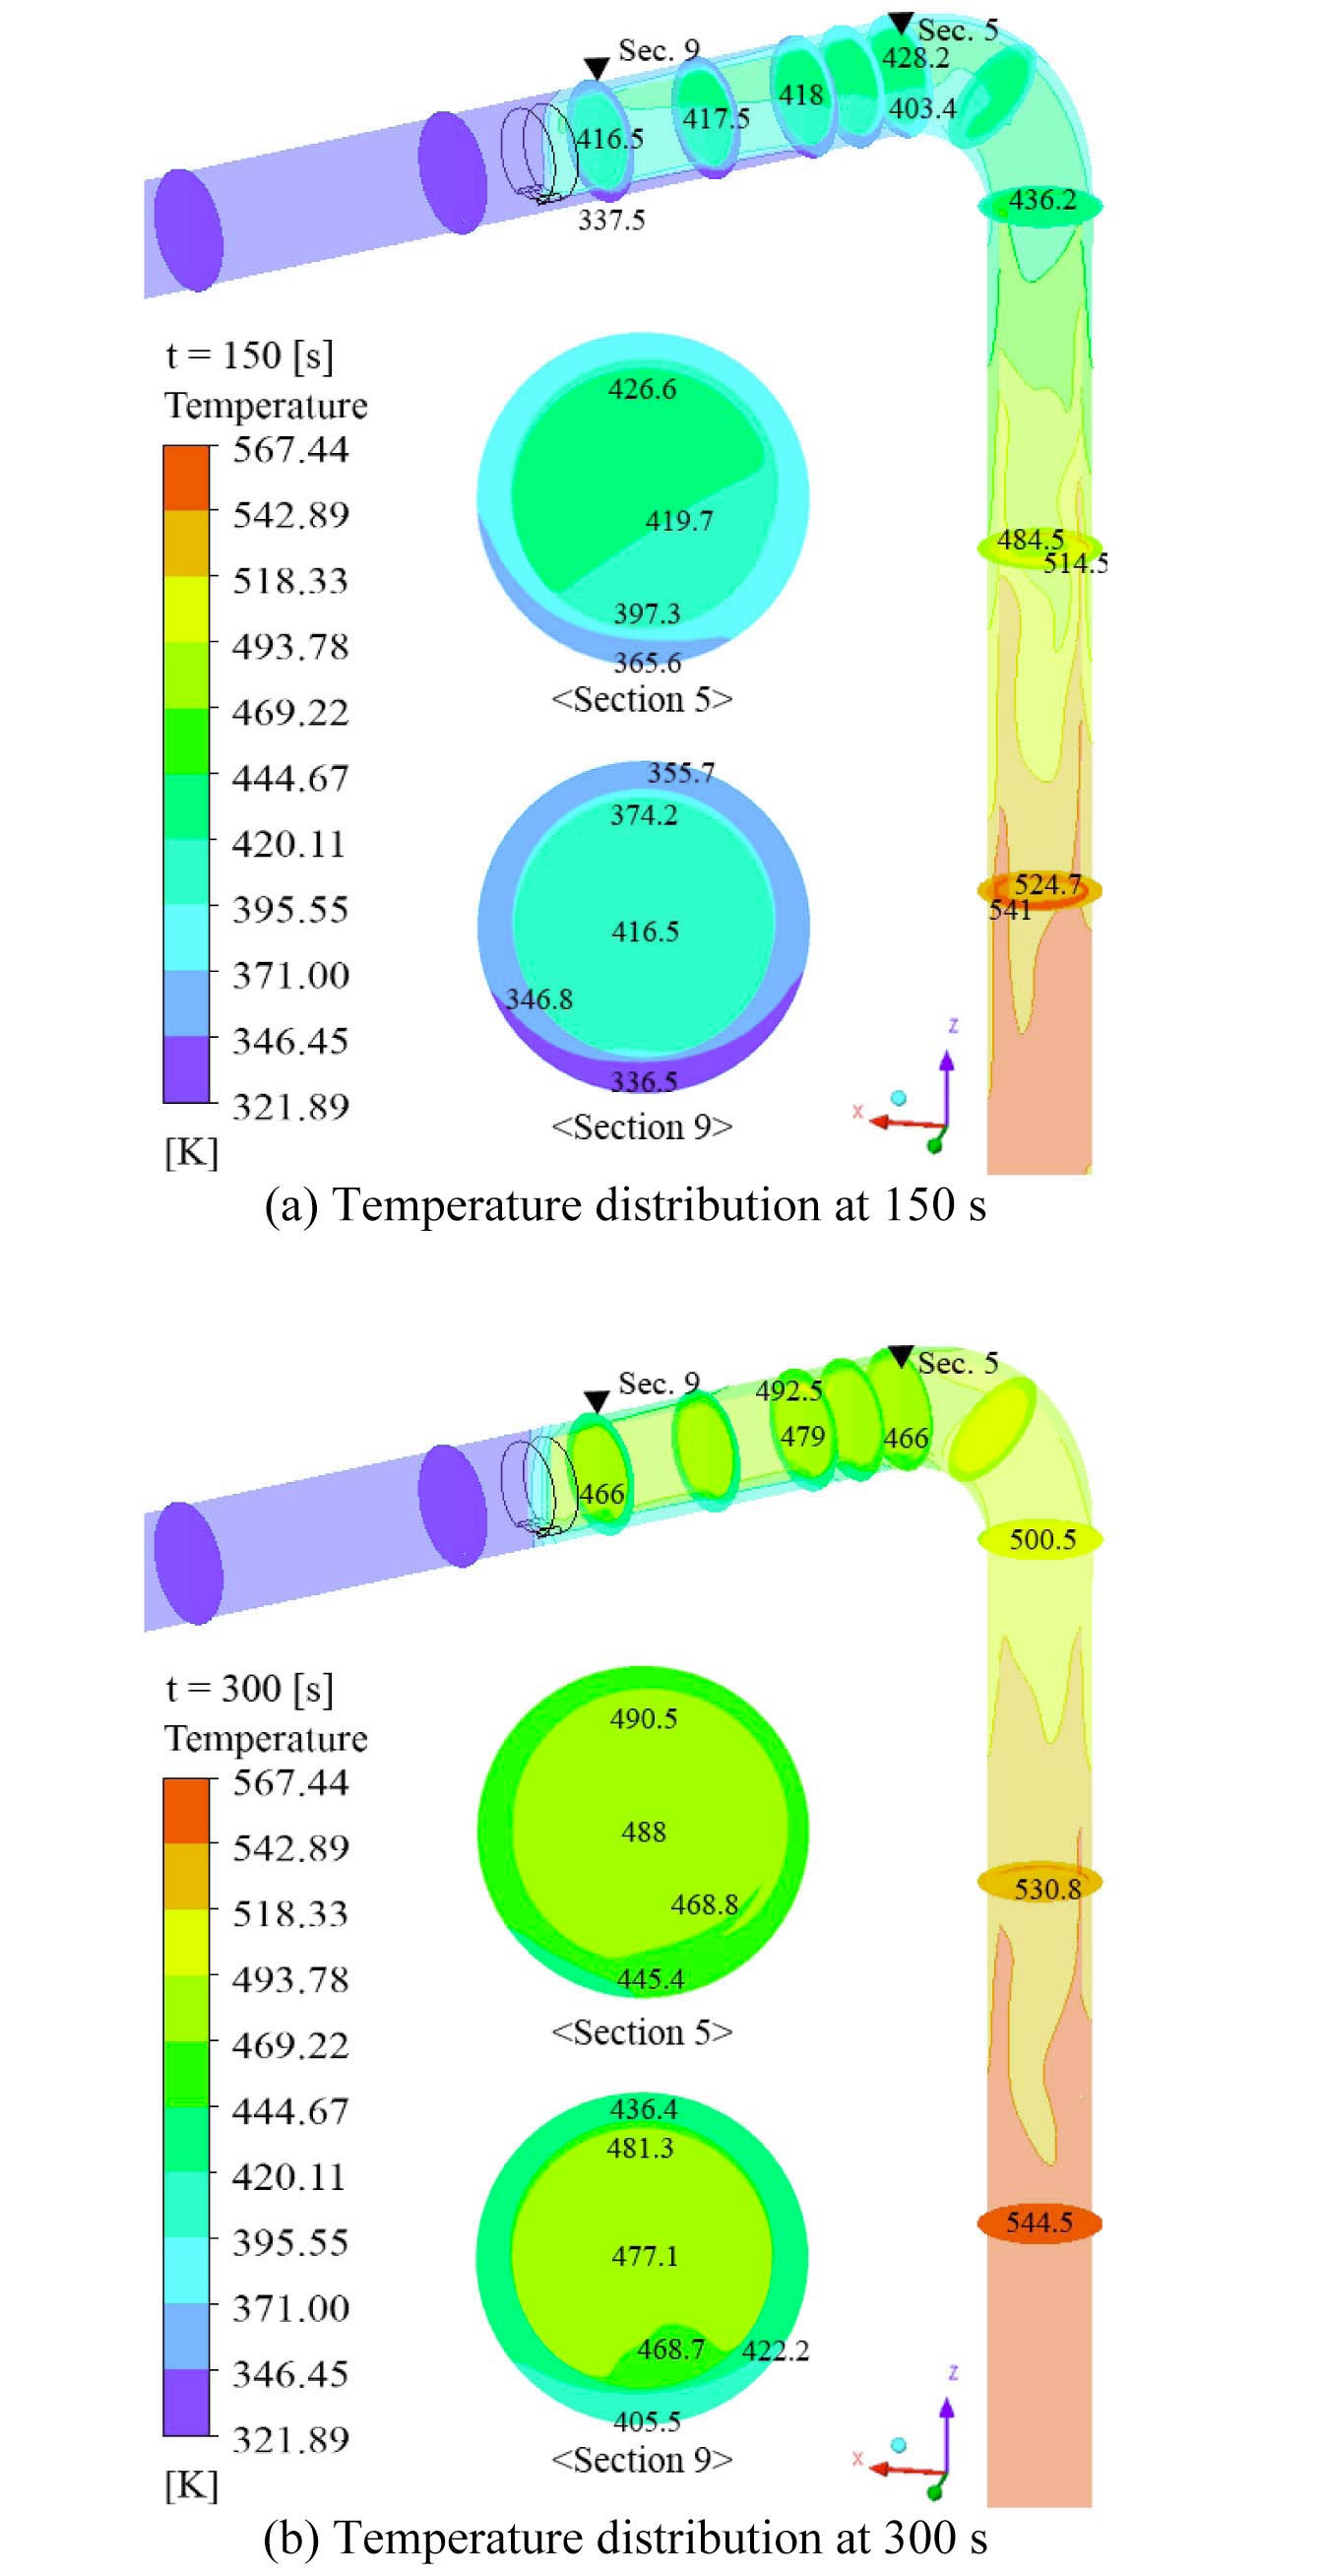
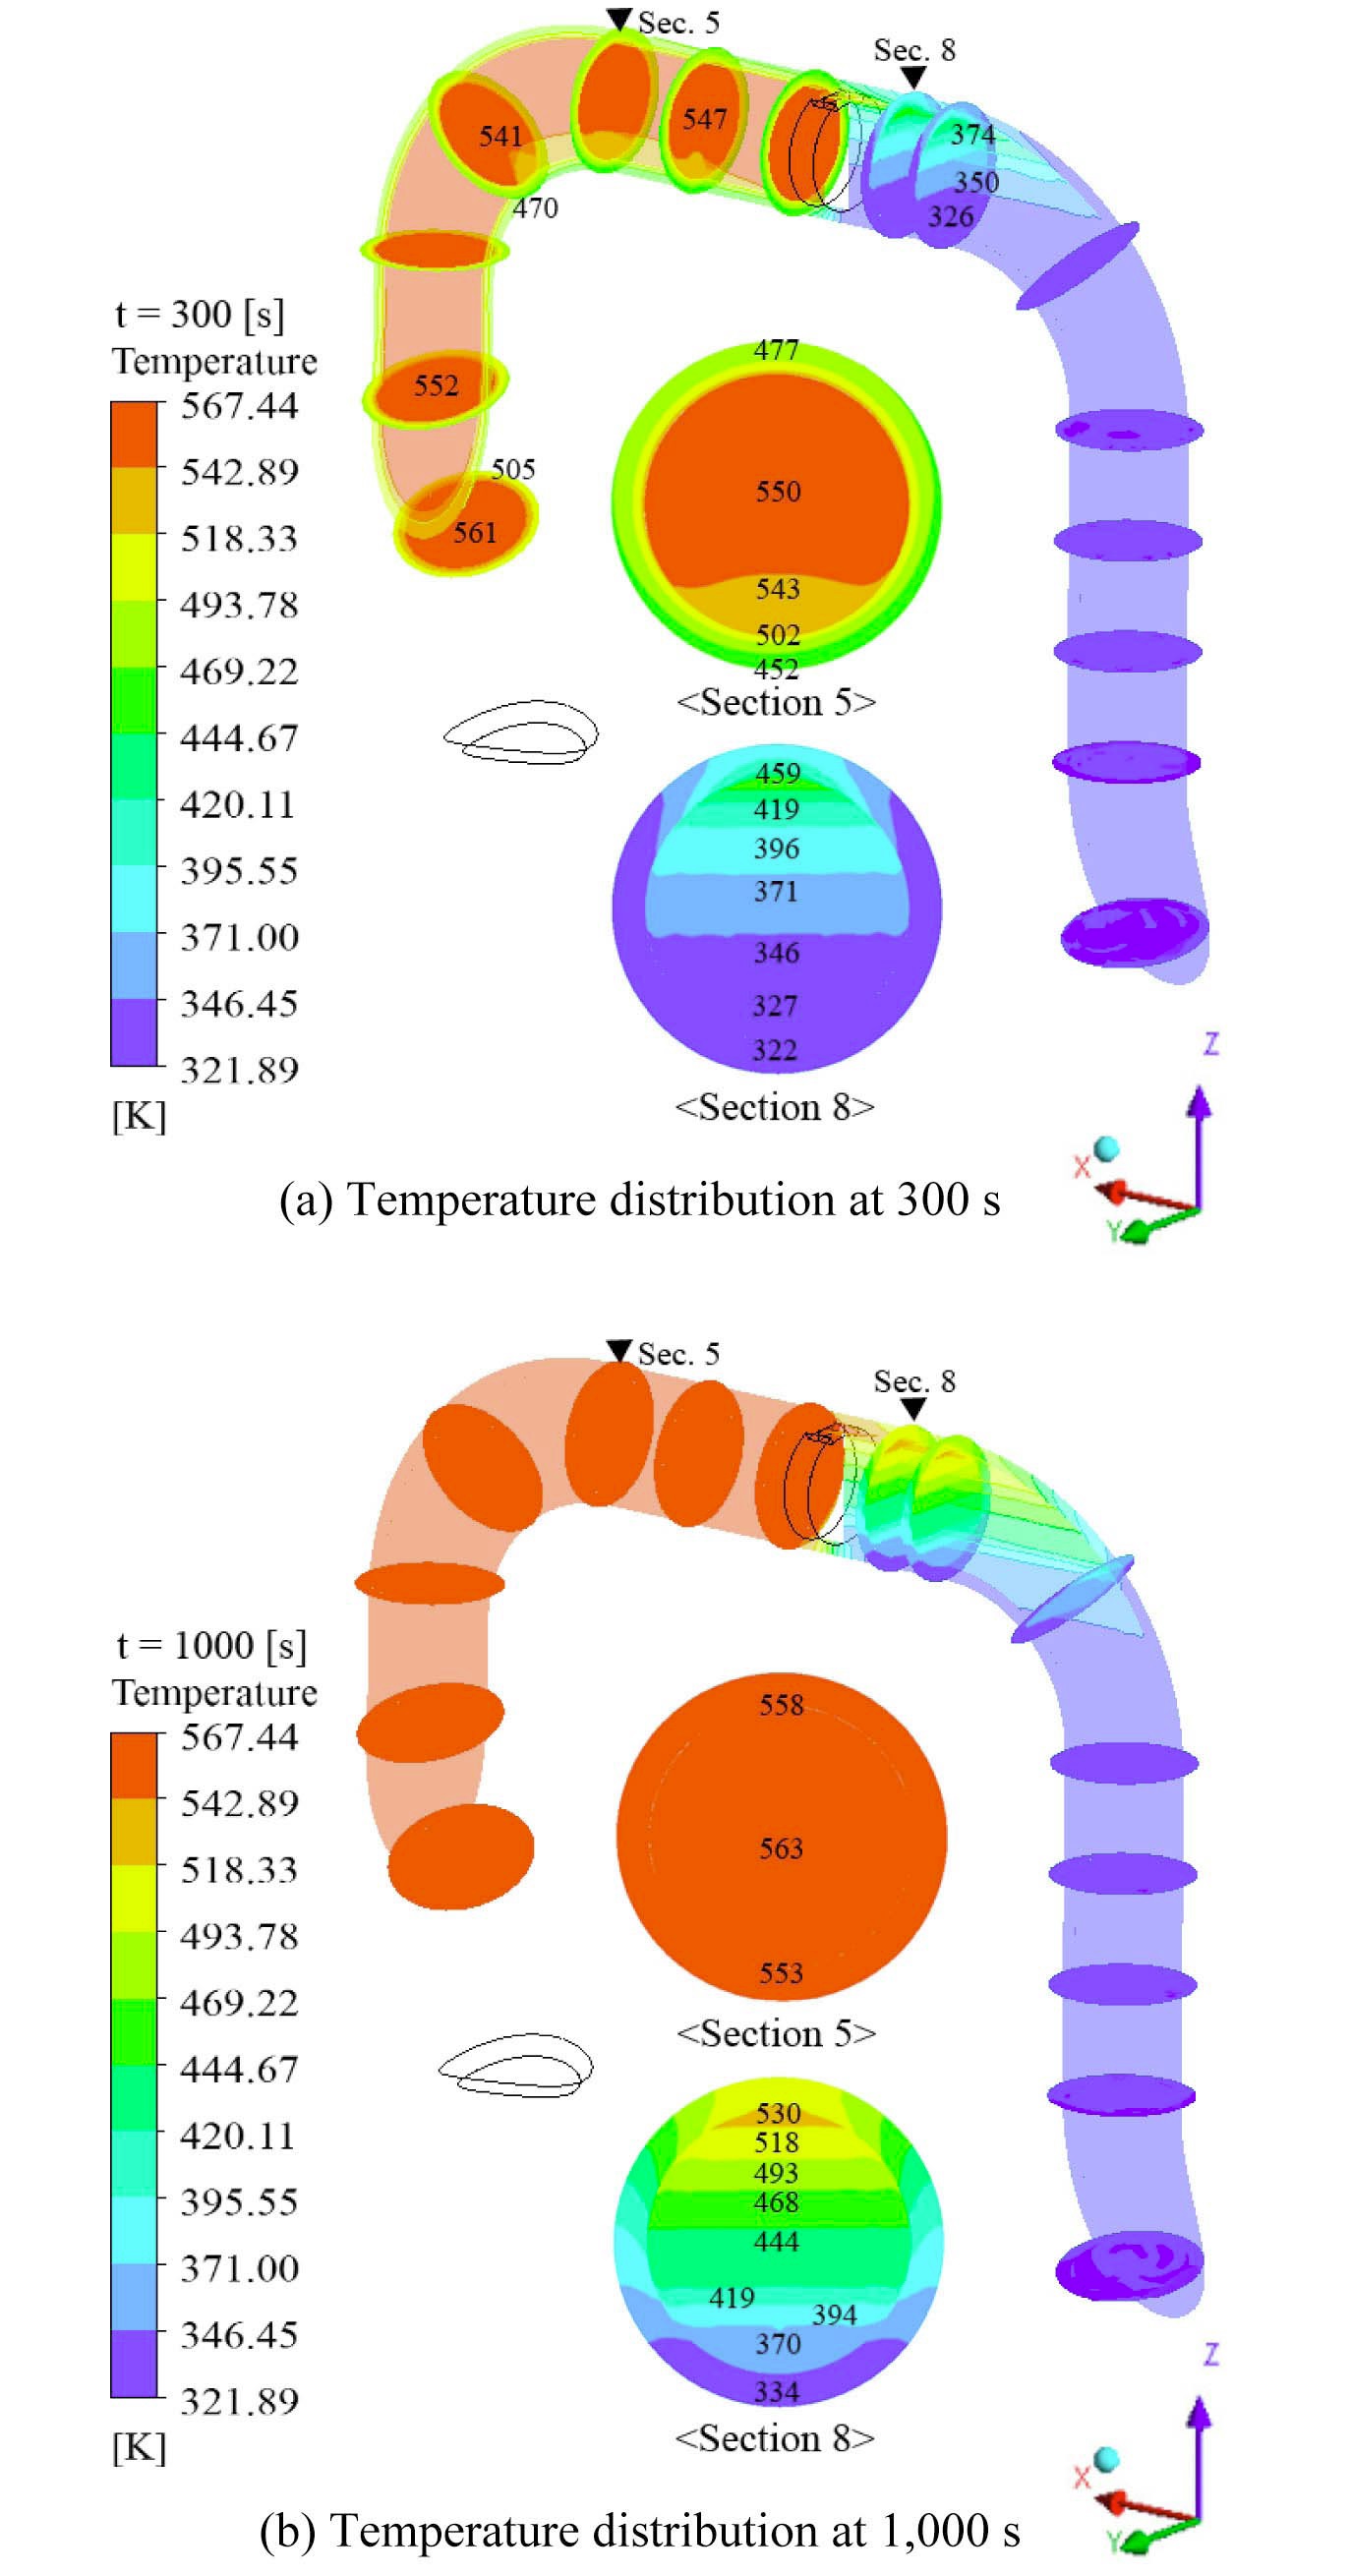
Fig. 5 and Fig. 6 show the temperature distribution in type I SIS piping at a specific time. Fig. 5 indicates the variation of temperature distribution induced by thermal stratification in the type I no-leakage model. Due to the
turbulent penetration from the cold leg, stratified flow is generated in the horizontal piping connected with the 90- degree elbow. Especially, the maximum temperature difference between the top and bottom of the inner wall (Δ
A similar tendency of temperature distribution is observed in type II SIS piping. Fig. 7 shows that stratified flow also develops at the horizontal part located at the front of the first valve in the type II no-leakage model. Furthermore, Δ
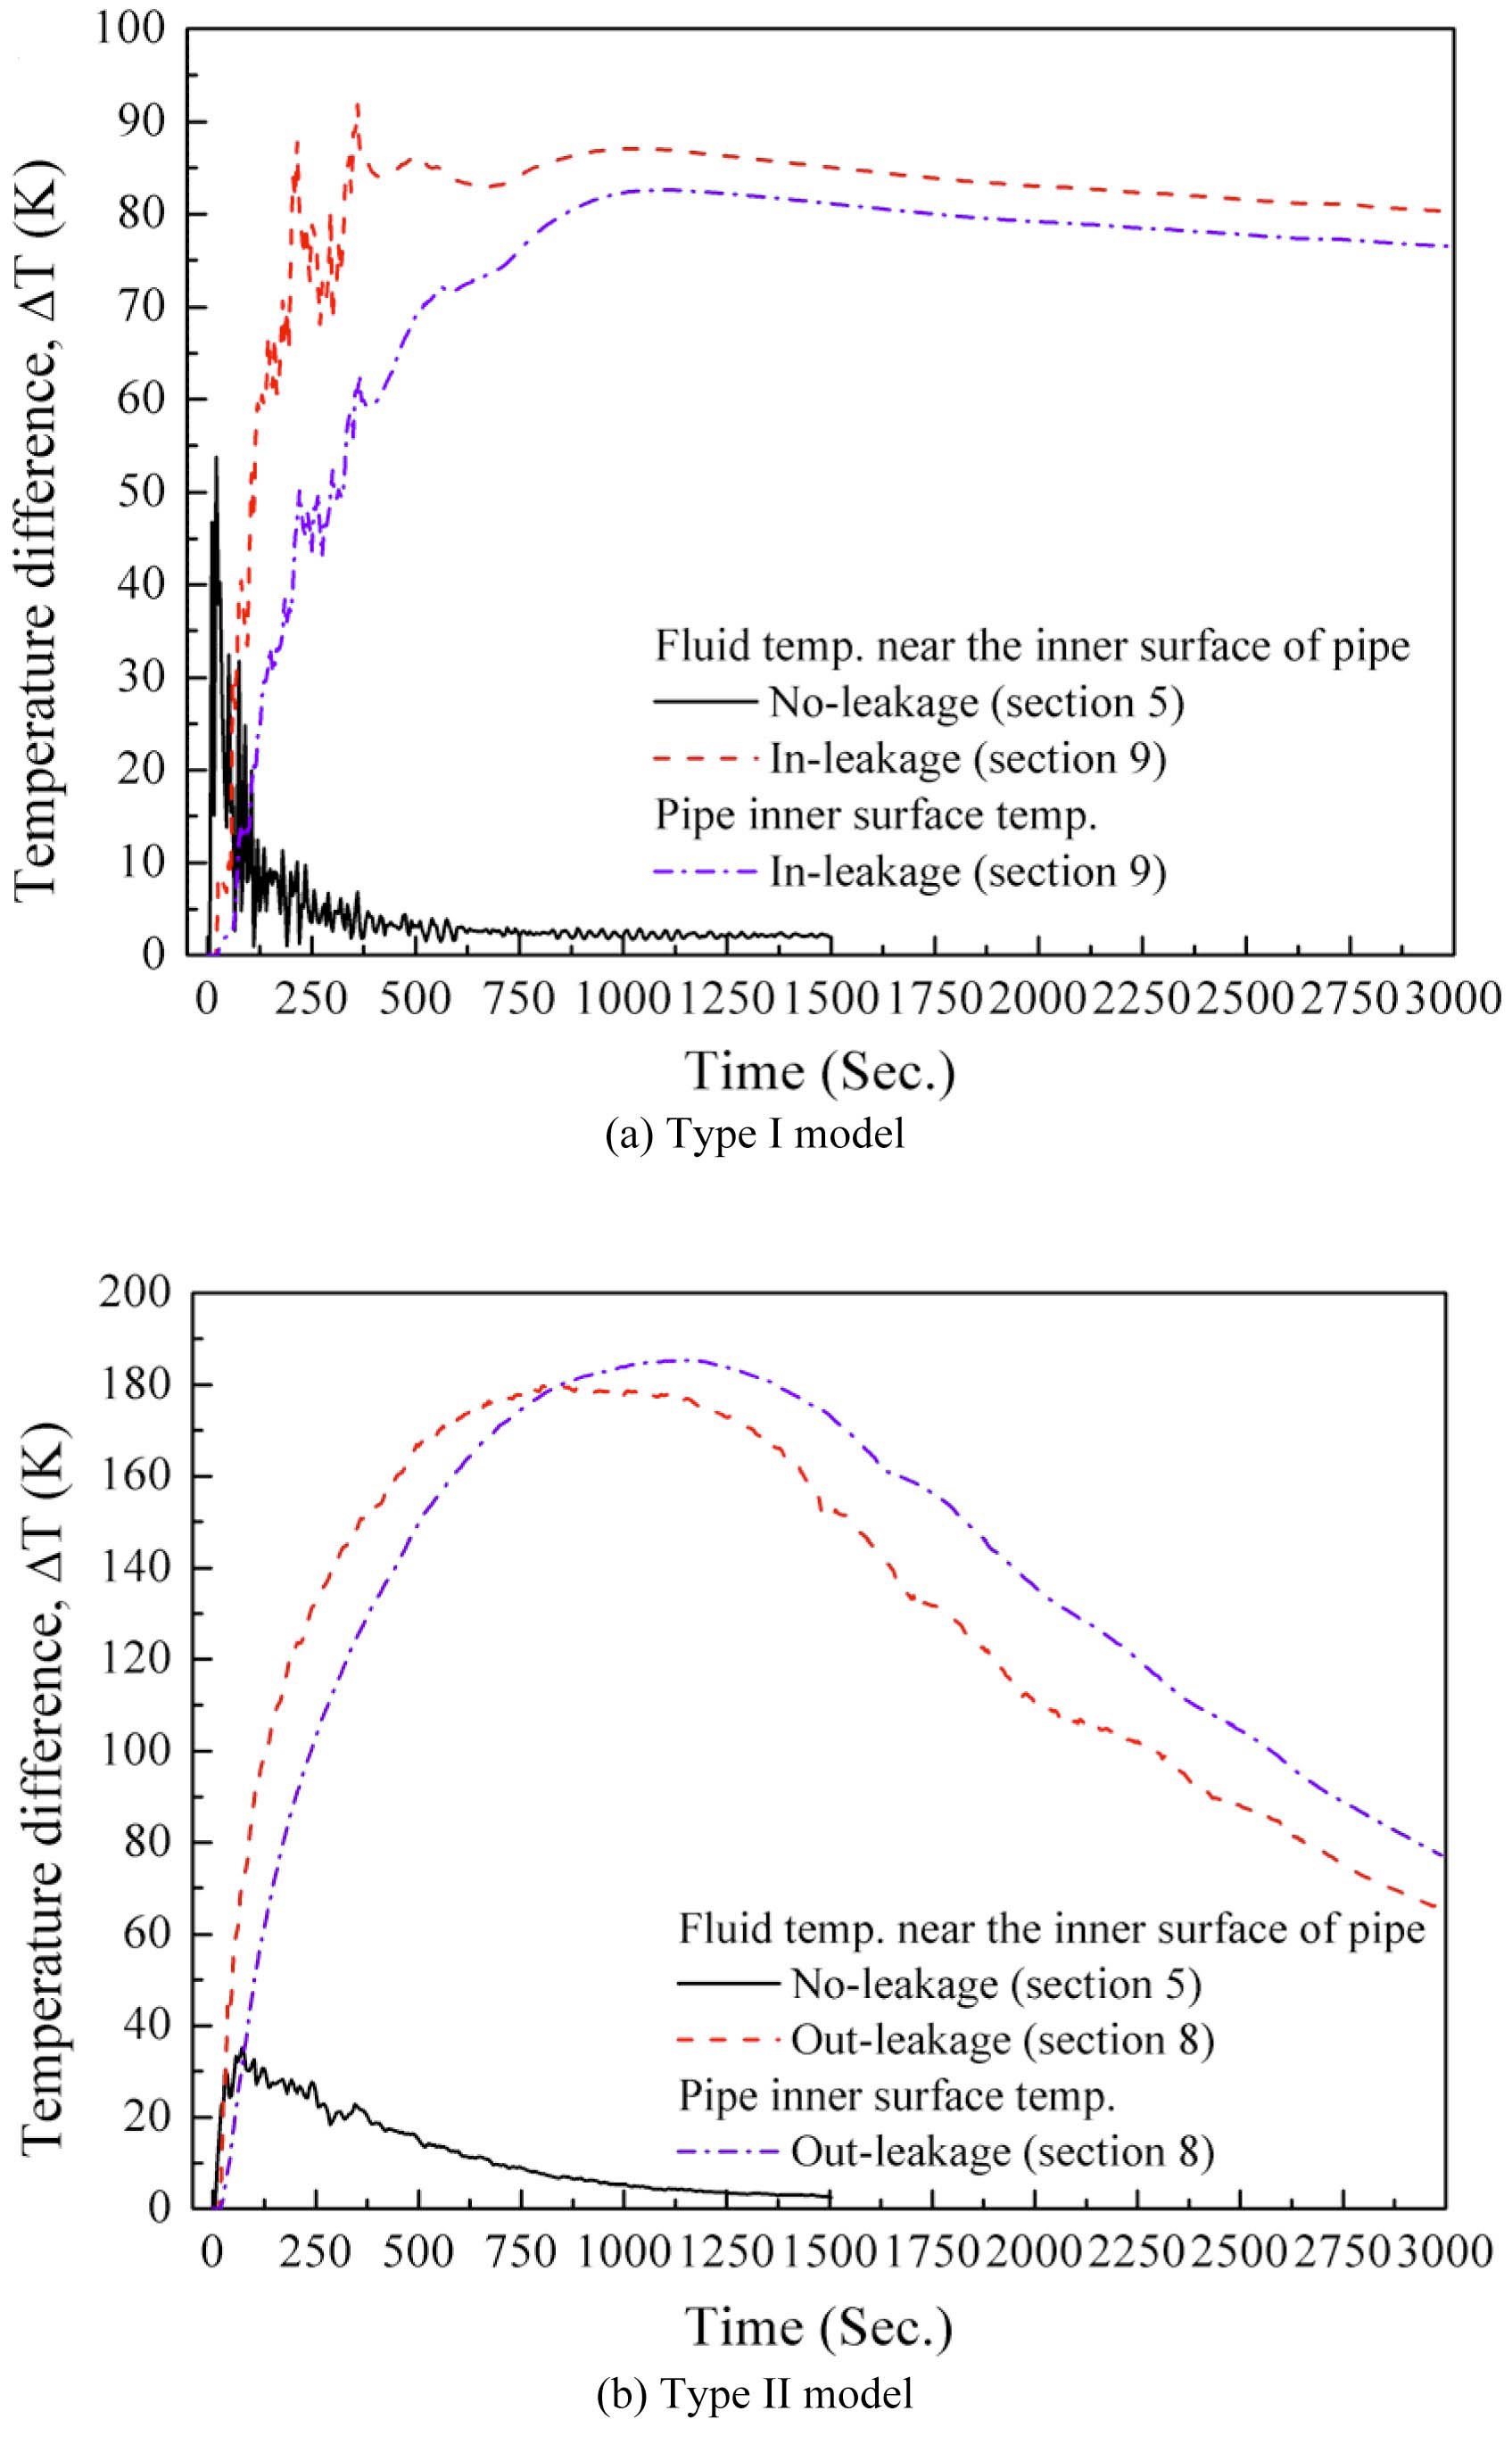
In Fig.9, the temperature difference between the top and bottom of the inner wall (Δ
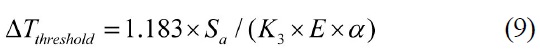
coefficient at room temperature. Δ
Furthermore, by comparing the trend of critical Δ
causes a relatively high temperature difference, but this high temperature difference rapidly decreases. From these facts, we can conclude that additional thermal stress evaluation on each leakage model are needed.
4. ONE-WAY SEQUENTIAL COUPLED ANALYSIS APPROACH
4.1 Description of Coupled CFD-FE Analysis
The coupling analysis was performed on the FE model taken from the CFX model to obtain the thermal stress distributions in the SIS piping. The FE model consisted of a 3-dimensional 8-node structural solid element (SOLID 185) and five element layers in the radial direction. The SOLID 185 element is usually applied to analyze plasticity, hyper-elasticity, stress stiffening, creep, large deflection and strain of solids. Each node of this element has three degrees of freedom and, translations in the nodal
The appropriate time intervals for mapping temperature data in the coupling analysis were determined by recording and comparing the temperature at several positions at the wall, in the fluid and the solid. From Fig. 9, it can be seen that the temperature difference in the solid region increases slowly because of the different thermal conductivities of fluid and solid. Based on these data, the fluid temperature was mapped on the FE model at intervals of 5.0 s, which is larger than the time step in thermal hydraulic analysis. The FE analysis of the pipe was performed using the commercial FE program ANSYS ver.12 and the total simulation time was chosen as 1,000s. We applied a symmetric boundary condition to all pipe ends. Under this condition, the displacement of all pipe ends was constrained in the axial direction and the bending motions were also constrained. One arbitrarily selected node was constrained
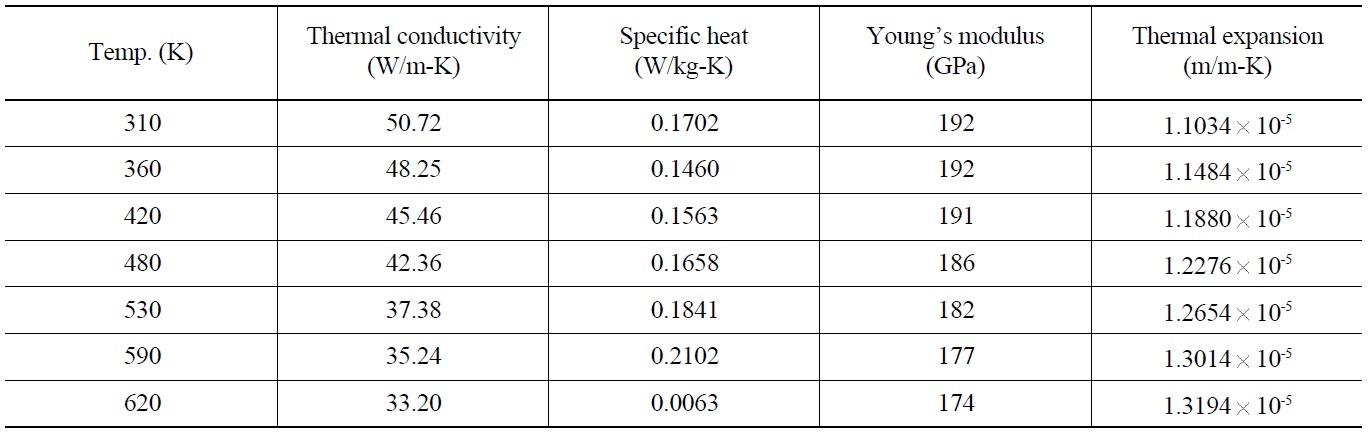
[Table 3.] Material Properties of ANSI SUS 304

Material Properties of ANSI SUS 304
in all directions to prevent rigid body motion. In addition, several supports were assumed along the line considering a real piping design.
4.2 Results of Thermal Stress Analysis
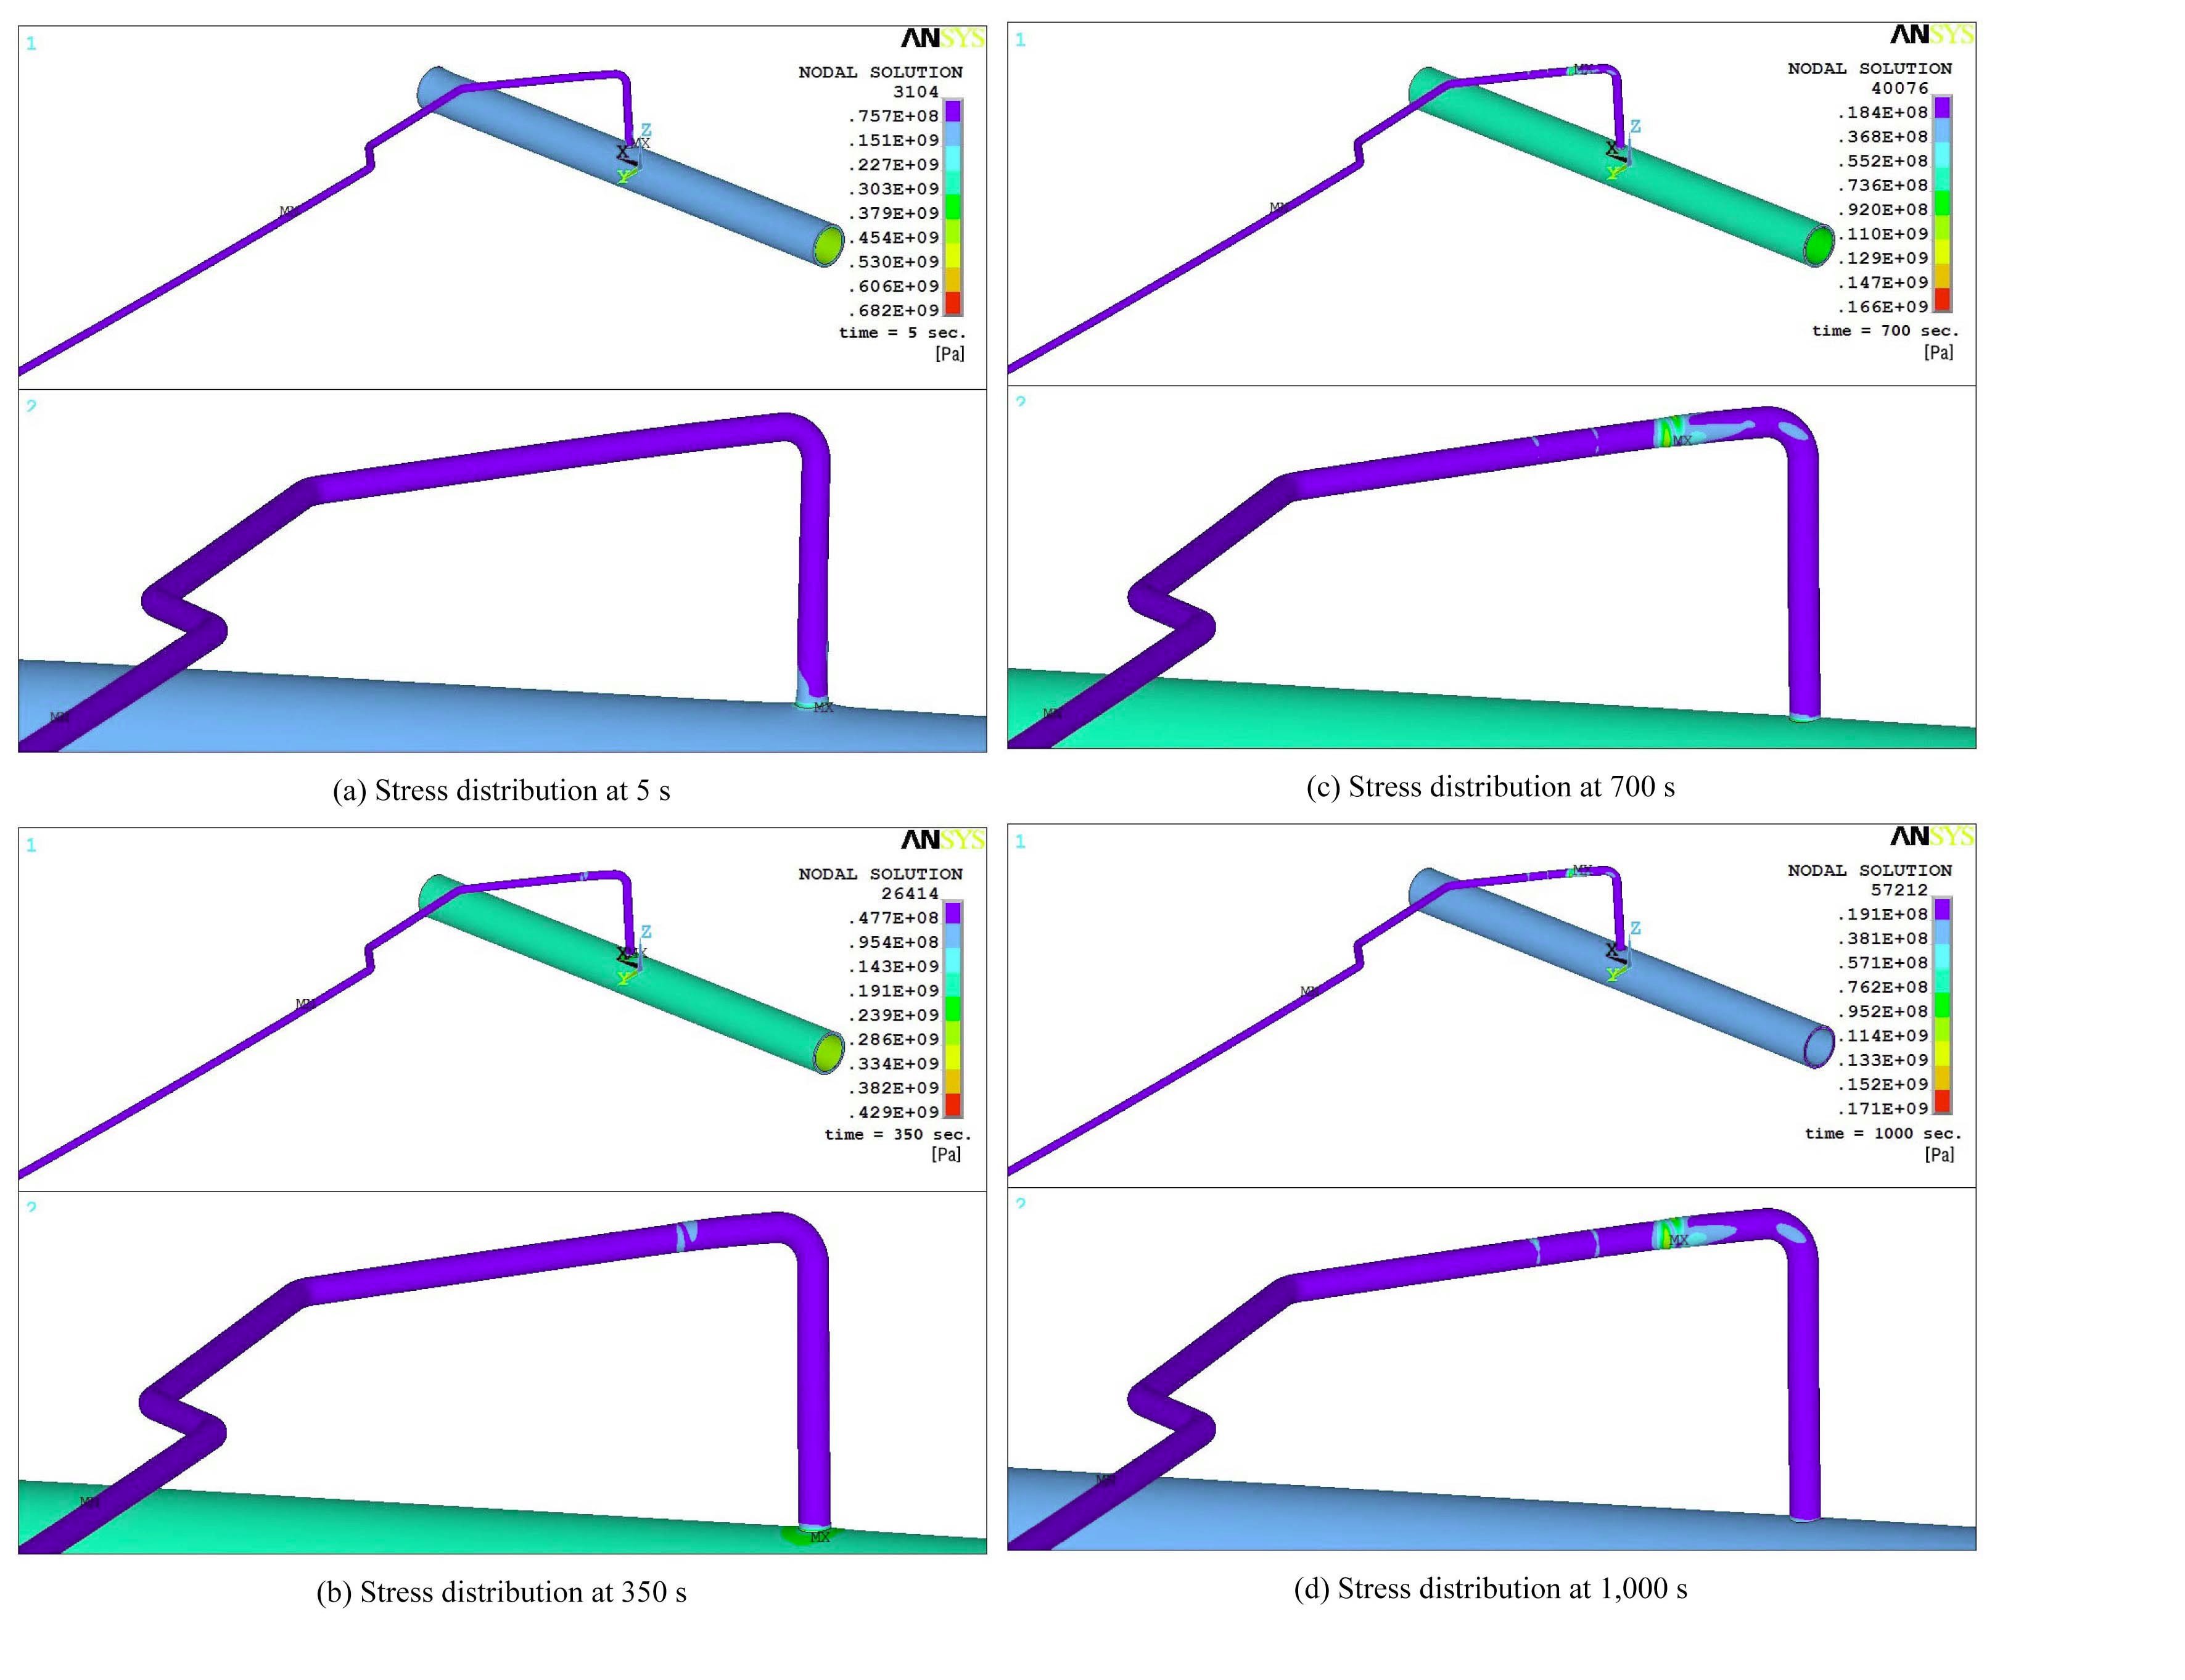
Figs. 10 and 11 shows the instantaneous distribution of von Mise stresses over the pipe in the in-leakage and out-leakage cases, respectively. Since there is a linear relationship between the stresses and temperature, the distribution of the von Mises stresses is similar to that of the temperature. As depicted in Figs. 10(a) and 10(b), in the type I in-leakage case, large stresses develop at the branch point before full generation of thermal stratification in the horizontal pipe. The bending deformation of the branch line, which is caused by geometric features, is believed to be the main factor of this excessive stress. However, because of the restriction in the movement of various springs and mechanical snubbers, which was not considered in this study, the excessive stresses at the branch line should sharply decrease in real situations. In addition, the location where maximum stress occurs changes with time according to the change in the temperature distribution. The maximum stress is observed at the front of the first valve where a complex temperature distribution is generated because of in-leakage after 700 s.
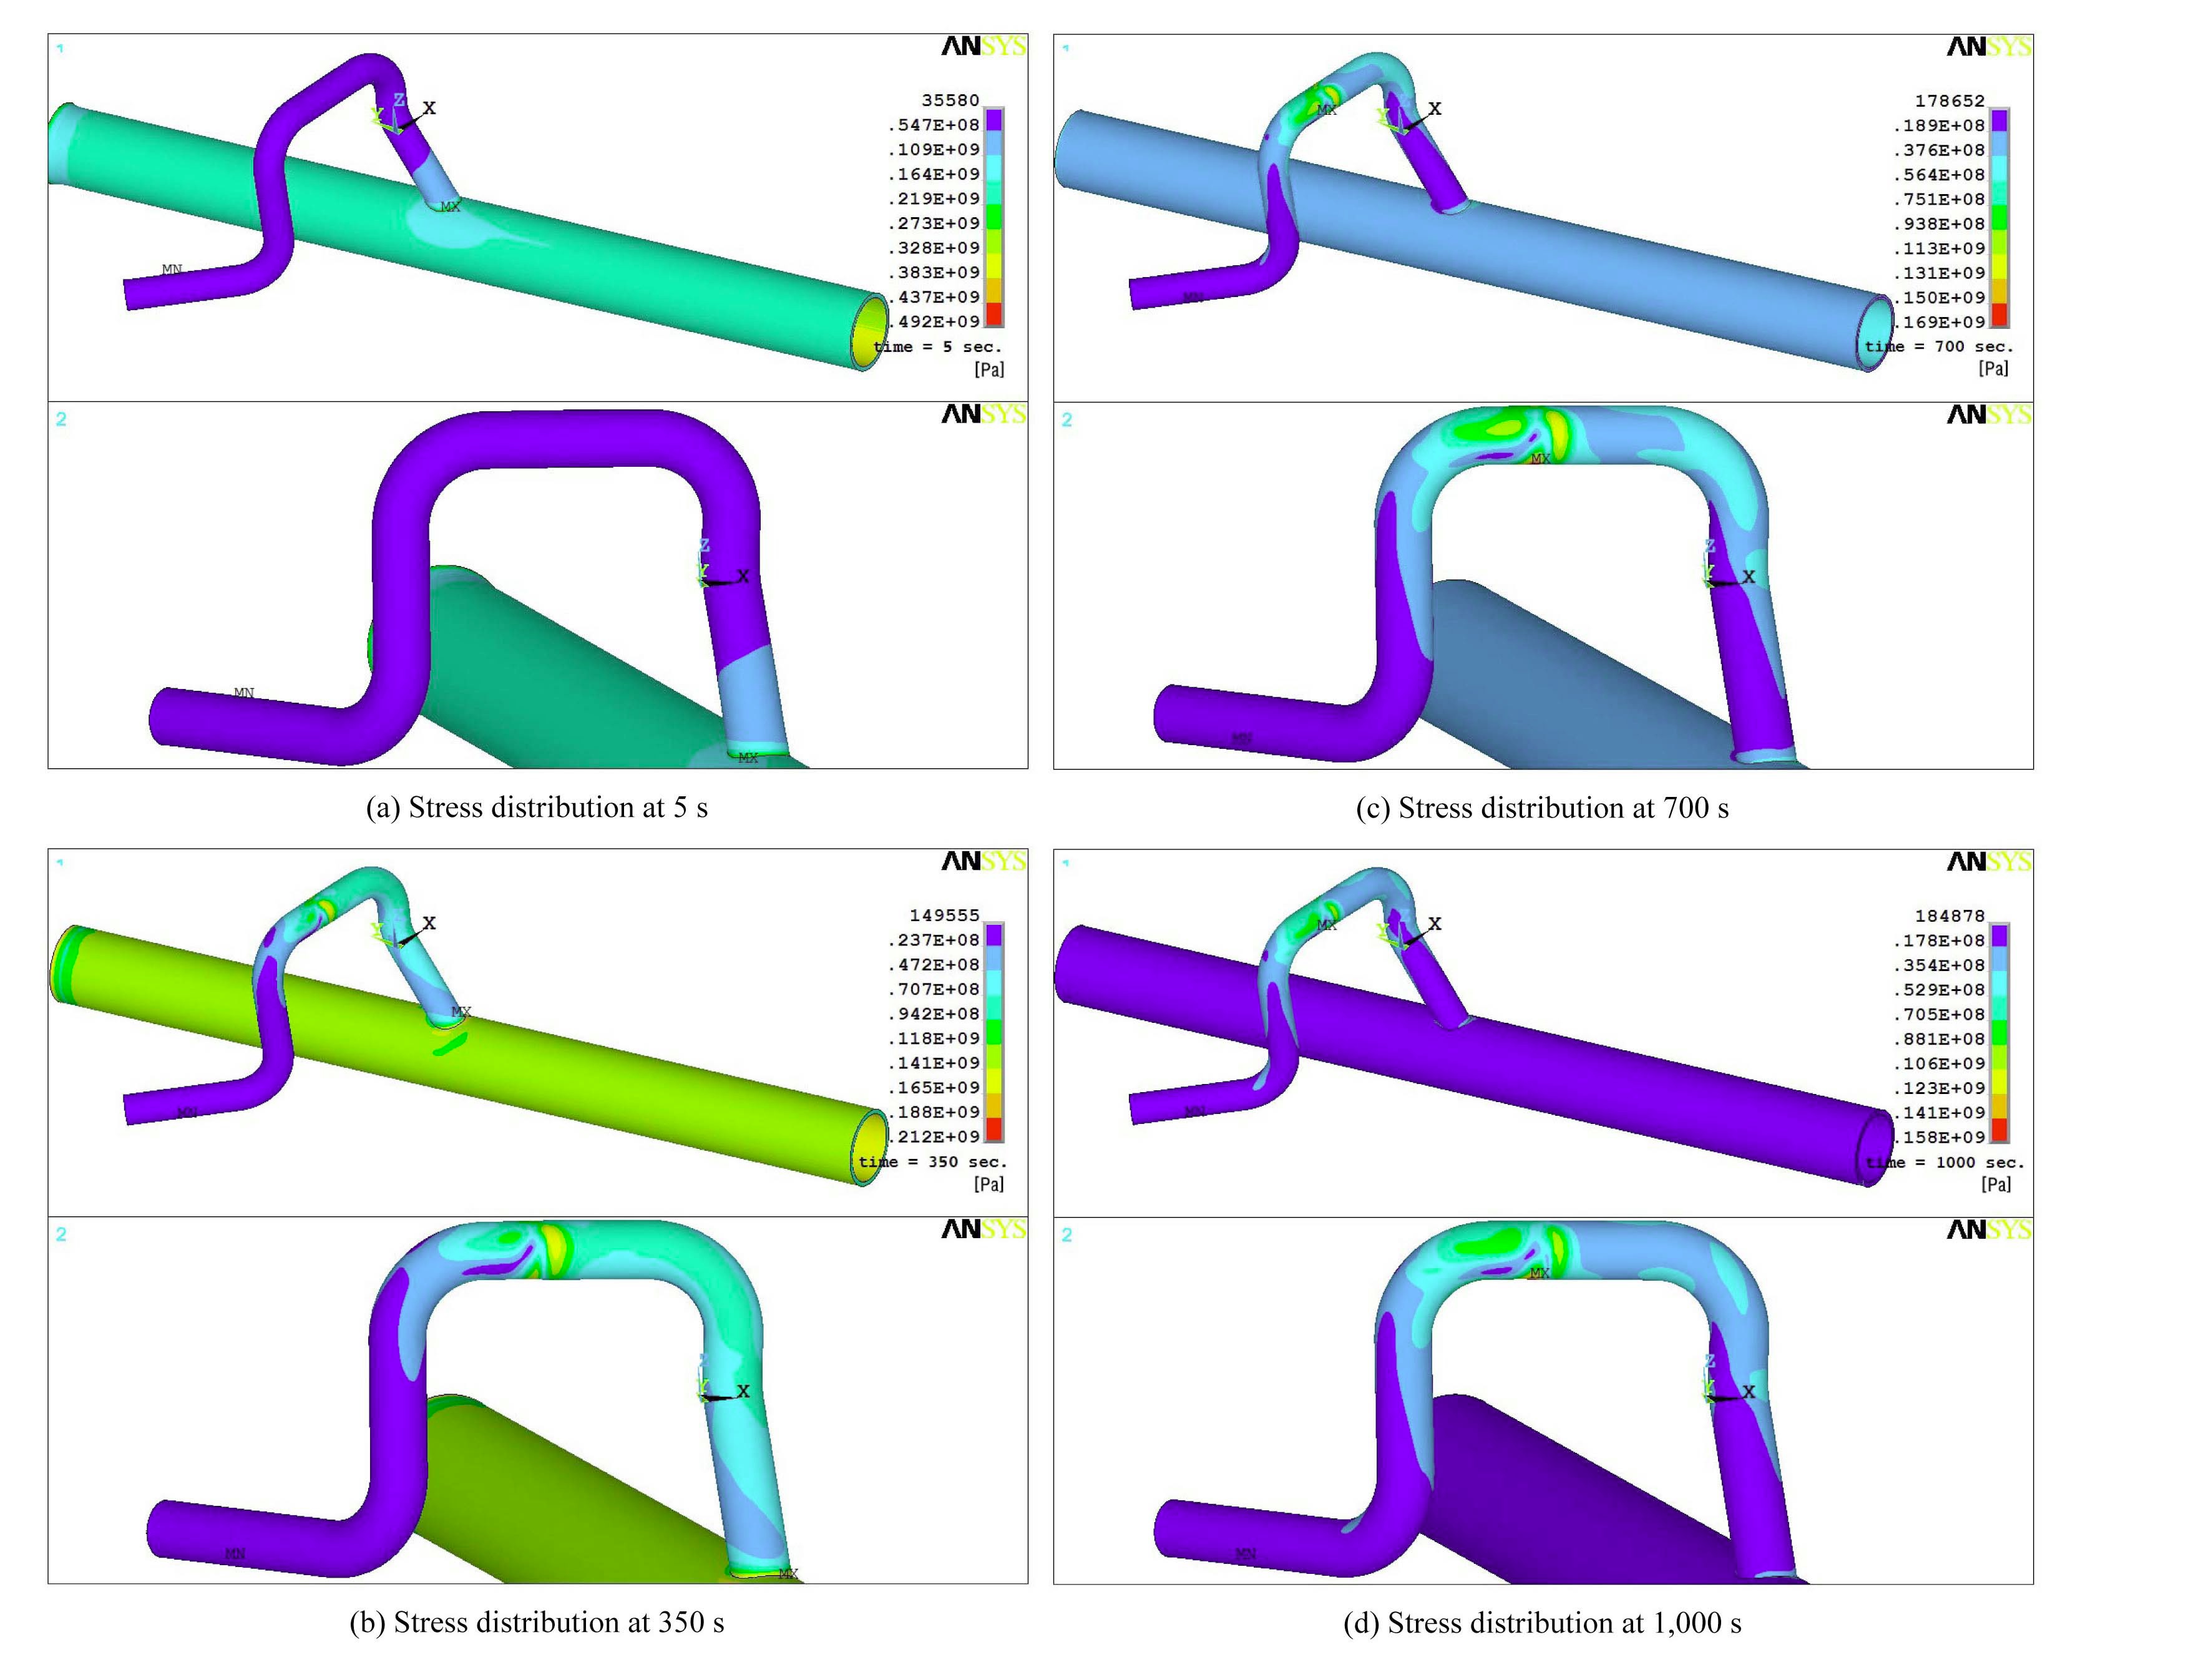
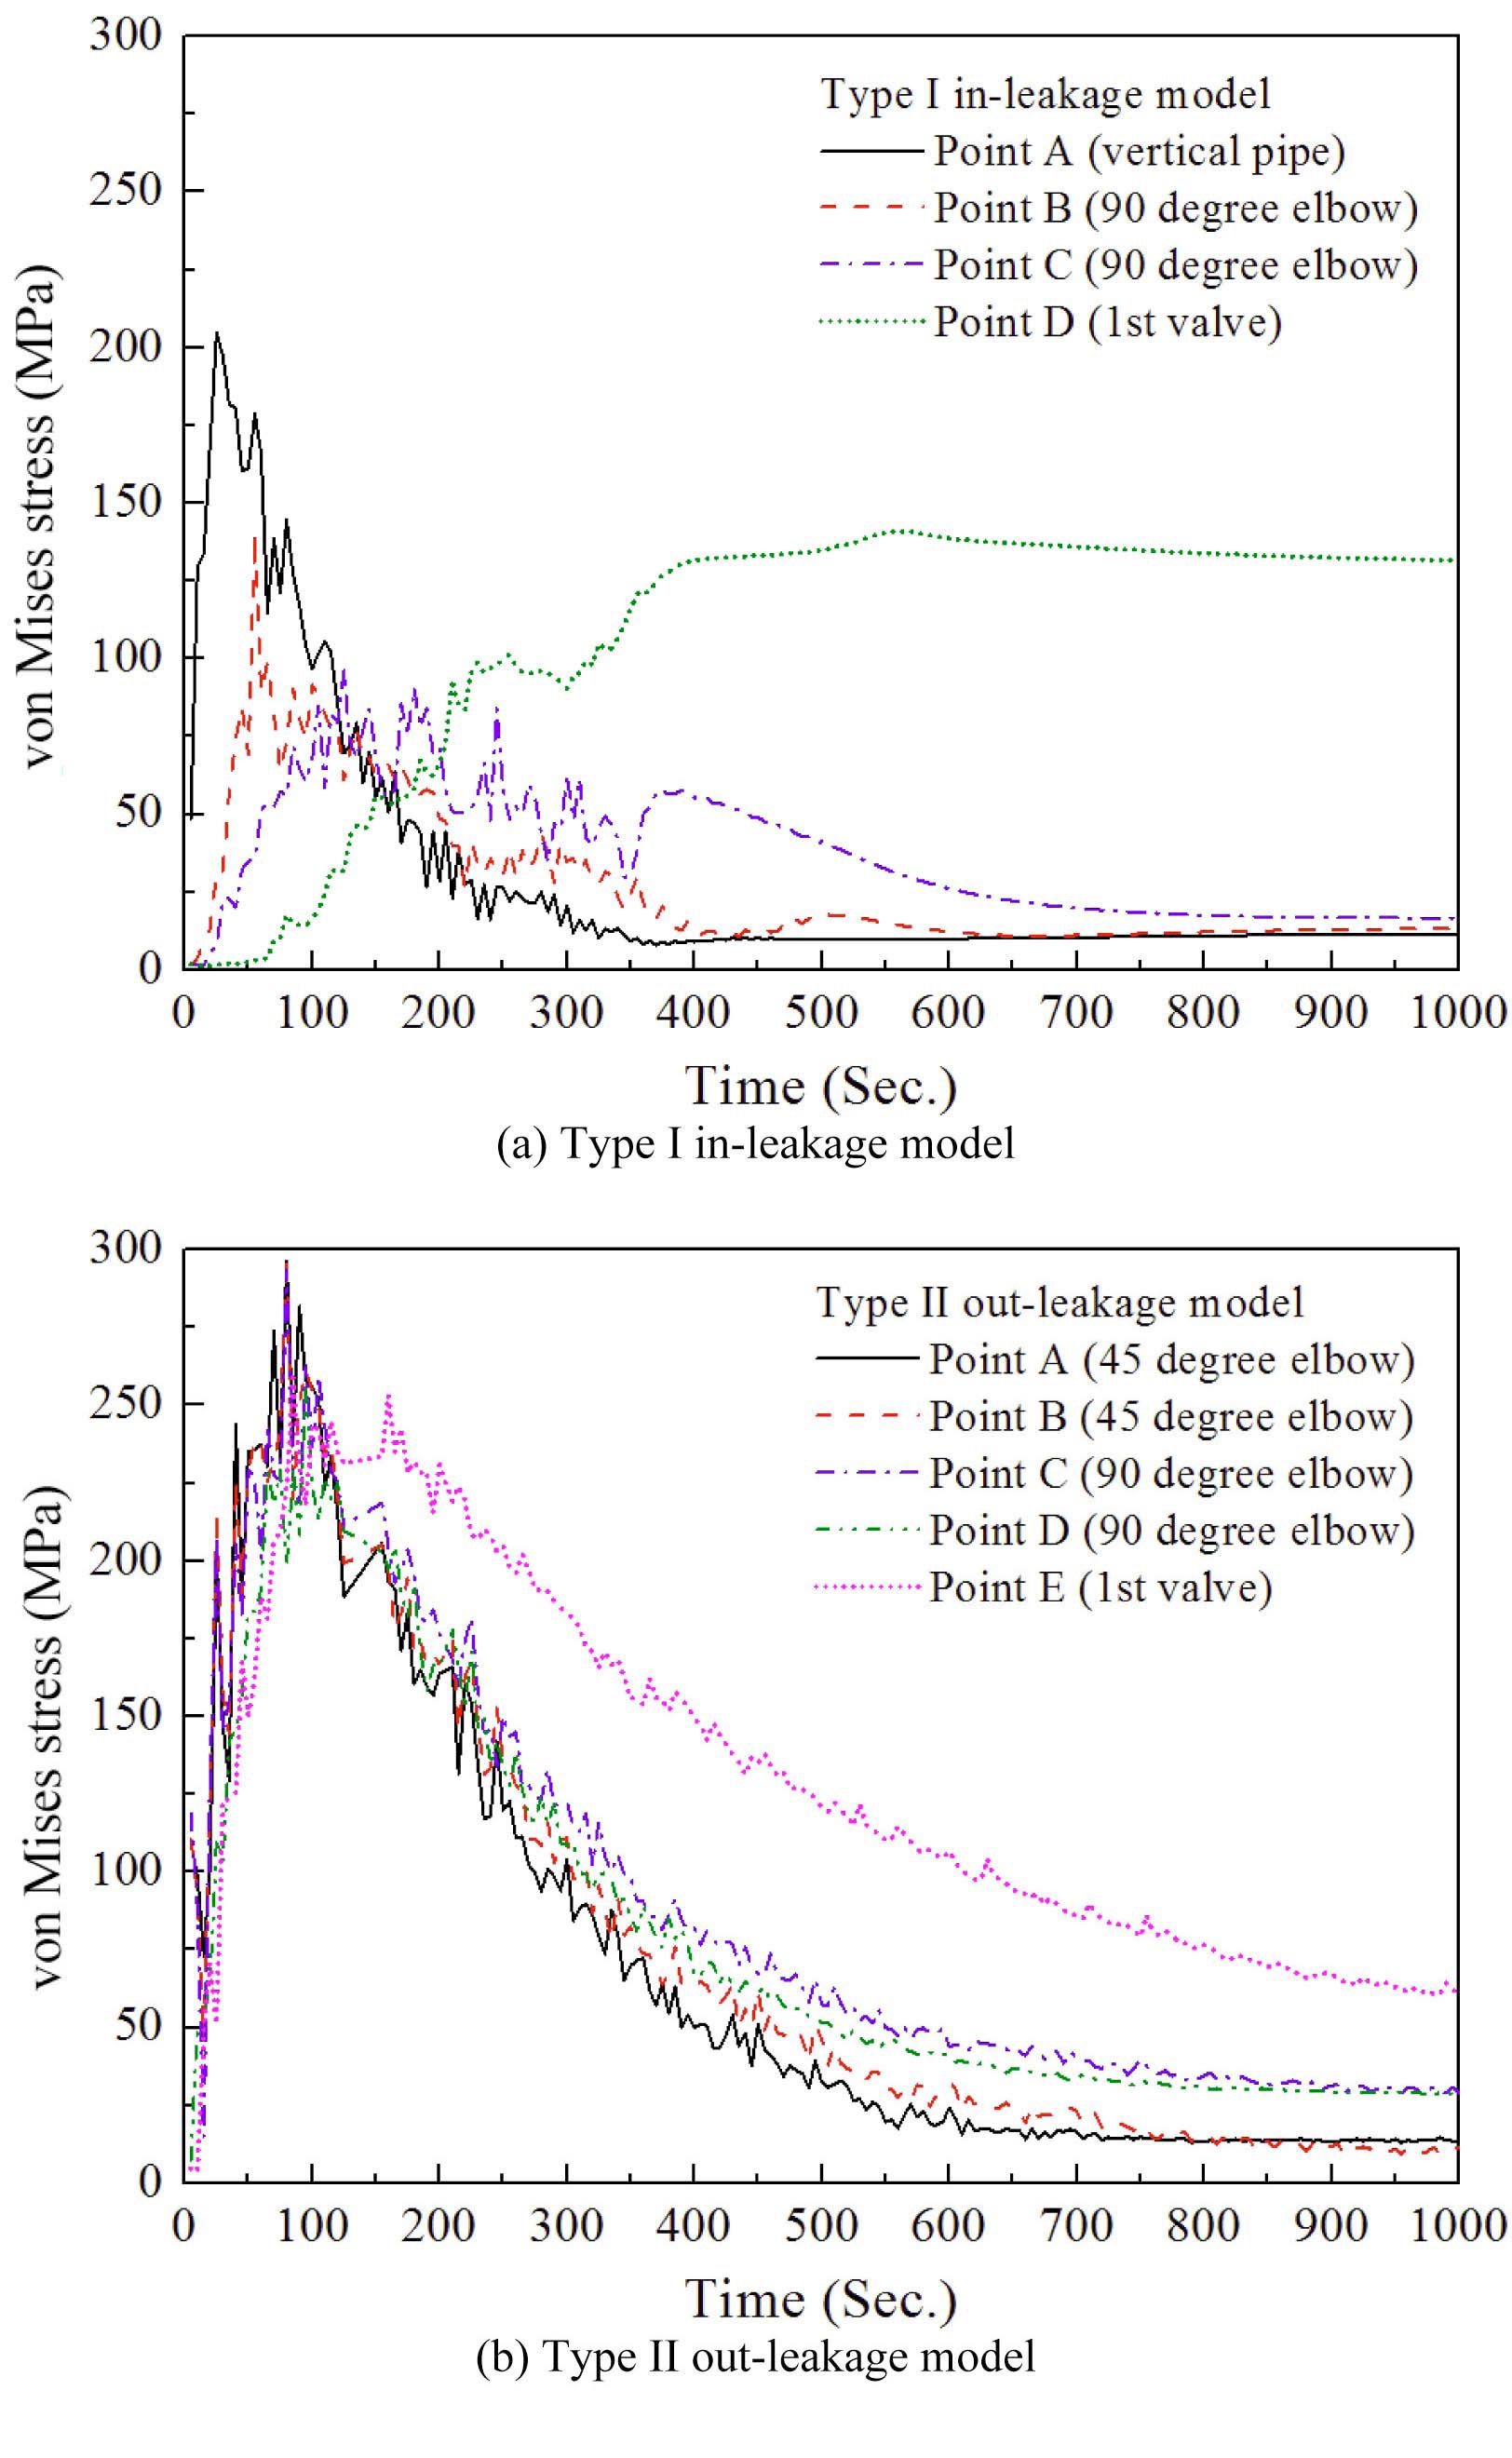
Although excessive maximum stress is generated at the branch point in the early stage of operating in the type II out-leakage model, the large stress should decrease considerably in real situations for the same reason as noted above. Similarly, the maximum stress is observed at the rear of the first valve where complex temperature distribution is generated because of out-leakage after 700 s. As a step toward understanding the relationship between von Mises stresses and temperature distributions with time, the transient evolutions of von Mises stresses were recorded at critical locations and these data are compared in Fig. 12.
As shown in Fig. 12, in the early stage of both cases, the peak stresses are generated because of rapid temperature change induced by turbulent penetration and bending
deformation of the branch line. However, since temperature changes are reduced when different temperature fluids mix, these stresses rapidly decline with time. In the inleakage case, the stresses at the vertical pipe and elbow rapidly decrease because of the relatively short horizontal
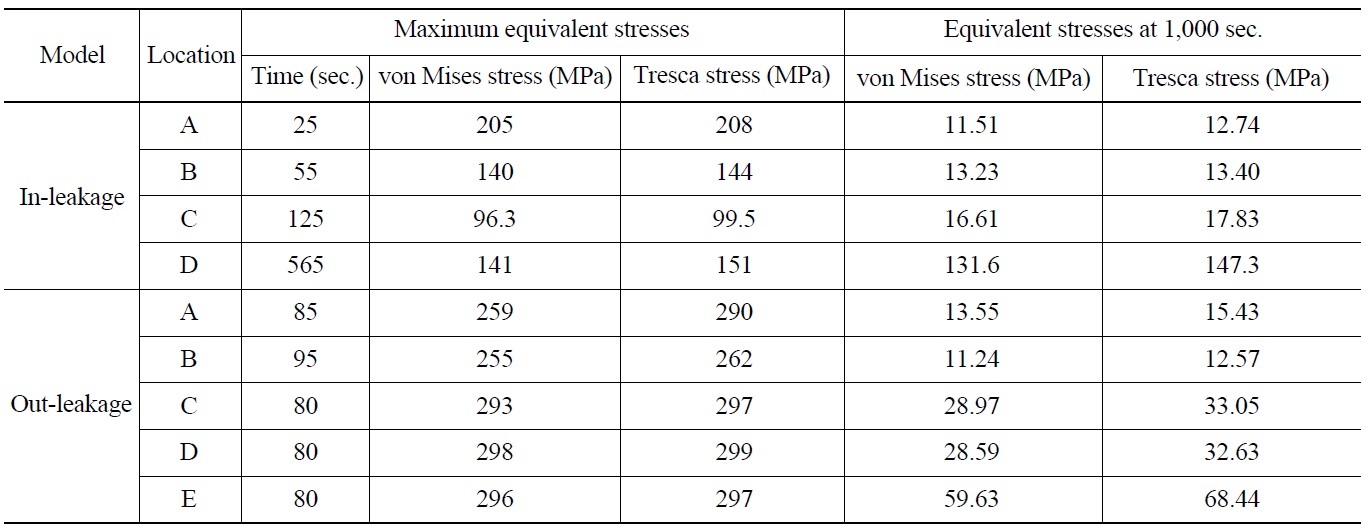
[Table 4.] Equivalent Stresses at Critical Locations

Equivalent Stresses at Critical Locations
pipe. However, the stress gradually increases at the front of the first valve in the in-leakage model until 550 s and maintains a certain value because of the temperature layer induced by in-leakage. Table 4 describes detailed information on the equivalent stresses such as von Mises and Tresca stress at each critical location.
In this study, the thermal effects of stratified flow caused by turbulent penetration and valve leakage were investigated by using a coupled CFD-FE method. Firstly, a detailed URANS CFD analysis involving conjugate heat transfer analysis was performed to obtain the transient temperature distributions in the wall of SIS piping subjected to stratified internal flows using commercial CFD code. The thermal loads from thermal hydraulic analysis were directly transferred to ANSYS Multi-physics, which was employed for the thermal stress analysis. From the thermal analysis, the response characteristics of two types of SIS piping subjected to transient thermal stratification loadings were investigated. The main conclusions of this work are summarized as follows:
(1) The coupled CFD-FE method is different from the numerical method of previous studies which used simplified temperature distributions and average heat transfer coefficients of the wall surface in stress analysis. This method can reduce the effort needed to calculate and define the heat transfer coefficient and lead to more realistic and accurate results.
(2) From the results of thermal hydraulic analysis, the most critical factor governing the thermal stratification was found to be valve leakage rather than turbulent penetration. In addition, temperature distribution significantly changes according to the leakage path. In the in-leakage case, complex temperature distribution is generated at the front of the first valve and stratified flow disappears slowly. In the out-leakage case, relatively smooth temperature distribution is generated at the rear of the first valve and stratified flow rapidly disappears because of natural convection.
(3) From the results of coupled CFD-FE analysis, we find that the distribution of the von-Mises stresses is similar to that of temperature. Significant thermal stresses are generated by the temperature layer induced by valve leakage. The stresses at most of the points rapidly decrease after several minutes regardless of leakage path. However, in the inleakage case, considerable thermal stresses are continuously developed near the first valve. Therefore, it is necessary to continuously perform the appropriate in-service inspection and evaluation on the stratified flow induced by in-leakage in the SI piping.
(4) The following points are left as future problems. Because thermal cycling and thermal striping can develop in this system, supplementary analyses will be carried out considering these phenomena. Furthermore, to derive evaluation criteria for classifying critical leakage rate, leakage area, and leakage location, parametric studies based on the coupled CFD-FE method and thermal fatigue analysis will be performed.
Cp Specific heat
D Nominal diameter of pipe in inch
F2 Blending Function
k Kinetic Energy
Pk Production rate of turbulence
T Temperature
U Flow velocity
κ Thermal conductivity
μ Viscosity
μt Turbulence viscosity
ρf Fluid density
ρref Reference density
ω Turbulence frequency
ΔT Temperature between top and bottom of inner wall
ΔTmax Maximum temperature between top and bottom of inner wall