A station blackout experiment called SBO-01 was performed at the ATLAS facility. From the SBO-01 test, the station blackout scenario can be characterized into two typical phases: A first phase characterized by decay heat removal through secondary safety valves until the SG dryouts, and a second phase characterized by an energy release through a blowdown of the primary system after the SG dryouts. During the second phase, some physical phenomena of the change over a pressurizer function, i.e., the pressurizer being full before the POSRV 1st opening and then its function being taken by the RV, and the termination of normal natural circulation flow were identified. Finally, a core heatup occurred at a low core water level, although under a significant amount of PZR inventory, whose drainage seemed to be hindered owing to the pressurizer function by the RV. The transient of SBO-01 is well reproduced in the calculation using the MARS code.
KAERI (Korea Atomic Energy Research Institute) has been operating an integral effect test facility, ATLAS (Advanced Thermal-Hydraulic Test Loop for Accident Simulation), for accident simulations pertaining to the OPR1000 (Optimized Power Reactor, 1000MWe) and the APR1400 (Advanced Power Reactor, 1400MWe), which are in operation and under construction in Korea, respectively [1,2].
After the Fukushima accidents from an earthquake followed by a tsunami that impacted the east coast of Japan on March 11, 2011, the concept of a boundary between the design basis and beyond-design basis accidents became obscure. One scenario is the station blackout (SBO), which is defined as ‘the loss of all alternating current (AC) power in a nuclear power plant’ by the USNRC 10CFR50 Section 50.63, which adopted a new safety regulation for the SBO in June of 1988. Various kinds of researches on the SBO were performed during the 1980’s, as summarized by Liu et al. [3], who investigated a counterpart test based on the same scenarios as those of the full-height, full-pressure large-scale test facility (LSTF) of JAEA using an INER integral system test (IIST). Actually, the SBO that occurred in Fukushima seemed to go beyond the definition of the current SBO scenario. In the mean time, numerous researches have been conducted on the safety concern of the SBO for existing and advanced nuclear power plants worldwide. From the internal review of an SBO scenario, it was concluded that a better understanding of the thermo-hydraulic phenomena occurring within the reactor coolant system is a prerequisite, even though it seems to be a fairly simple sequence of events. This was the motivation of an SBO test using the ATLAS facility.
In order to have a clearer understanding of the physical phenomena within the primary system, an SBO was assumed with simple initial and boundary conditions, e.g., start of an SBO at time zero, no diesel and AC powers, no auxiliary feedwater pumps (motor-driven and turbinedriven), etc. In this paper, an overview of the SBO test results is described including the results of analytical calculations simulating the SBO test using the MARS code [4].
2. THE ATLAS FACILITY AND TEST DESCRIPTION
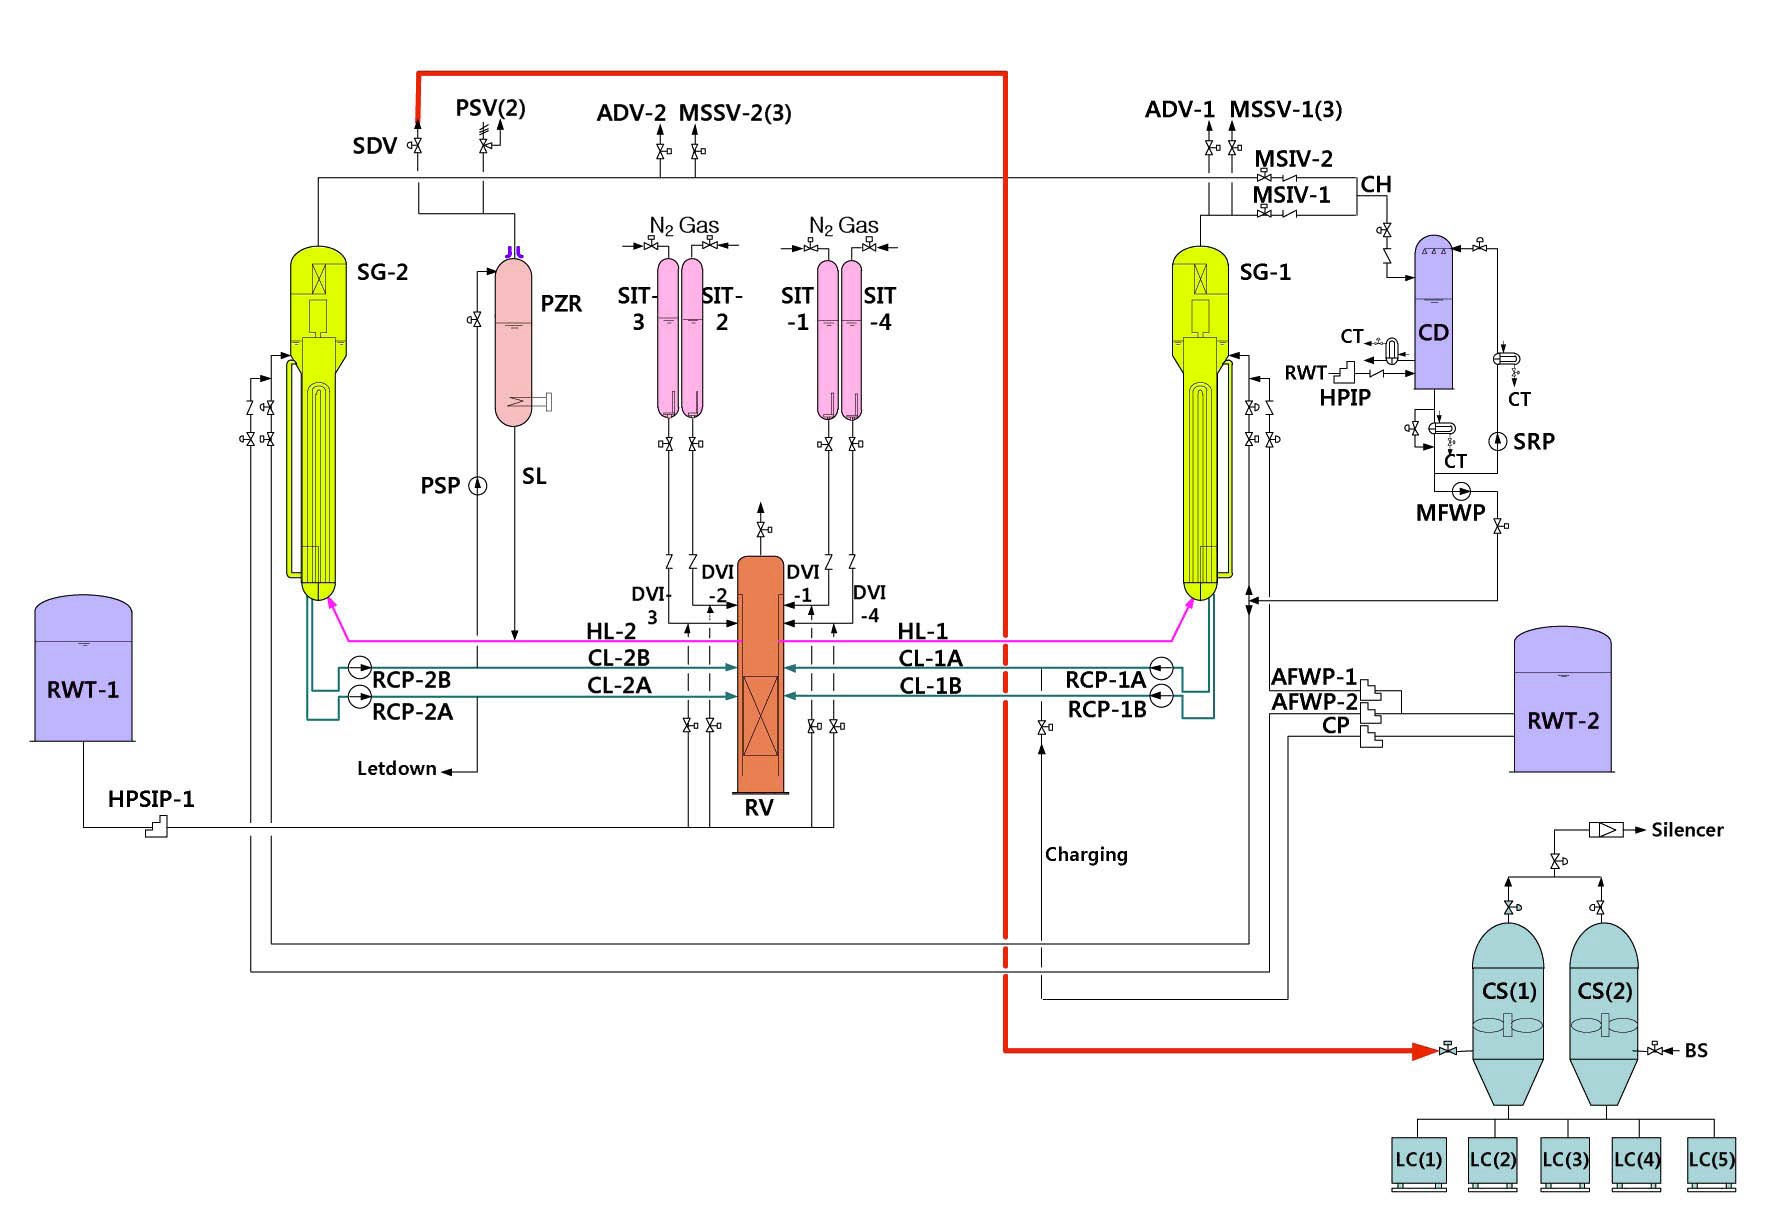
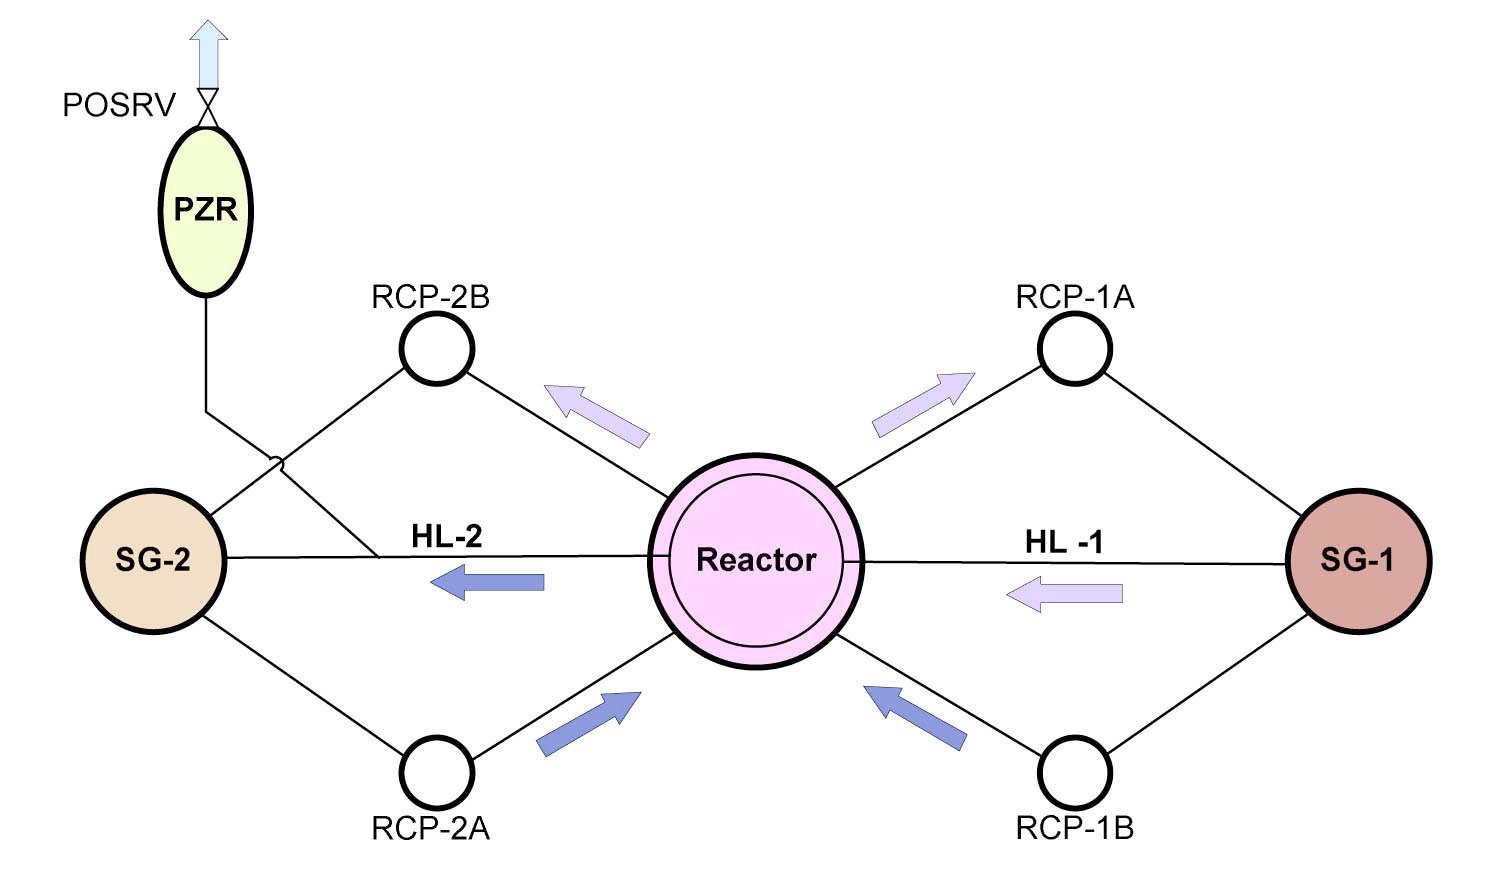
ATLAS is a large-scale thermal-hydraulic integral effect test facility for advanced PWRs, the APR1400 and OPR1000 [5,6]. It can simulate a wide range of accident and transient conditions including a station blackout. Information on the ATLAS program, the major design characteristics, scoping analyses, commissioning test results, and some major test results, can be found in the literature [7~12]. Fig. 1 shows a flow diagram of the ATLAS facility for a station blackout test.
The scaling ratios of ATLAS to APR1400 for some major geometrical and thermal-hydraulic parameters are shown in Table 1. It has a geometrical scaling ratio of 1/2 in length and height, 1/288 in volume, and operates at prototypical primary thermal conditions, i.e., the same system pressure and temperature distribution as the APR1400. According to the scaling law, the time ratio is proportional to the square root of the height ratio, and thus the time ratio of ATLAS to APR1400 is 1/1.414, which means the ATLAS scenario is 1.414 times faster than the APR1400 scenario. A more detailed discussion on the scaling principle of ATLAS can be found in Kim et al.’s [6].
[Table 1.] Major Scaling Ratios of ATLAS to APR1400
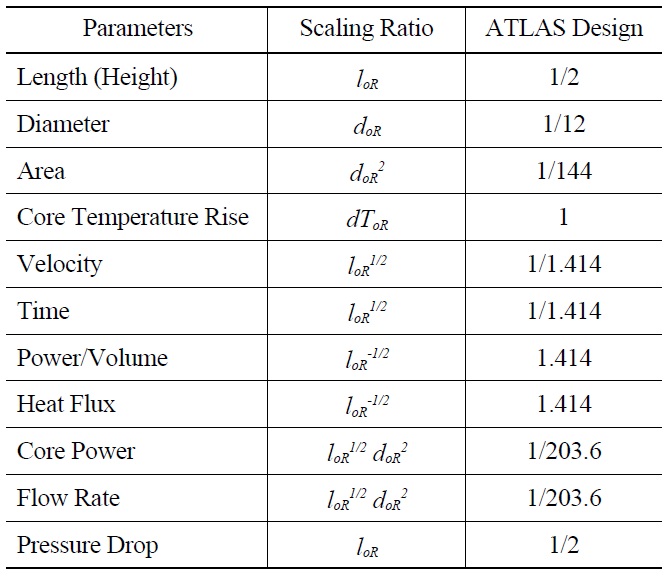
Major Scaling Ratios of ATLAS to APR1400
2.2 Experimental Conditions and Procedure of the Station Blackout Test
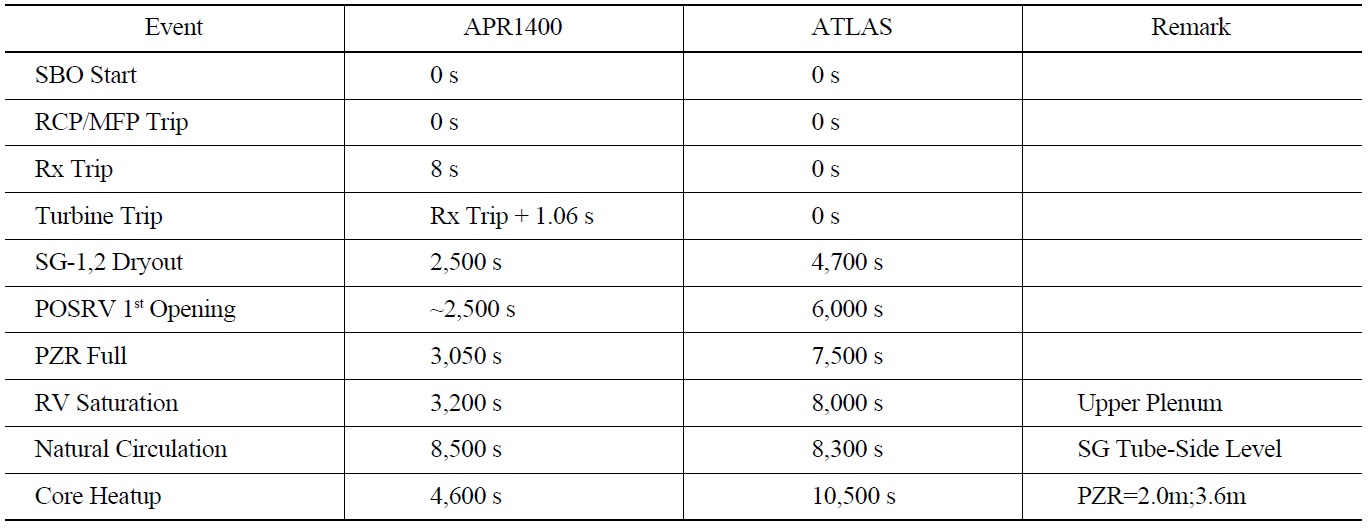
A station blackout test of ATLAS, named SBO-01, was performed according to the following experimental procedure. Essentially, the experimental conditions for the present test were determined by a pre-test calculation with a best-estimate thermal hydraulic code, MARS. Initially, a transient calculation was performed for the station blackout of the prototypic plant, APR1400, to obtain the initial reference and boundary conditions. A best-estimate safety analysis methodology which is now commonly accepted in the nuclear community, was applied to the transient calculation of the APR1400. The pre-test calculation was conducted with the assumption that the loss of on-site and off-site powers occur simultaneously with the failure of the emergency diesel generators and the auxiliary feedwater system including turbine-driven pumps. As for the core power, a conservative 1973 ANS decay heat curve with a 1.2 multiplication factor was used in the transient calculation. Table 2 summarizes the preliminary results of the MARS analyses for the APR1400 and ATLAS. As shown in the table, the overall behaviors of the sequence of events for the station blackout showed similar trends between the reference plant and the test facility.
2.3 Overview of the Station Blackout Test, SBO-01
The SBO-01 test was performed at the same pressure as the reference plant, the APR1400. The temperature distribution along the primary loop was also preserved. The primary inventory was heated with core heaters to its specified steady state condition and was pressurized until the primary system reached a steady state condition. During the primary heat-up process, the secondary system was also heated up to a specified target hot condition by controlling the heat removal rate from the primary system. Under a steady state condition, the core power generated by electrical heaters was balanced with the energy removal by the secondary system. The obtained steady state condition was maintained to stabilize the system behavior of ATLAS for more than 10 minutes, and the test then began by recording the DAS data. The core heater power was initially 8% of the scaled full power and programmed to then follow a decay power table. Using the decay power table, 120% of the ANS73 decay curve was simulated. From the sequence of events of the SBO scenarios, if the core is uncovered, the core temperature will increase to a very high value. To protect the core simulated by electrical heaters in ATLAS, 500 ℃ was selected as the temperature limit for the core heatup simulation, and a core protection
[Table 2.] Summary of Preliminary MARS Analyses for the APR1400 and ATLAS
Summary of Preliminary MARS Analyses for the APR1400 and ATLAS
[Table 3.] Summary of Sequence of Events of the SBO-01 Test
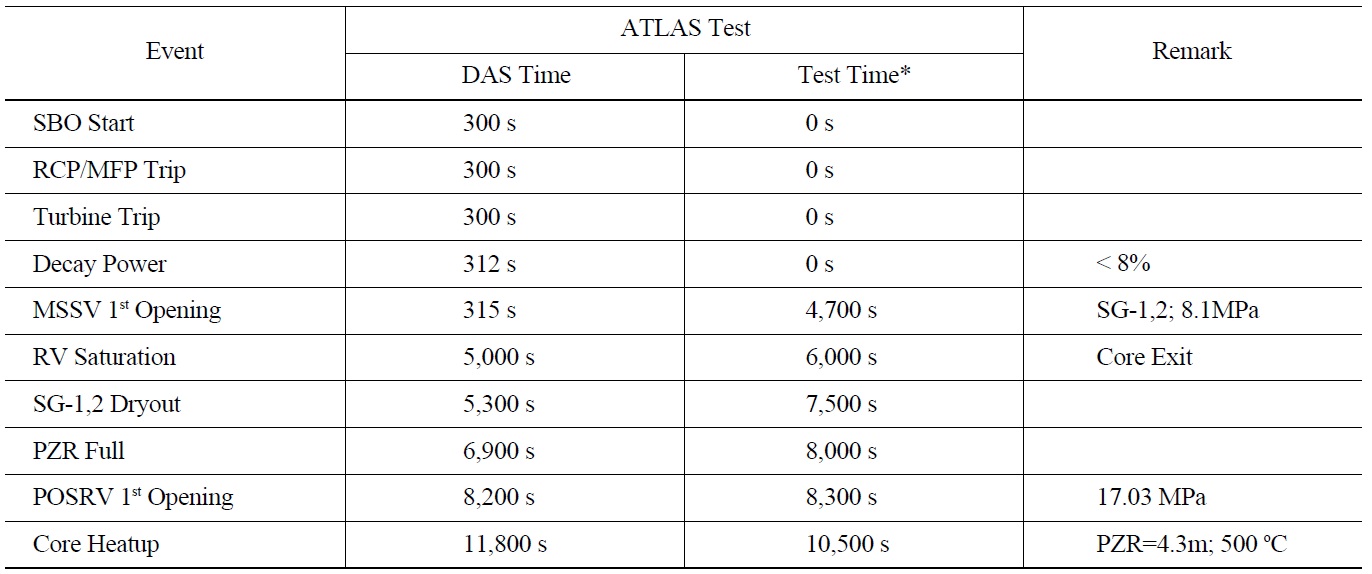
Summary of Sequence of Events of the SBO-01 Test
signal occurred at around 11,500 seconds during the test. Table 3 summarizes the major sequence of events of the SBO-01 test.
3. OVERVIEW OF THE SBO-01 TEST RESULT
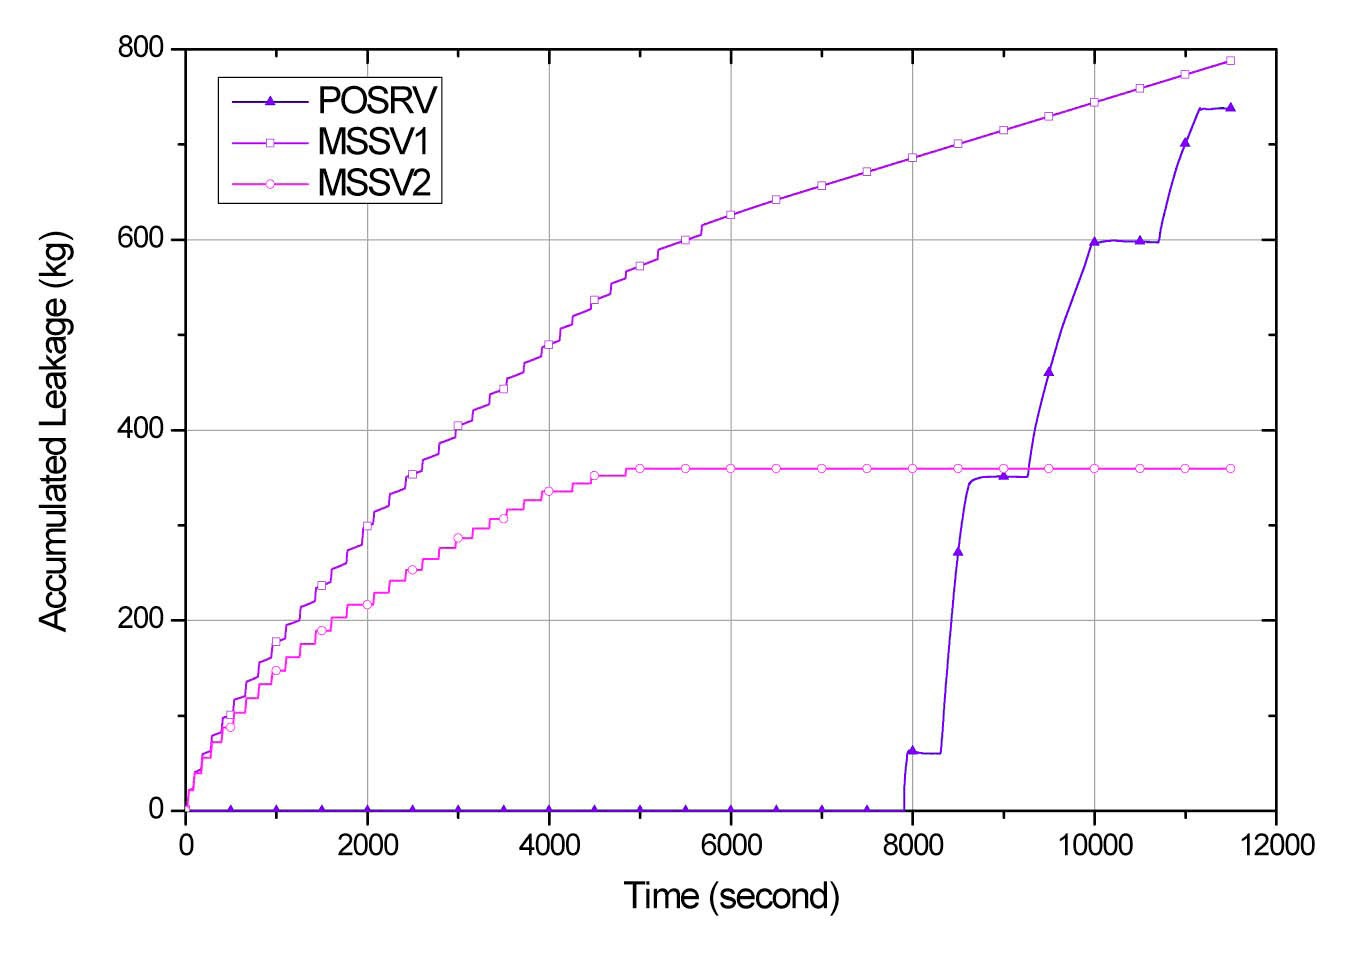
Moments after the testing commenced, the steam generator pressure increased sharply owing to the turbine trip, and subsequently, the main steam safety valves (MSSVs) were opened at 15 seconds, and open/close actuations of the MSSVs then occurred periodically until the steam generators became empty, as shown in Fig. 2. The stream generators became nearly empty around at 4,500 seconds with several subsequent open/close actuations of the MSSVs. Specifically, the lower level tap of the wide range of the steam generator, e.g. LT-SGSDRS1- 01, was located at 490 mm above the tubesheet, and the actual dryout of the steam generators was estimated using the extrapolation of the level trends. The estimated dryout time was 5,000 seconds, which is equivalent to the end point of the last opening of MSSVs. After the SG dryout, the secondary pressure would be dependent on the heat transfer through the tube bundle from the primary system and the heat loss through the steam generator vessel and the main steam lines. Although this effect might be considerable, the secondary pressure seemed to decrease quite dramatically. From the test data, a small amount of leakage through the MSSV-1 was found, as depicted in Fig. 3. Fig. 3 shows the accumulated leakages through the MSSV- 1 and -2. As shown in the figure, there was a small amount of leakage through the MSSV-1 for the whole test period, which would be the main reason of the depressurization of the secondary system. From a separate evaluation of the leakage, the effect of the MSSV-1 leakage would not affect the transient until SG dryout. Consequently, the rest of the transient, the heat removal due to the leakage, was estimated as about 19% of the decay heat level.
The pressurizer pressure decreased to just below 10 MPa after the SG dryout, which seemed to be from the heat loss effect through the pressurizer vessel and the heat removal through the steam generators. When the heat removal through the steam generators became negligible, the primary pressure started to increase until the opening setpoint of the power operated safety relief valve (POSRV). For the SBO-01 test, a total 4 POSRV openings occurred at 7,900, 8,300, 9,250, and 10,700 seconds, respectively. The accumulated leakage for the POSRV openings is also shown in Fig.3.
3.2 Primary System Water Levels
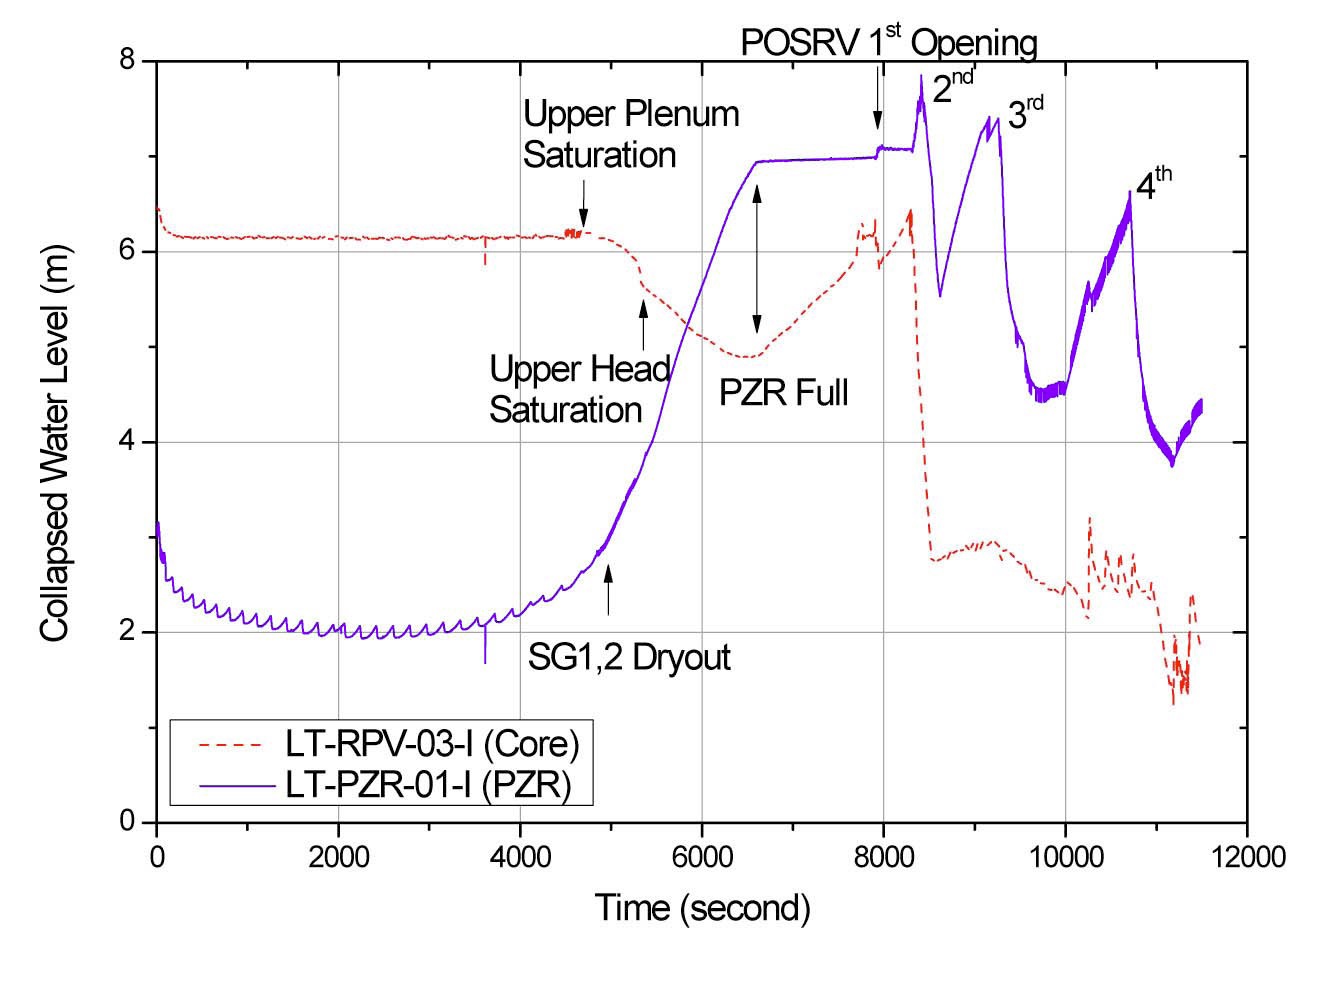
The pressurizer (PZR) water level decreased until the effective heat removal through the steam generators, e.g., around 3,000 seconds, and then started to increase, as shown in Fig. 4. After the SG dryout, the PZR water level increased sharply until the PZR returned to a full condition. The ripples of the water level seemed to be due to the effects of the open/close of MSSVs and had disappeared after the SG dryout. After the POSRV 1st opening, the PZR water level showed extremely large oscillations with decreasing/increasing trends depending on the POSRV opening/closing, respectively. The water level of the reactor vessel (RV) showed different but very connected trends with respect to that of the PZR. The RV level seemed to start decreasing, triggered by the saturation condition of the RV upper plenum, and showed quite a large decrease until the PZR was full owing to the saturated condition of the RV upper head. Here, it would be note worthy that the RV had taken over the pressurizer function after the saturated condition of the upper plenum and/or the upper head. This means that after the exchange of a pressurizer function, the PZR provides only a function of flow path with volume, like a buffer tank. When the core reached a core heatup at 500 ℃, the core water level was 1.8m, and the PZR, 4.4 m (> 60%), which is a significant amount of inventory for prolonging the core heatup occurrence in the core if used properly.
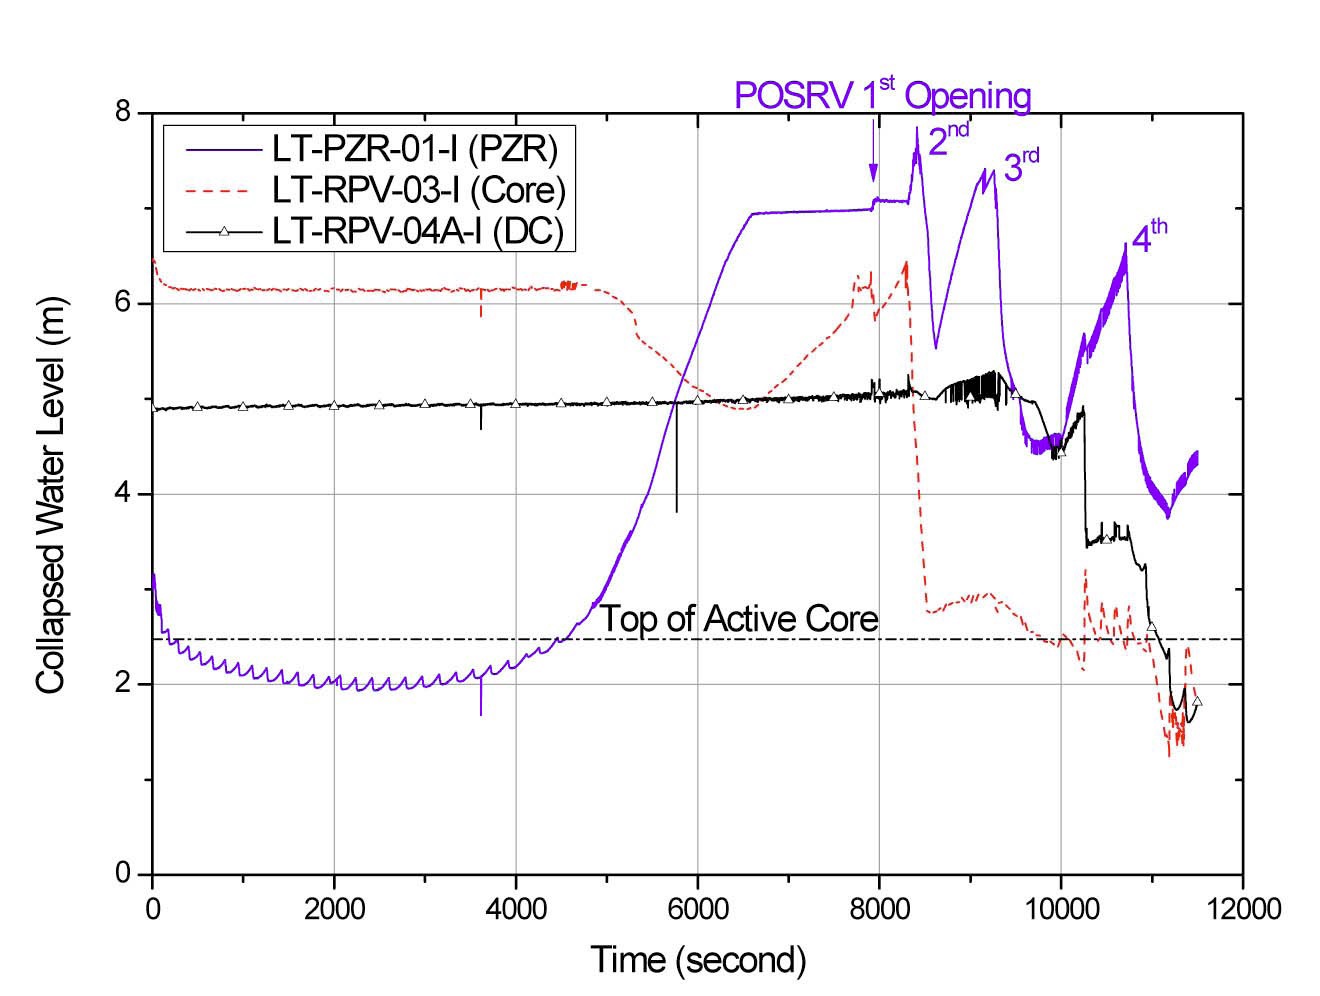
The downcomer (DC) water level remained full until
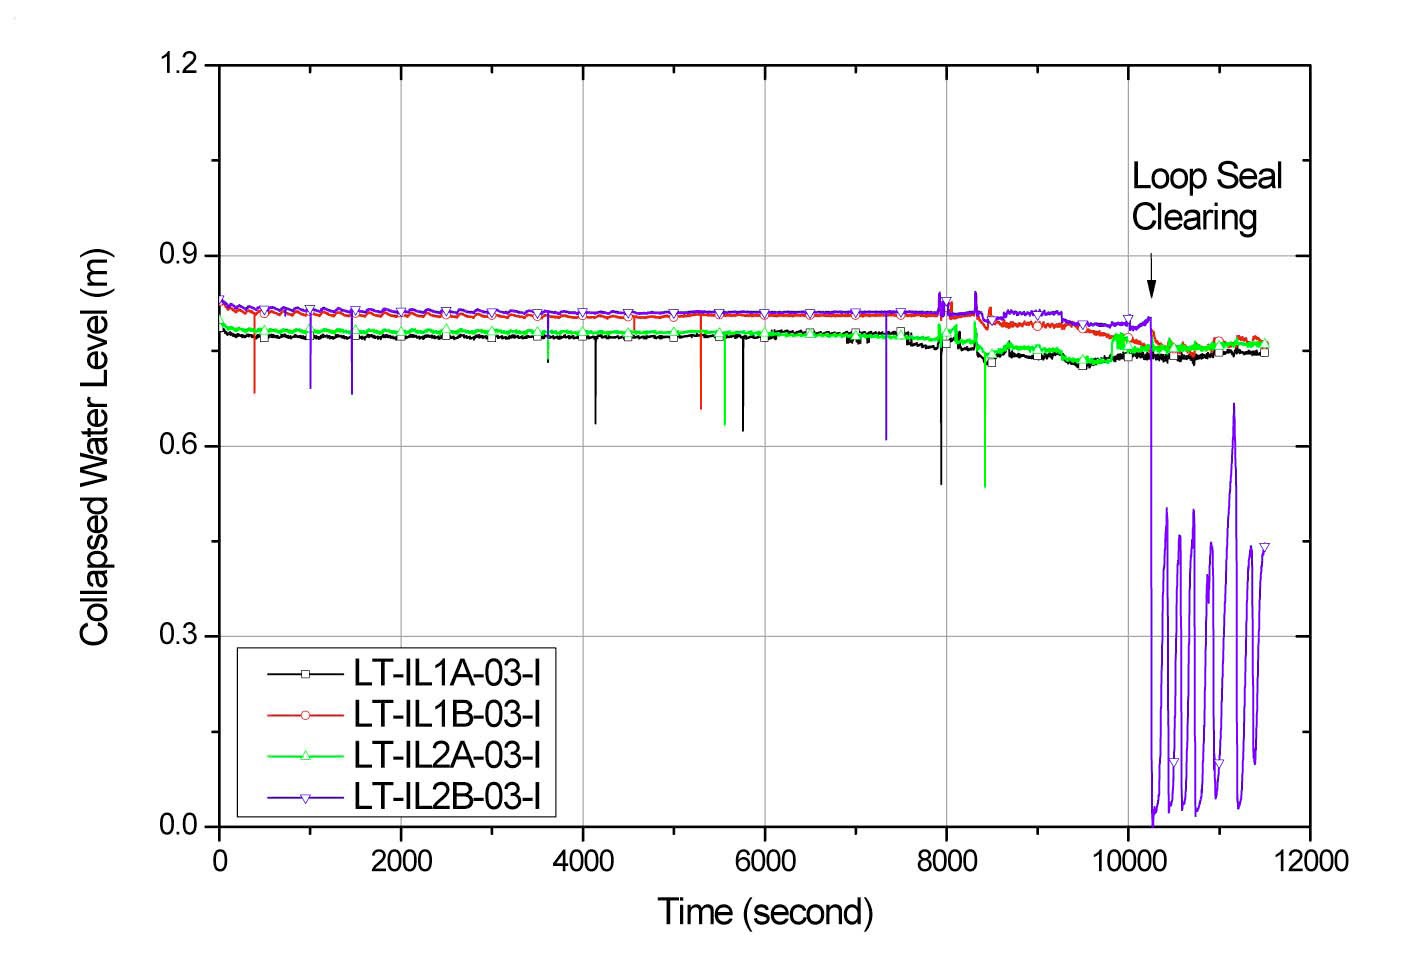
the POSRV 3rd opening, and then started to decrease according to the POSRV opening/closing as shown in Fig. 5. As noted above, as the pressurizer function was taken over by the RV after the saturated conditions of the upper plenum and upper head, the pressurization of the RV by boiling in the core region might prohibit decreasing the DC water level. The DC water level seemed to start decreasing abruptly after the RV water level reached around the top of the active core (2.5m) with the occurrence of a loop seal clearing in the intermediate leg, 2B (IL-2B), as shown in Fig. 6.
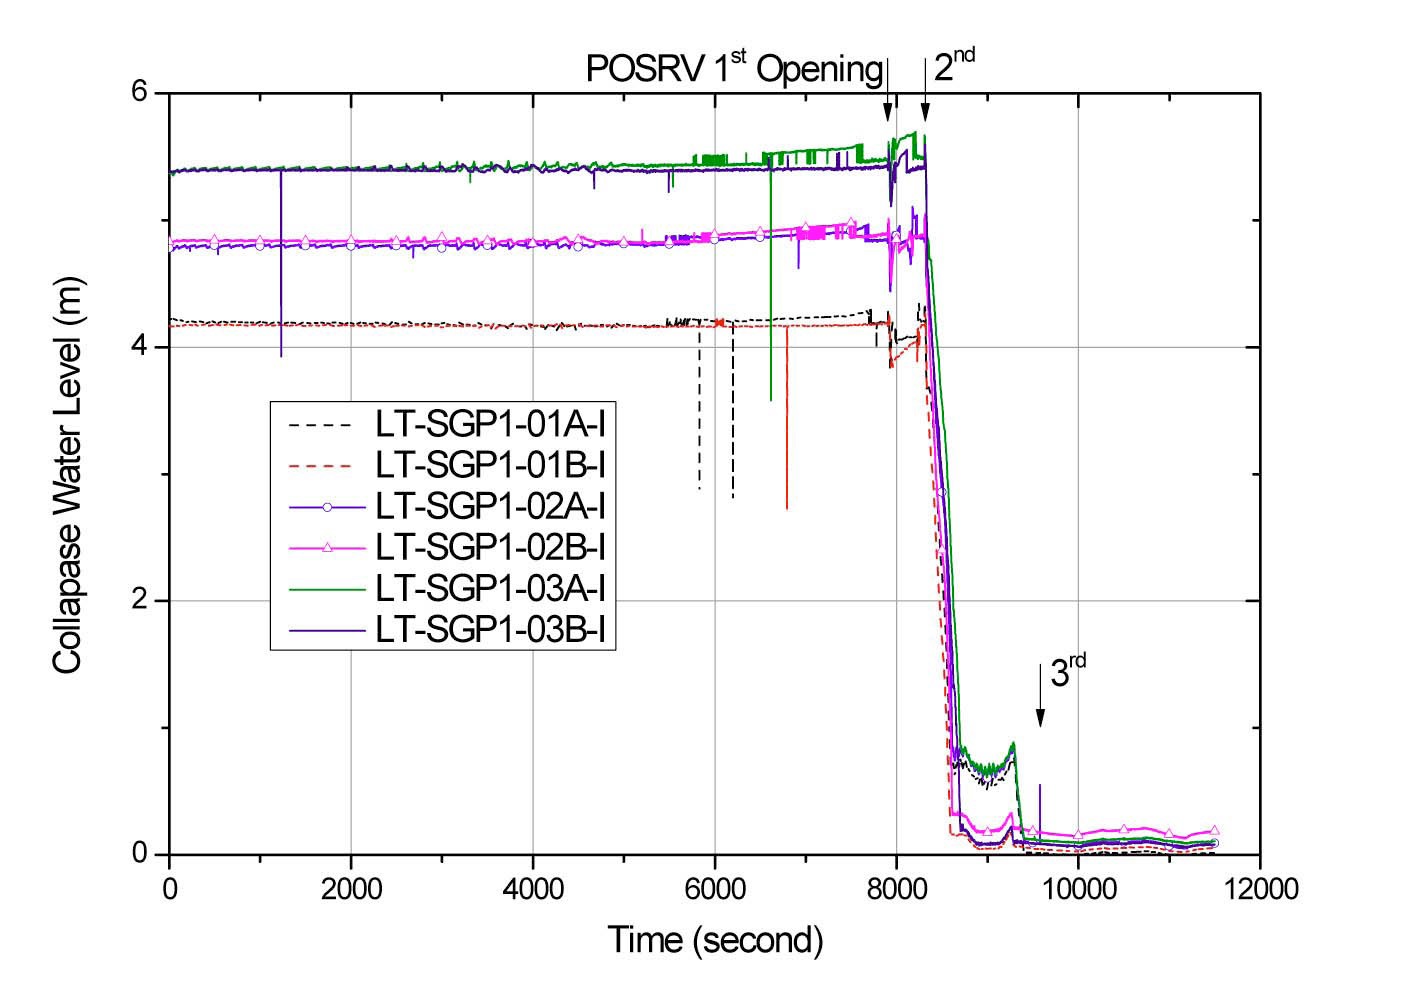
The SG tube-side water level represented the loop flow characteristics of natural circulation. Figs. 7 and 8 showed the tube-side water level of the two steam generators (SGs), respectively. As shown in the two figures, the tube-sides were full until the POSRV 2nd opening, e.g., around 8,300 seconds. This means that the water flow of a normal natural circulation was broken after the POSRV 2nd opening. The SG-1 tube-side water level started to empty after the POSRV 2nd opening, and the SG-2, after the POSRV 3rd opening at around 9,250 seconds. The SG-2 is connected to hot leg no. 2 (HL-2) on which the PZR is connected, which is why the tube-side water level in the SG-2 was sustained longer than the SG-1.
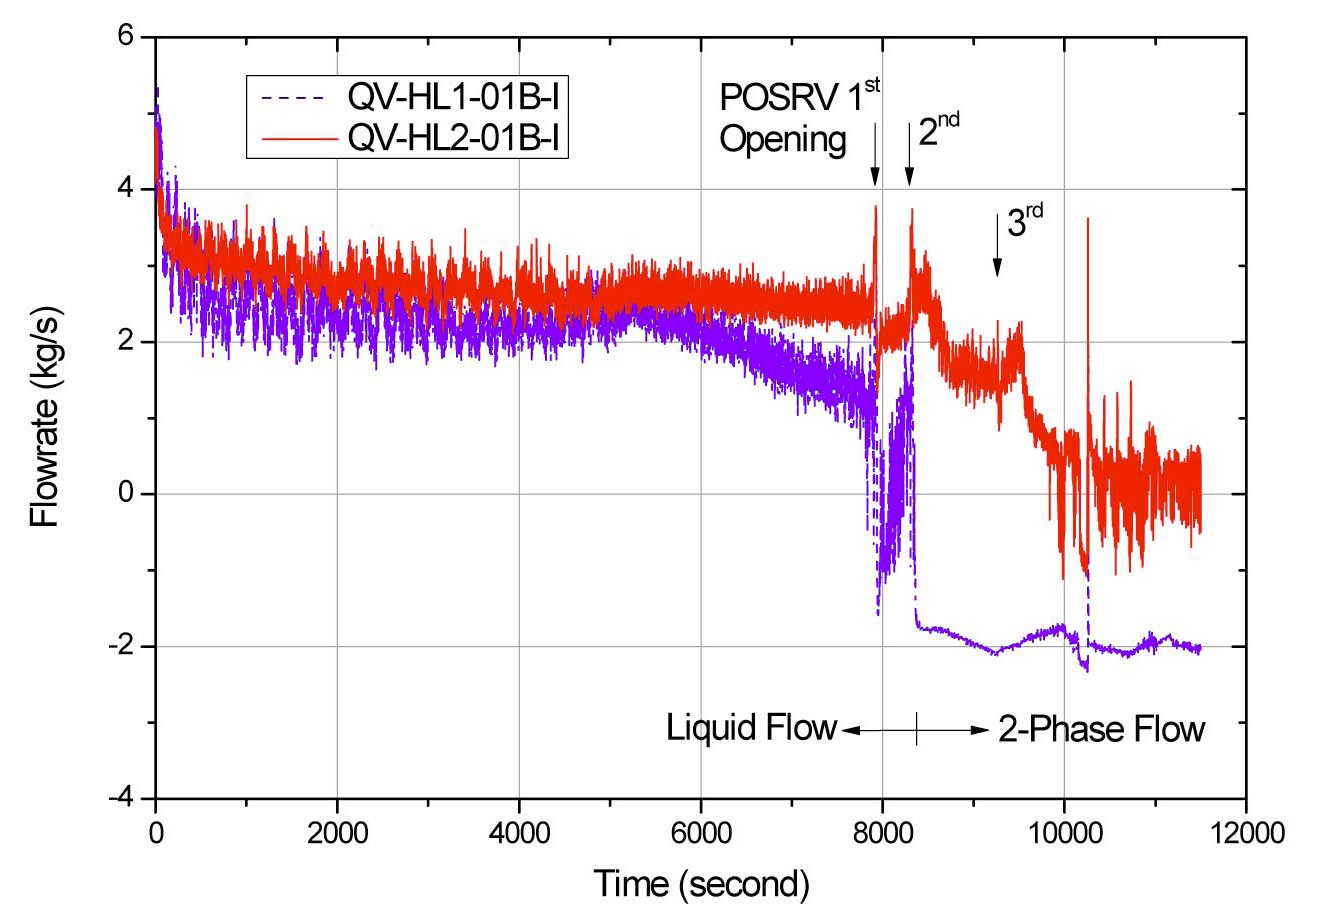
The flowrates of the hot legs (HLs) and cold legs (CLs) showed normal trends until the POSRV 2nd opening at around 8,300 seconds, as shown in Figs. 9 and 10, respectively. In the ATLAS facility, the loop flows were measured by special instruments called bi-directional flow transmitters (BDFTs), developed by KAERI for measuring the range from single phase flows up to stratified twophase flows. Although the performance of a BDFT was designed for usefulness and versatility, a problem with the two-phase flow measurements occurred. This is why the measured data should be scrutinized according to the loop conditions. From the PZR level in Fig. 4, the reactor coolant loops are under the condition of single phase liquid flows until the POSRV 2nd opening at around 8,300 seconds. Thus, the loop flows shown in Figs. 8 and 9 are correct values up until 8,300 seconds. Accordingly, the flow data in the figures should be understood with care owing to the uncertain performance of the BDFT for twophase flow measurements, e.g., quantitative flowrates for a two-phase flow region are not meaningful in the figures, but the flow directions give a physical sense for the understanding of two-phase loop flows. As mentioned in the
previous section, a normal natural circulation with single phase liquid flows was maintained until the SG tube-sides were full at around 8,300 seconds.
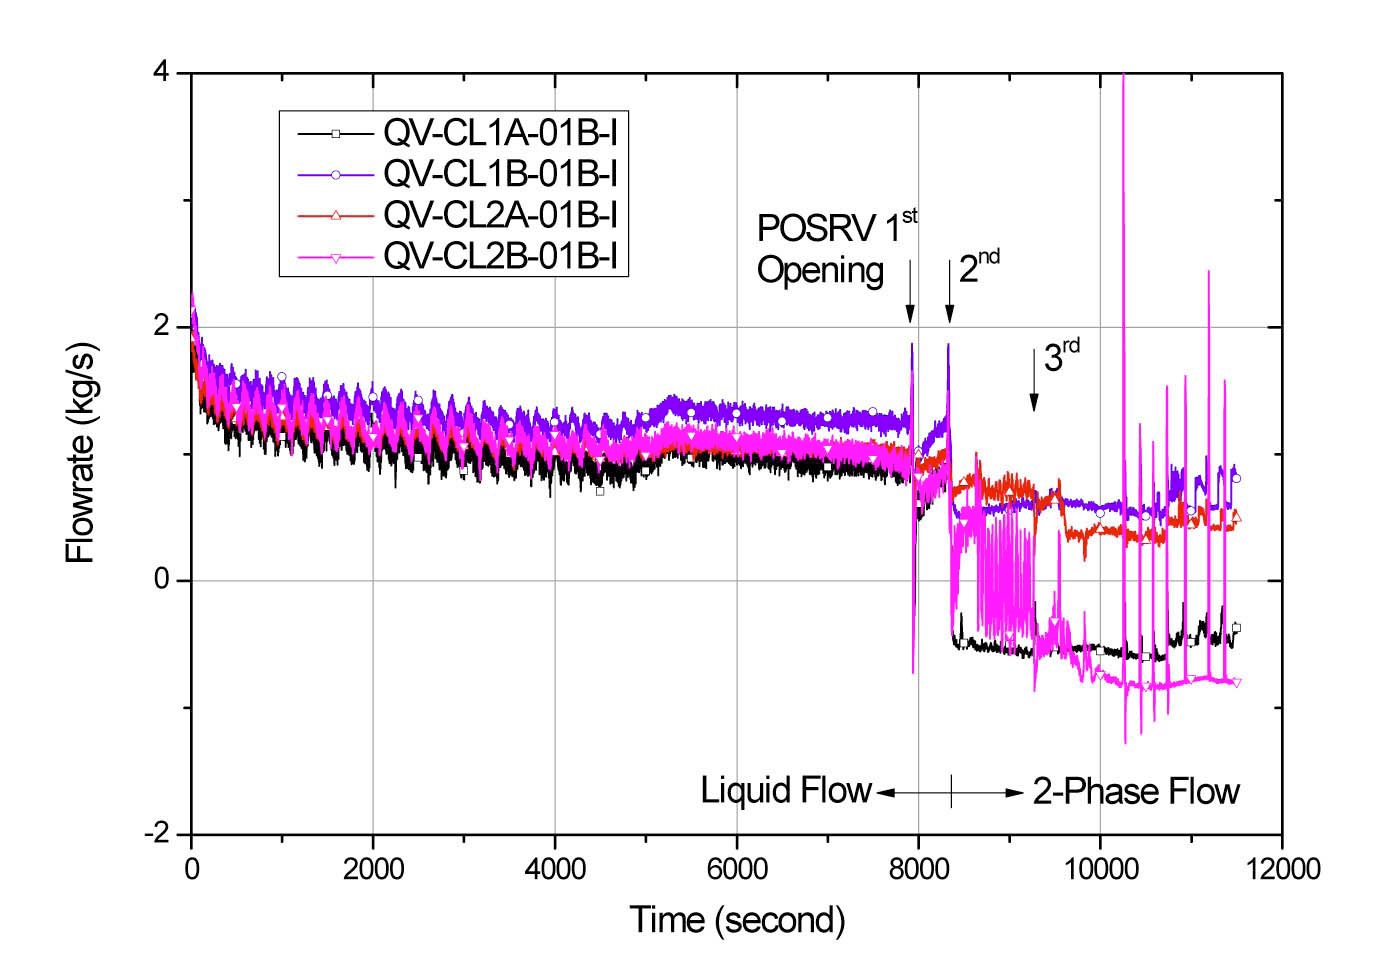
During the 1st POSRV opening of about 20 seconds, the flow direction of HL-1 became negative and returned to positive after the POSRV closed. Then, after the 2nd POSRV opening of around 8300 seconds, the flow direction of HL-1 became negative again and remained for the remainder of the test, as shown in Fig. 9. Although the flow direction of the HL-1 became negative in a later period, that of the HL-2 would not be affected due to the PZR. When the POSRV is opening, the main flow from the core to the POSRV was sustained, which is why a positive flow direction was sustained in the HL-2. For the cold leg aspects, the flow directions of the CL-1A and -2B became negative during the 1st POSRV opening and returned to positive after the POSRV closed. After the 2nd POSRV opening, the flow directions of the CL-1A and -2B became negative again and remained for the rest of the test, as shown in Fig. 10. This means that the water flow of a normal natural
circulation was broken after the POSRV 2nd opening, as mentioned in the previous section. Although the flow directions of the CL-1A and -2B became negative in a later period, those of the CL-1B and -2A were not affected. Consequently, the test result showed the un-symmetric trends of the loop flow in the cold legs at a later stage of the test. The resultant flow directions of the loops for a later period are summarized in Fig. 11.
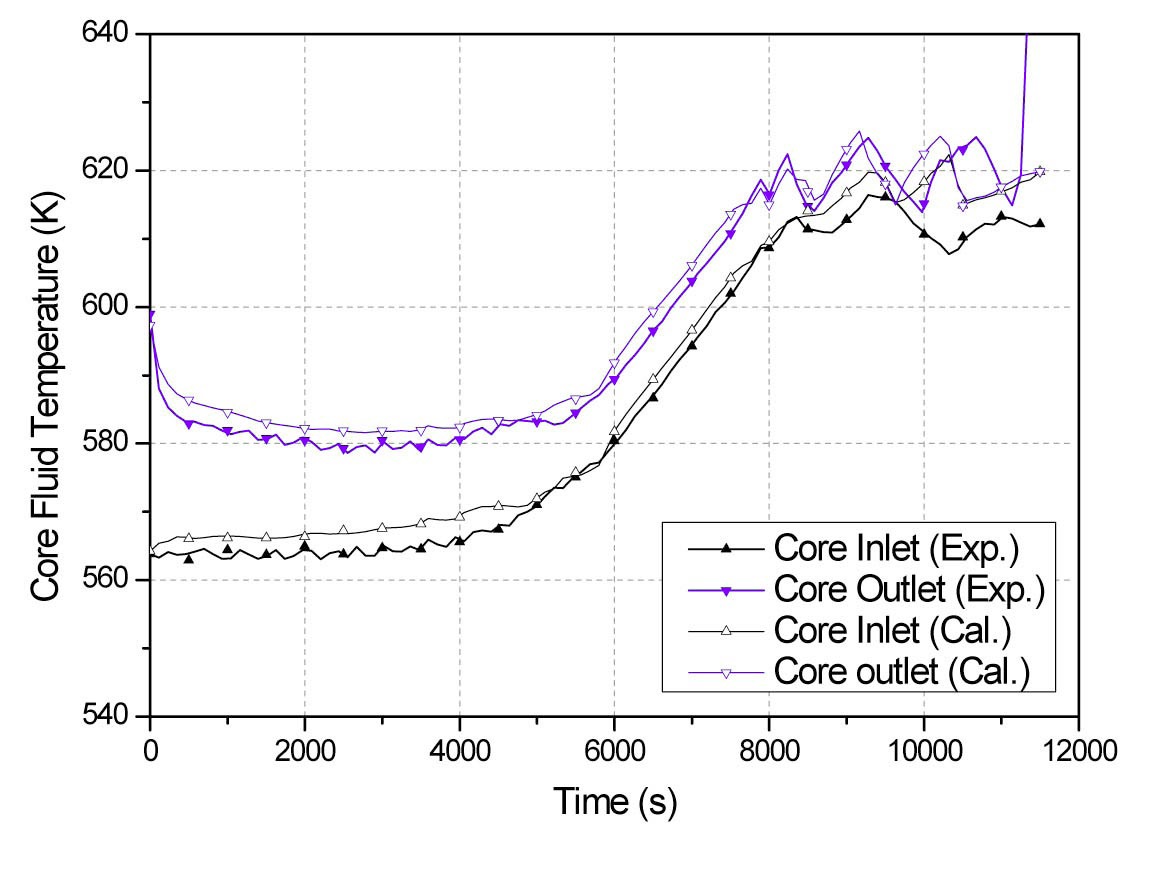
The core temperature remained about 4 ℃ higher than the saturation temperature of the core after about 4,000 seconds, and reached above 500 ℃ at 11,500 seconds, as shown in Fig. 12. As mentioned in the test procedure, 500 ℃ was selected as the temperature limit for the core heatup simulation. The core exit temperature (TF-CO-07) showed a sharp increase after the core heatup, as shown in the figure. For reference, a core decay heat curve is also included in the figure.
3.5 Summary of Major Findings of the Test Data
From the overview of the SBO-01 test results, the major findings of the physical phenomena can be summarized as follows:
The decay heat release consists of two phases, e.g., a first phase in which energy is released by secondary inventory until the SG dryouts, and a second phase, whose decay energy is released by a blowdown of the primary system after the SG dryouts.
Change over the pressurizer function from the PZR to the RV: RV took over the function of a pressurizer after it developed a saturated condition, and the PZR then provided a kind of buffer tank along the POSRV
flow path. This seemed to hinder the PZR inventory from being drained to the primary loop or the RV.
The PZR became full before the POSRV 1st opening.
The normal natural circulation seemed to be broken after the drainage of the SGs’ tube-side water levels.
The core heatup occurred at a low core water level, e.g. ~2 m, with a significant amount of PZR inventory, e.g. ~60%.
4. ANALYSIS OF THE SBO-01 TEST
4.1 MARS Code Modeling of ATLAS
The MARS code was developed by KAERI for a realistic multi-dimensional thermal-hydraulic system analysis of light water reactor transients [4]. It is based on the multidimensional code, COBRA-TF, and one-dimensional system code, RELAP5/MOD3.3. RELAP5 is a versatile and robust system analysis code based on a one-dimensional two-fluid model for two-phase flows, whereas the COBRATF code is based on a three-dimensional, two-fluid, threefield model.
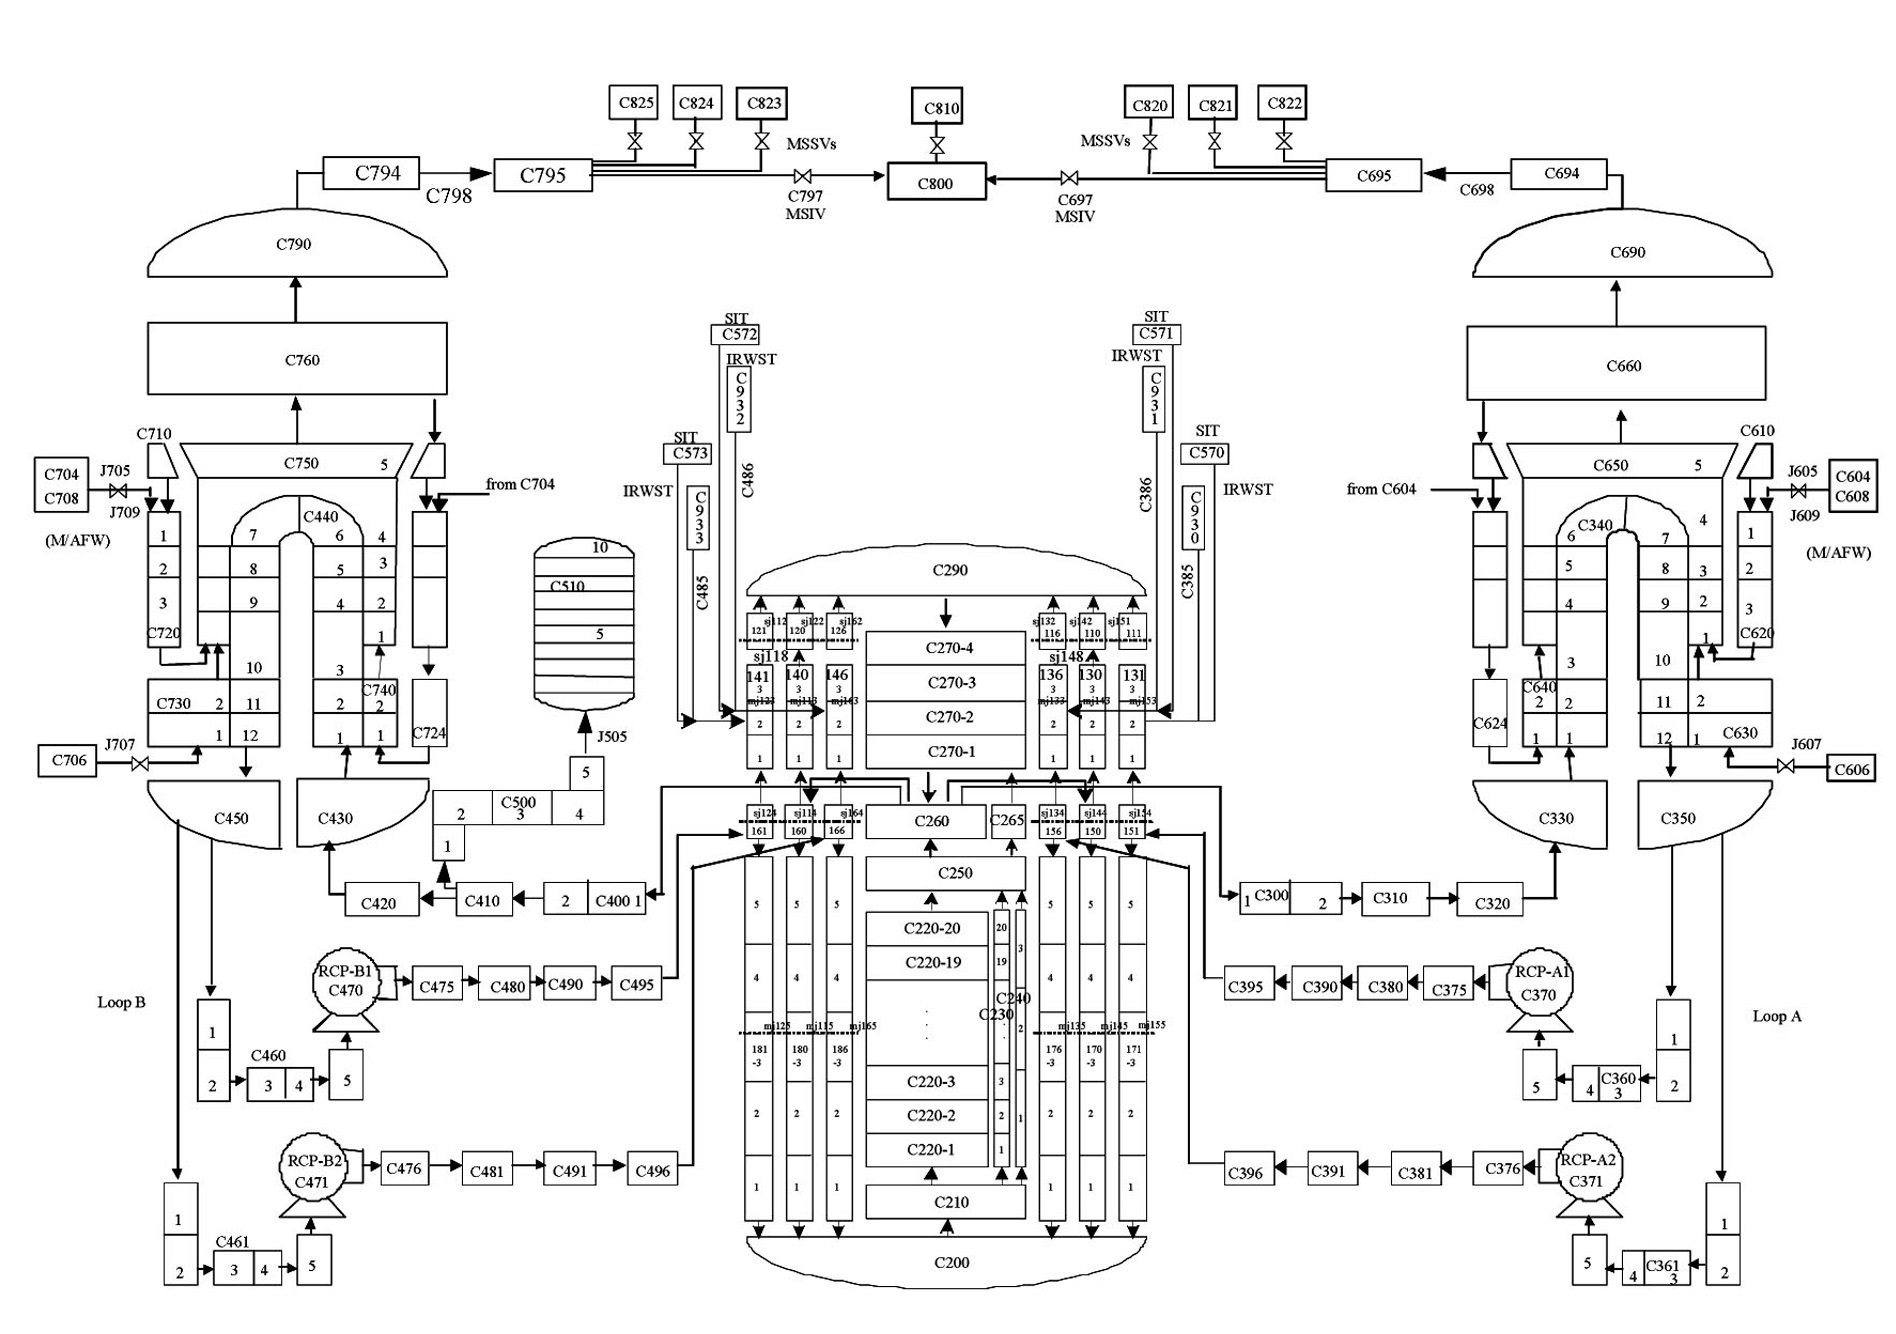
For the simulation of ATLAS using the MARS code, an input model called an ATLAS model, which describes the geometrical and thermal-hydraulic conditions of ATLAS, the control logics model for ATLAS has been developed. The nodalization for ATLAS is shown in Fig. 13. The ATLAS model includes not only the system model, which covers the primary system, secondary system, and safety systems, but also the heat structure of ATLAS, which models the solid boundaries of important components with a significant amount of stored energy, heat source, and heat transfer.
For a steady state calculation, a text input file, which describes the geometrical and thermal-hydraulic conditions of the nodalized volumes representing the flow path of various components in ATLAS, were made. In the experiment, the values of the most important thermal-hydraulic parameters such as the pressure, temperature, and differential pressure were measured. These measured values are then used to specify the initial thermal-hydraulic conditions of nodalized volumes in the code input file. As long as the ATLAS geometrical information and initial fluid information are well implemented in the code calculation, the experimental steady state can be recalculated by the code.
The calculated steady state conditions are shown in Table 4 as a comparison with the experimental results along with the differences. The values of most major parameters calculated are close to those in the experiment except the values of the loop flow rate. It was identified that the flow rate transmitters used in ATLAS overestimate the loop
[Table 4.] Experimental and Calculated Steady States
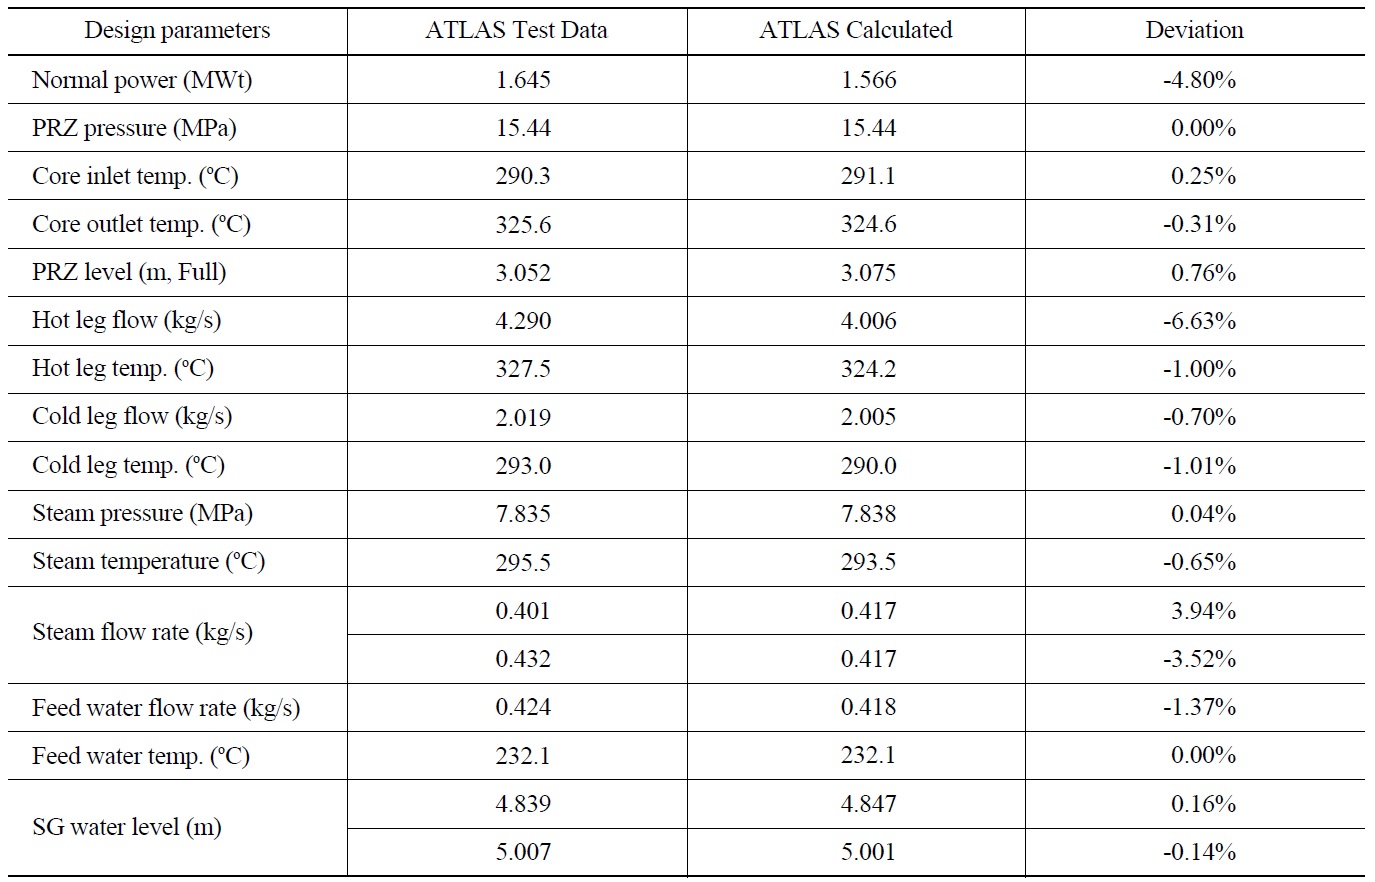
Experimental and Calculated Steady States
flow rate by considering the energy balance in the primary system. Less core power is used in the code calculation because the RCS heat loss except the PZR is not considered in the code calculation.
For the transient calculation, a text file describing the transient conditions is made to be run by the MARS code. The same transient conditions used in the SBO-01 experiment are implemented in the code so that the experimental transients can be reproduced.
In addition, the heat loss through SG vessels is accounted for in the code based on the analysis of previous post-test calculation results of the FLB (Feedwater Line Break) test [12]. The heat loss through the SG vessel cannot be neglected for the secondary system transient, compared with LOCAs (Loss of Coolant Accidents), where the energy carried by the lost coolant through a break is much higher than the SG heat loss. Moreover, the heat loss through the PZR is also considered, as the condensation of steam in the PZR can play an important role on the transient.
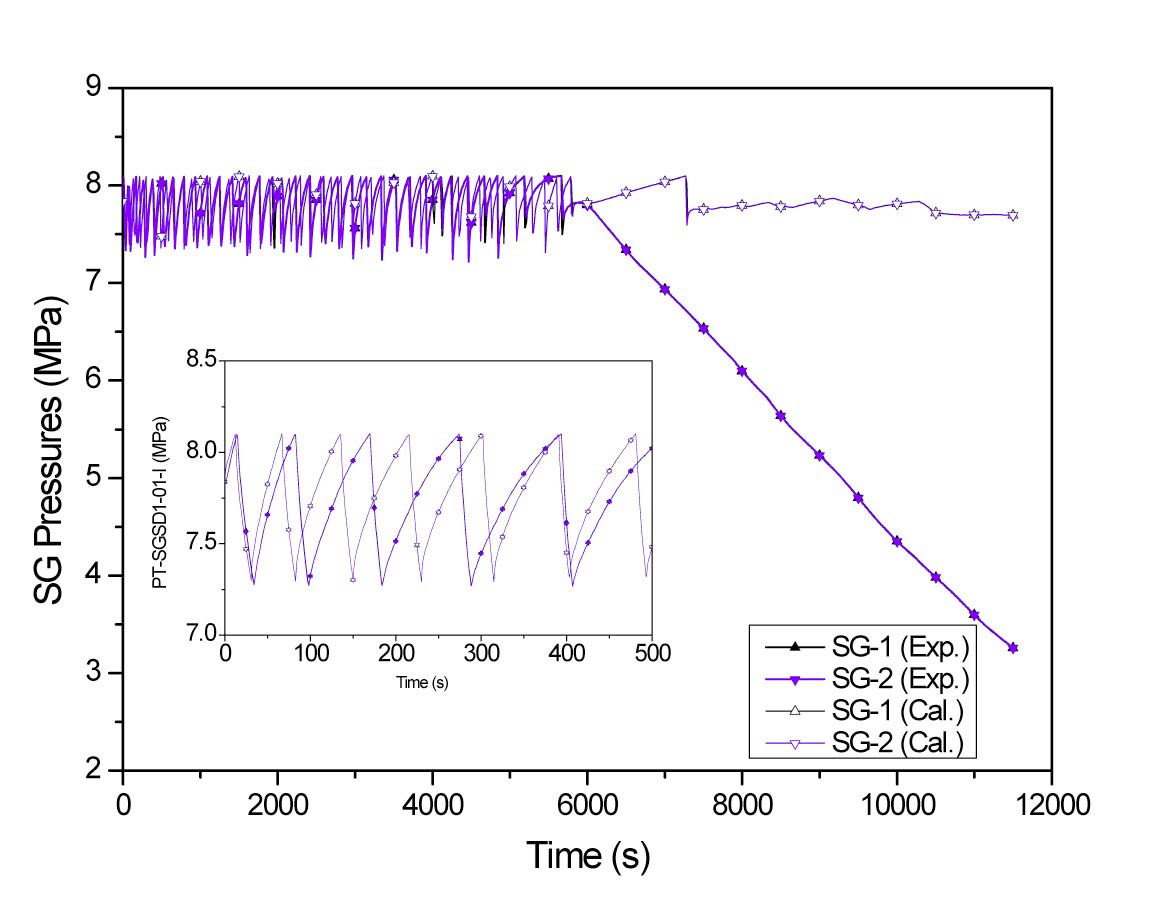
Several events observed in the SBO-01 experiment are reproduced in the code calculation, as seen from the pressurizer and SG pressure transient in Figs. 14 through 22.
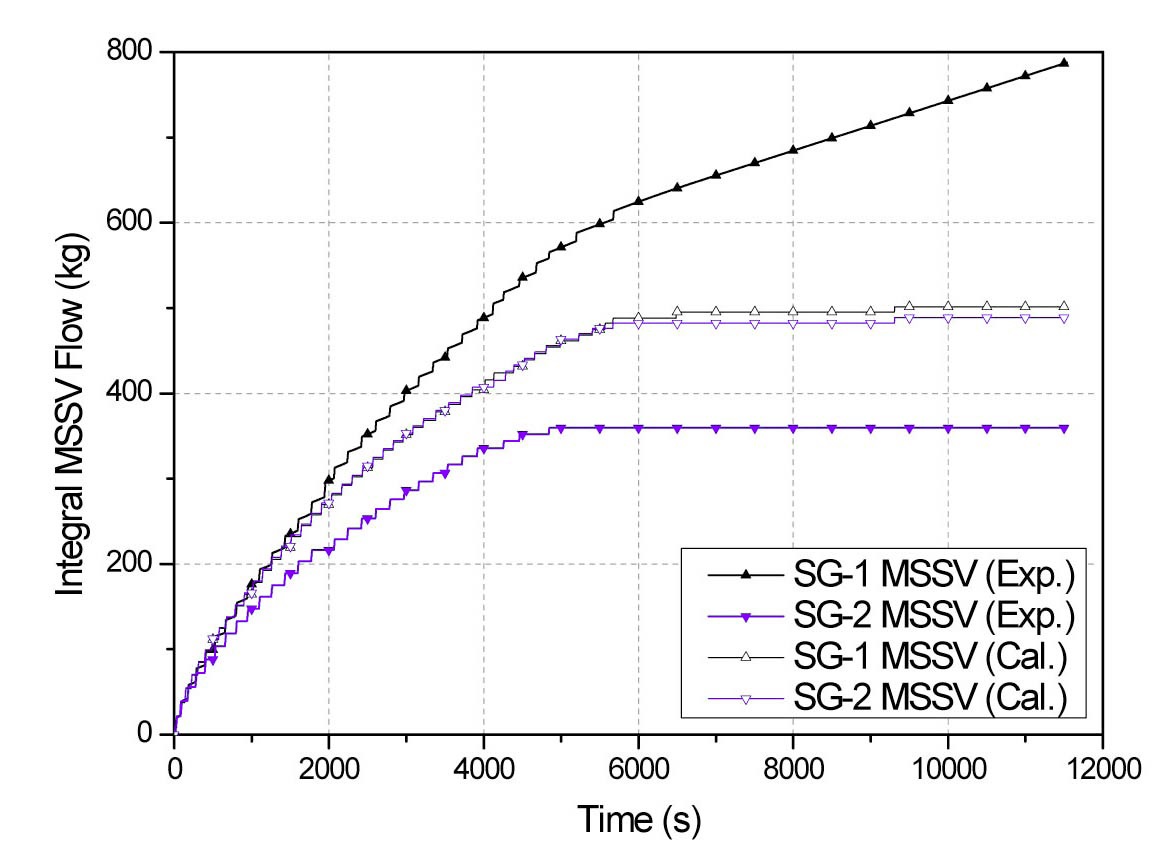
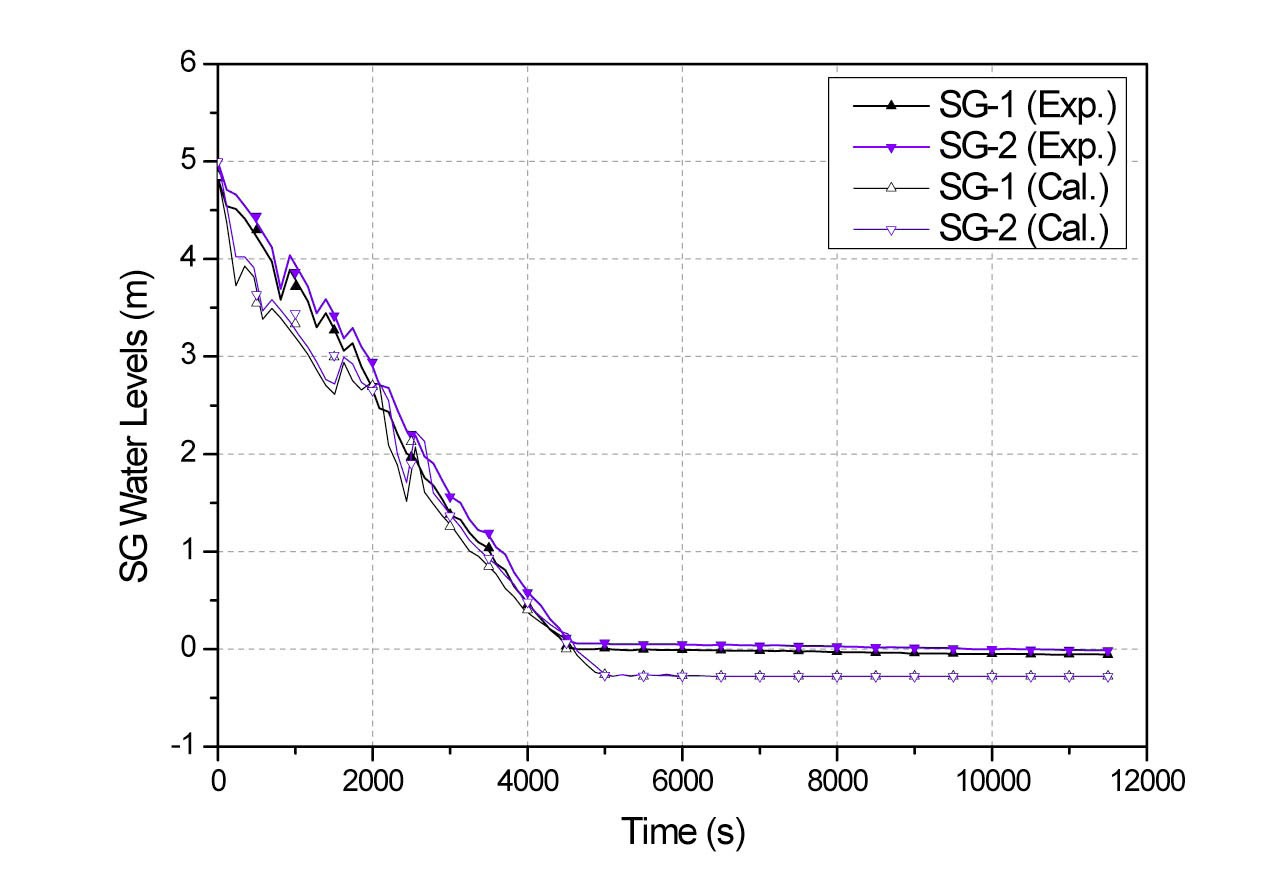
For the secondary system transients as shown in Figs. 14 through 16, the SG dryout time is well predicted as shown. However, the cyclic rate of the MSSV opening and closing shown in Fig. 14 is a little faster in the calculation than that in the experiment, and the transients of accumulated MSSV mass flow in Fig. 15 also deviate between the calculation and experiment. This is due to the fact that the leakage from SG-1 MSSV is not modeled in the code. Because there is no leakage through SG-1 MSSV in the code calculation, the SG pressure did not decrease linearly after SG dryout in the calculation, compared with that in the experiment. The SG water level transients in the calculation (Fig. 16) are also consistent with those in the experiment, but they decrease below zero. Owing to the range of calculated water levels being modeled wider than that of the experiment, the calculated water levels were adjusted to the experiment conditions as shown in the figure.
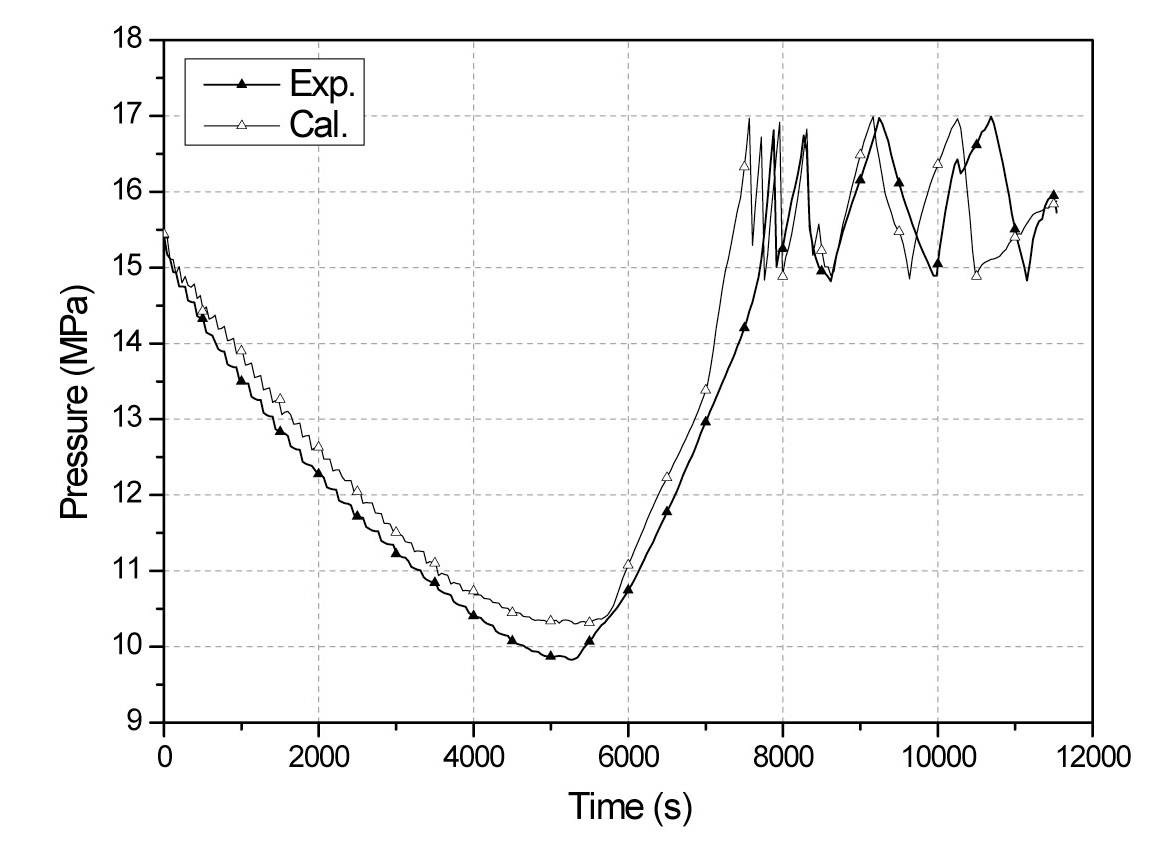
For the primary system transients shown in Figs. 17 through 22, the pressurizer pressure transient shown in Fig. 17 is well reproduced in the code calculation, as is
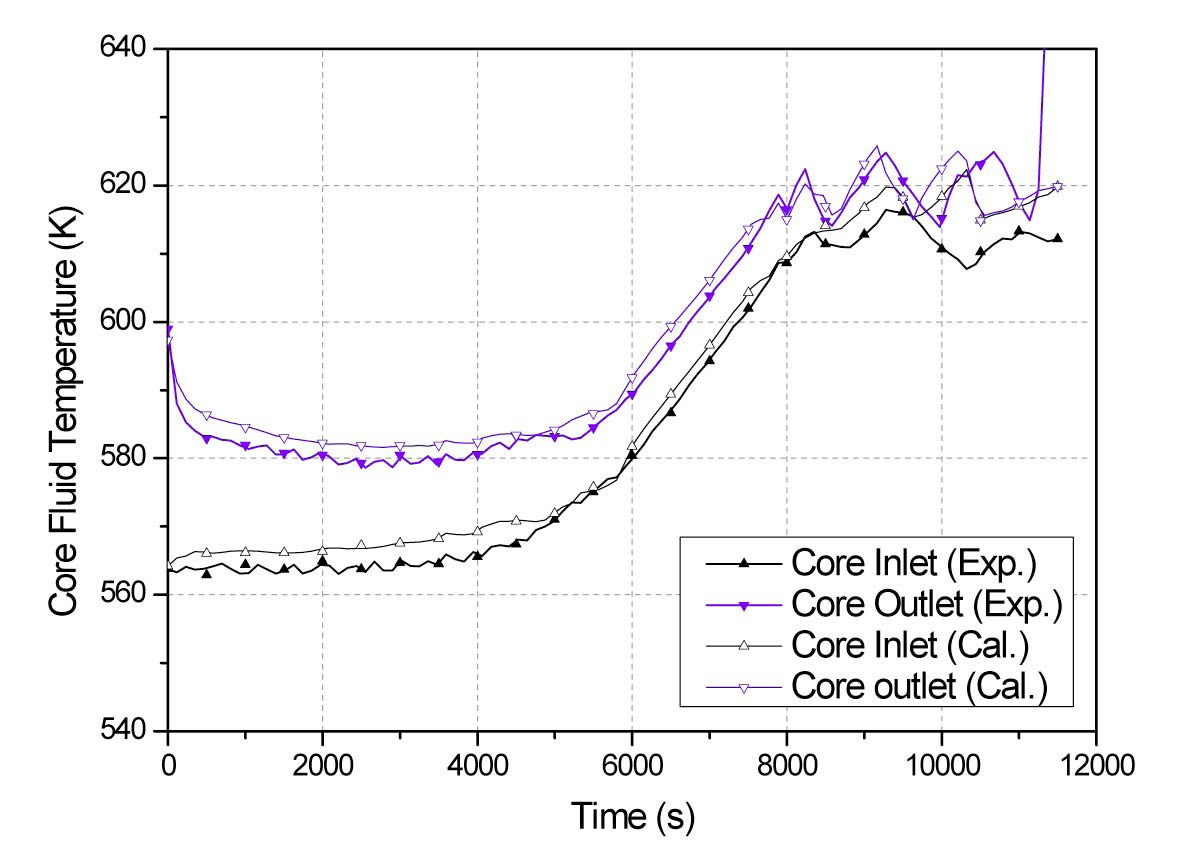
the pressurizer water level in Fig. 19, the core inlet and outlet fluid temperatures in Fig. 20, the core water level in Fig. 21, and the core rod heater surface temperature in
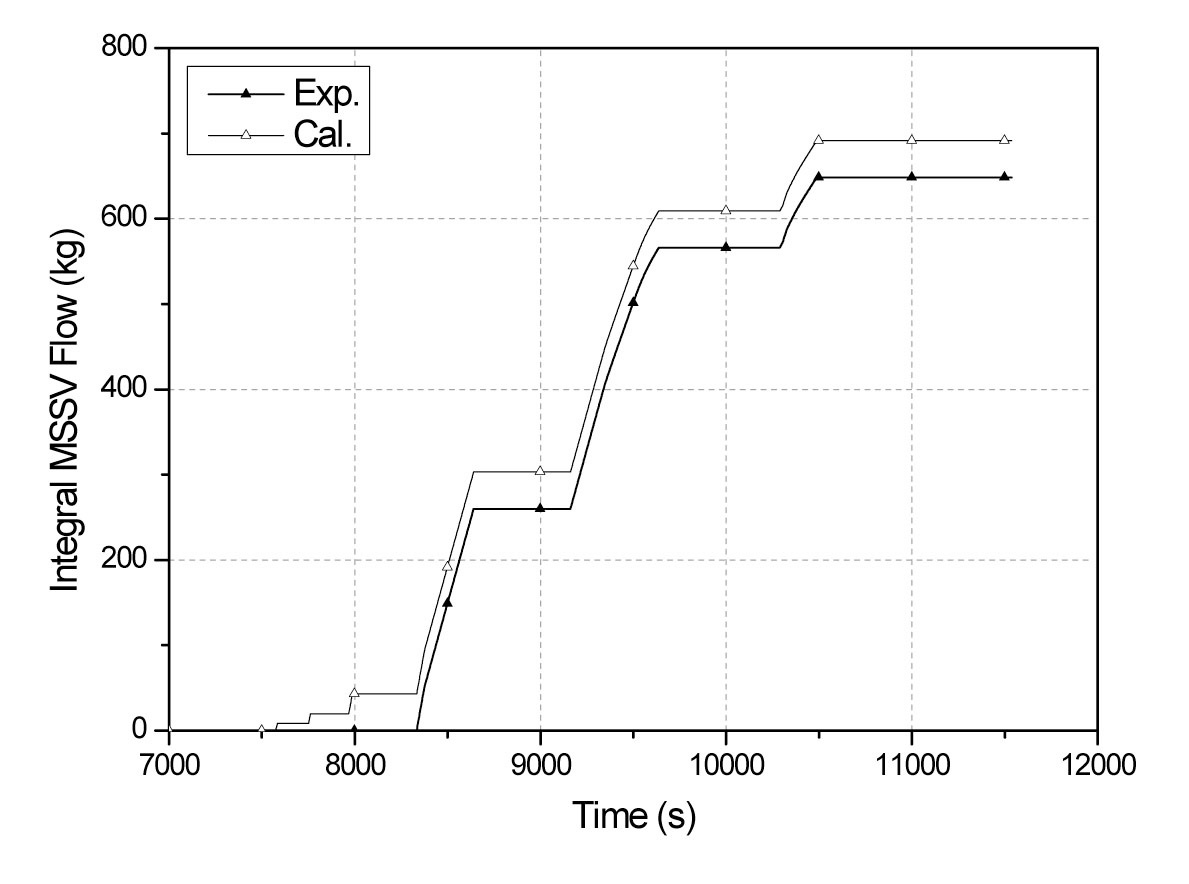
Fig. 22. However, the pressurizer water level transient deviates greatly from that in the experiment before 6,000 s. This is attributed to the higher calculated temperature of the RCS coolant, as shown in Fig. 20, owing to the fact that the RCS heat loss is not considered in the code calculation. The pressurizer pressure rises faster after 6,000 s than in the experiment. This is also because the RCS coolant temperature is slightly overestimated, as shown in Fig. 20, while the PZR is full with no steam space for water expansion, owing to the neglect of RCS heat loss in the code calculation. As the pressure transients deviate after 6,000 s between the calculation and experiment, the transients of integrated POSRV mass flow also deviate slightly. Nevertheless, the amounts of integrated POSRV mass flow (Fig. 18) at the time when the POSRV is closed are almost the same at around 61 kg, 350 kg, and 600 kg.
Shown in Fig. 21 are the core and downcomer water levels of both the calculation and experiment. The core water level in the calculation continues decreasing after 9,750 s, whereas the core water level in the experiment stays almost constant owing to the decrease of the downcomer
water level. Owing to the earlier decrease of core water level in the calculation, the maximum temperature of core rod heaters increases earlier as well. Moreover, the downcomer water level decreases much earlier than that in the experiment. It is believed that no modeling of SG MSSV-1 leakage might be a possible reason for the mismatch.
Although there are some minor differences in the transients of the code calculation and experiment, the overall transients of the SBO-01 experiment are well reproduced using the MARS code, and the large deviations of the two are mainly due to the neglect of RCS heat loss and SG leakage through MSSV. In addition, the results using the ATLAS model without an SG leakage is more realistic in terms of projecting the plant transient. The validated ATLAS model can be further employed to investigate the SBO transient in the APR1400 in the future and to improve the accident management system for the APR1400. Moreover, it can be used to study the scaling distortion in ATLAS with respect to the APR1400.
From an overview of the SBO-01 test results, the station blackout scenario is characterized into the two typical phases: The first phase is characterized by decay heat removal through secondary safety valves until the SG dryouts, and the second phase, whose decay energy is released by a blowdown of the primary system after the SG dryouts. During the second phase, some physical phenomena of the change over the pressurizer function, i.e., the pressurizer being full before the POSRV 1st opening and then its function being taken by the RV, and the termination of a normal natural circulation flow were identified. Finally, a core heatup occurred at a low core water level although under significant amounts of PZR inventory, whose drainage seemed to be hindered owing to the pressurizer function by the RV.
The transient of SBO-01 is well reproduced in the calculation using the MARS code. It indicates the predictability of the MARS code on the secondary side transients provided that the experimental conditions are precisely implemented in the code calculation. However, some deviations between the calculation and experiment are also observed. Based on the comparison and calculated results, it was inferred that these deviations are mainly contributed to the non-existent modeling of SG leakage that exists in the experiment and a neglect of RCS heat loss in the code calculation. In a real plant transient, where the SG leakage probability is low, the ATLAS model without SG leakage might be more representative of the plant transients. As the ATLAS model is validated based on a comparison of the transients between the code calculation and experiment, the validated ATLAS model can be further employed to investigate the other possible SBO scenarios since the SBO-01 scenario is just one postulated SBO sequence. In addition, the model can be used to study the scaling distortion of ATLAS in the simulation SBO by comparing the transients of the calculated SBO between ATLAS and the APR1400.
AC Alternating Current
ANS American Nuclear Society
AFWP Auxiliary Feedwater Pump
APR1400 Advanced power reactor 1400 MWe
ATLAS Advanced Thermal-Hydraulic Test Loop for Accident Simulation
CFR Code of Federal Regulation
CL Cold Leg
CO Core
DAS Data Acquisition System
DC Downcomer
ECCS Emergency core cooling System
FLB Feedwater Line Break
HL Hot Leg
HPSI High Pressure Safety Injection
IIST INER Integral System Test
IL Intermediate Leg
INER Institute of Nuclear Energy Research in Taiwan
JAEA Japan Atomic Energy Agency
LOCA Loss of Coolant Accident
LPS Low Pressure Safety Injection
LSTF Large-Scale Test Facility of JAEA
LT Level Transmitter
MARS Multi-dimensional analysis of reactor safety
MFWP Main Feedwater Pump
MSSV Main Steam Safety Valve
OPR1000 Optimized power reactor 1000 MWe
POSRV Power Operated Safety Relief Valve
PWR Pressurized Water Reactor
PZR Pressurizer
RCP Reactor Coolant Pump
RV Reactor Vessel
RWT Refueling Water Storage Tank
SG Steam Generator
SGSDRS Steam Generator between Steam Dome and Riser
SIT Safety Injection Tank
TF Fluid Temperature
USNRC United State Nuclear Regulatory Commission