

A key input for the assessment of Human Error Probabilities (HEPs) with Human Reliability Analysis (HRA) methods is the evaluation of the factors influencing the human performance (often referred to as Performance Shaping Factors, PSFs). In general, the definition of these factors and the supporting guidance are such that their evaluation involves significant subjectivity. This affects the repeatability of HRA results as well as the collection of HRA data for model construction and verification. In this context, the present paper considers the TAsk COMplexity (TACOM) measure, developed by one of the authors to quantify the complexity of procedure-guided tasks (by the operating crew of nuclear power plants in emergency situations), and evaluates its use to represent (objectively and quantitatively) task complexity issues relevant to HRA methods. In particular, TACOM scores are calculated for five Human Failure Events (HFEs) for which empirical evidence on the HEPs (albeit with large uncertainty) and influencing factors are available ? from the International HRA Empirical Study. The empirical evaluation has shown promising results. The TACOM score increases as the empirical HEP of the selected HFEs increases. Except for one case, TACOM scores are well distinguished if related to different difficulty categories (e.g., “easy” vs. “somewhat difficult”), while values corresponding to tasks within the same category are very close. Despite some important limitations related to the small number of HFEs investigated and the large uncertainty in their HEPs, this paper presents one of few attempts to empirically study the effect of a performance shaping factor on the human error probability. This type of study is important to enhance the empirical basis of HRA methods, to make sure that 1) the definitions of the PSFs cover the influences important for HRA (i.e., influencing the error probability), and 2) the quantitative relationships among PSFs and error probability are adequately represented.
Human Reliability Analysis (HRA) aims at analyzing human errors in technological systems, the influences on human performance, and ultimately assessing the so-called Human Error Probability (HEP). HRA results, often in the context of Probabilistic Safety Assessment (PSA) results, inform operating as well as regulatory decisions with important safety and economic consequences. This calls for the need to use, in HRA like in any other areas of risk analysis, methods and tools that, to the extent possible, are built from and validated on empirical evidence. Recent efforts in this direction are the International HRA Empirical Study [1,2] and the follow-up US HRA Empirical Study [3]; these studies were aimed at evaluating HRA methods’ strengths and weaknesses against evidence from operating crew performance data, collected during simulated accident scenarios. Also, recognizing the need for enhancing the empirical basis of HRA methods, programs of HRA data collection from simulated environments are active or are being activated all over the world [4].
In parallel to the collection of data, the growing interest in enhancing the empirical basis of HRA is visible in the development of HRA methods with underlying models directly built from data (where the models represent quantitative relationships between the human error probability and factors influencing it, often referred to as Performance Shaping Factors, PSFs) [5,6]. Further, methods are being developed to validate the relationships among PSFs and the error probability, e.g., in the already mentioned HRA empirical studies [1-3] and in [7-11]. In particular, in [7], it is investigated whether the complexity of procedureguided tasks (by the operating crew of nuclear power plants in emergency situations) can be quantitatively and objectively measured with the use of TACOM (TAsk COMplexity) measure [12]. TACOM evaluates a complexity score by combining the contributions of five different task complexity aspects (e.g., amount of information to be processed, logical complexity of tasks, and knowledge requirements).
Besides the lack of reference HRA data, one of the challenges for building empirically-based and validated HRA models is an objective evaluation of the performance influences (in HRA terms, the PSF ratings). Typically, these factors characterize the personnel performance in specific tasks by addressing the personnel directly (e.g., via the quality of their training, experience, and work processes), the task to be performed (e.g., the time required to complete the actions and the quality of procedural guidance), the available tools (e.g., the quality of human machine interface), and other aspects depending on the specific HRA method. Indeed, the application of current HRA methods is largely based on subjective evaluations (coming in at different stages of the analysis and to different extents, depending on the specific method and analyst knowledge/experience). On the one hand this influences the repeatability of HRA results (this issue is deeply investigated in the US HRA Empirical Study [3]). On the other hand, this challenges the empirical derivation and validation of the quantitative relationships among PSFs and HEPs, which ideally would require the availability of data points, collected for performance conditions corresponding to many different combinations of PSF ratings. The lack of objective PSF evaluations prejudices the establishment of a direct link between collected data and the associated PSF ratings, because of the need to subjectively interpret the data. For some of the PSFs typically considered by HRA methods, especially those aimed at characterizing crew behaviors (e.g., in the SPAR-H method: level of stress, fitness for duty, and work processes [13]), some (relatively high) level of subjectivity is probably unavoidable in the evaluation of these factors, due to the inherent variability of the effects of these factors on the error probability. However, there is still a substantial margin to improve on the PSF definitions and guidance to decrease subjectivity, as underscored by the results of the HRA Empirical Studies [1,3].
In an effort to provide objective PSF measures, the present paper investigates the use of the TACOM measure to represent (objectively and quantitatively) the task complexity issues relevant to HRA methods. In previous works by one of the authors, TACOM scores have been compared with three types of crew performance indicators: the time to complete the task [12]; subjective workload scores as measured by the NASA-TLX (National Aeronautics and Space Administration ? Task Load indeX) [14]; and the OPAS (Operator Performance Assessment System) scores developed by HAMMLAB (HAlden Man Machine LABoratory) of the OECD Halden Reactor Project [15]. It was shown that the TACOM scores and these human performance data have significant correlations; this supports TACOM measure as a relevant indicator of task complexity influences on crew performance. However, to evaluate the relevance of TACOM for HRA purposes, the relationship with the error probability needs to be investigated. First, qualitatively this requires that the TACOM definition should include the complexity elements that influence the human error probability. Second, quantitatively, TACOM scores should correlate with the error probabilities (the profile of the other PSFs being kept constant or their effect being properly considered, e.g., averaged out or factored out). To this end, in this paper, the TACOM measure is applied to multiple emergency tasks of different complexity, for which empirical evidence of the error probability is available (albeit with large uncertainty). In particular, Human Failure Events (HFEs) from the International HRA Empirical Study are selected [2]. In the context of the Empirical Study, pre-defined emergency tasks were simulated, obtaining evidence on the error probability and on the performance influencing factors on the corresponding HFEs. In the present paper, the TACOM scores are contrasted to the empirical evidence with the goal to evaluate both the correlation between the actual TACOM scores and the empirical HEPs of the considered HFEs. In addition, the paper investigates whether TACOM provides a difficulty characterization coherent with the empirical evidence (in other words, the ability to discriminate between, e.g., “easy” and “difficult” tasks).
The paper is structured as follows. In Section 2, a brief explanation of the TACOM measure is given. Then, the evaluation methodology applied in the present paper is described (Section 3). Section 4 presents the empirical basis of the evaluation: the data from the International HRA Empirical Study [2]. The results of the evaluation are given in Section 5. Finally, Section 6 includes concluding remarks along with summarizing the limitations of the study.
According to wide-spread operating experience in many industries (such as nuclear power plants, chemical plants, or aviation industries) that are based on large process control systems, it is evident that human error is one of the crucial contributors to serious accidents as well as incidents. In addition, the use of well-designed procedures is one of the practical options to reduce the possibility of human error [16].
One challenging aspect for the performance of tasks prescribed in emergency procedures is the need to cope with dynamically varying situations by using static task descriptions (i.e. the procedures). In following the emergency procedures, operators have to continuously assess the nature of the situation at hand in order to confirm the appropriateness of their response. It can be reasonably expected that the possibility of human error will increase when operators are faced with complex tasks. In this regard, one of the critical questions to be resolved is: “How complex a task is?” The TACOM measure has been developed to give a quantitative answer [12]. The TACOM measure is defined by a weighted Euclidean norm in a complexity space that consists of three dimensions, suggested by [17]. These dimensions are: task scope (TS), task structurability (TS), and task uncertainty (TU), each comprised of one
[Table 1.] The TACOM Measure: Complexity Dimensions

The TACOM Measure: Complexity Dimensions
[Table 2.] The TACOM Sub-measures

The TACOM Sub-measures
or two sub-measures. Table 1 and Table 2 summarize the meaning of each dimension and the associated sub-measures.
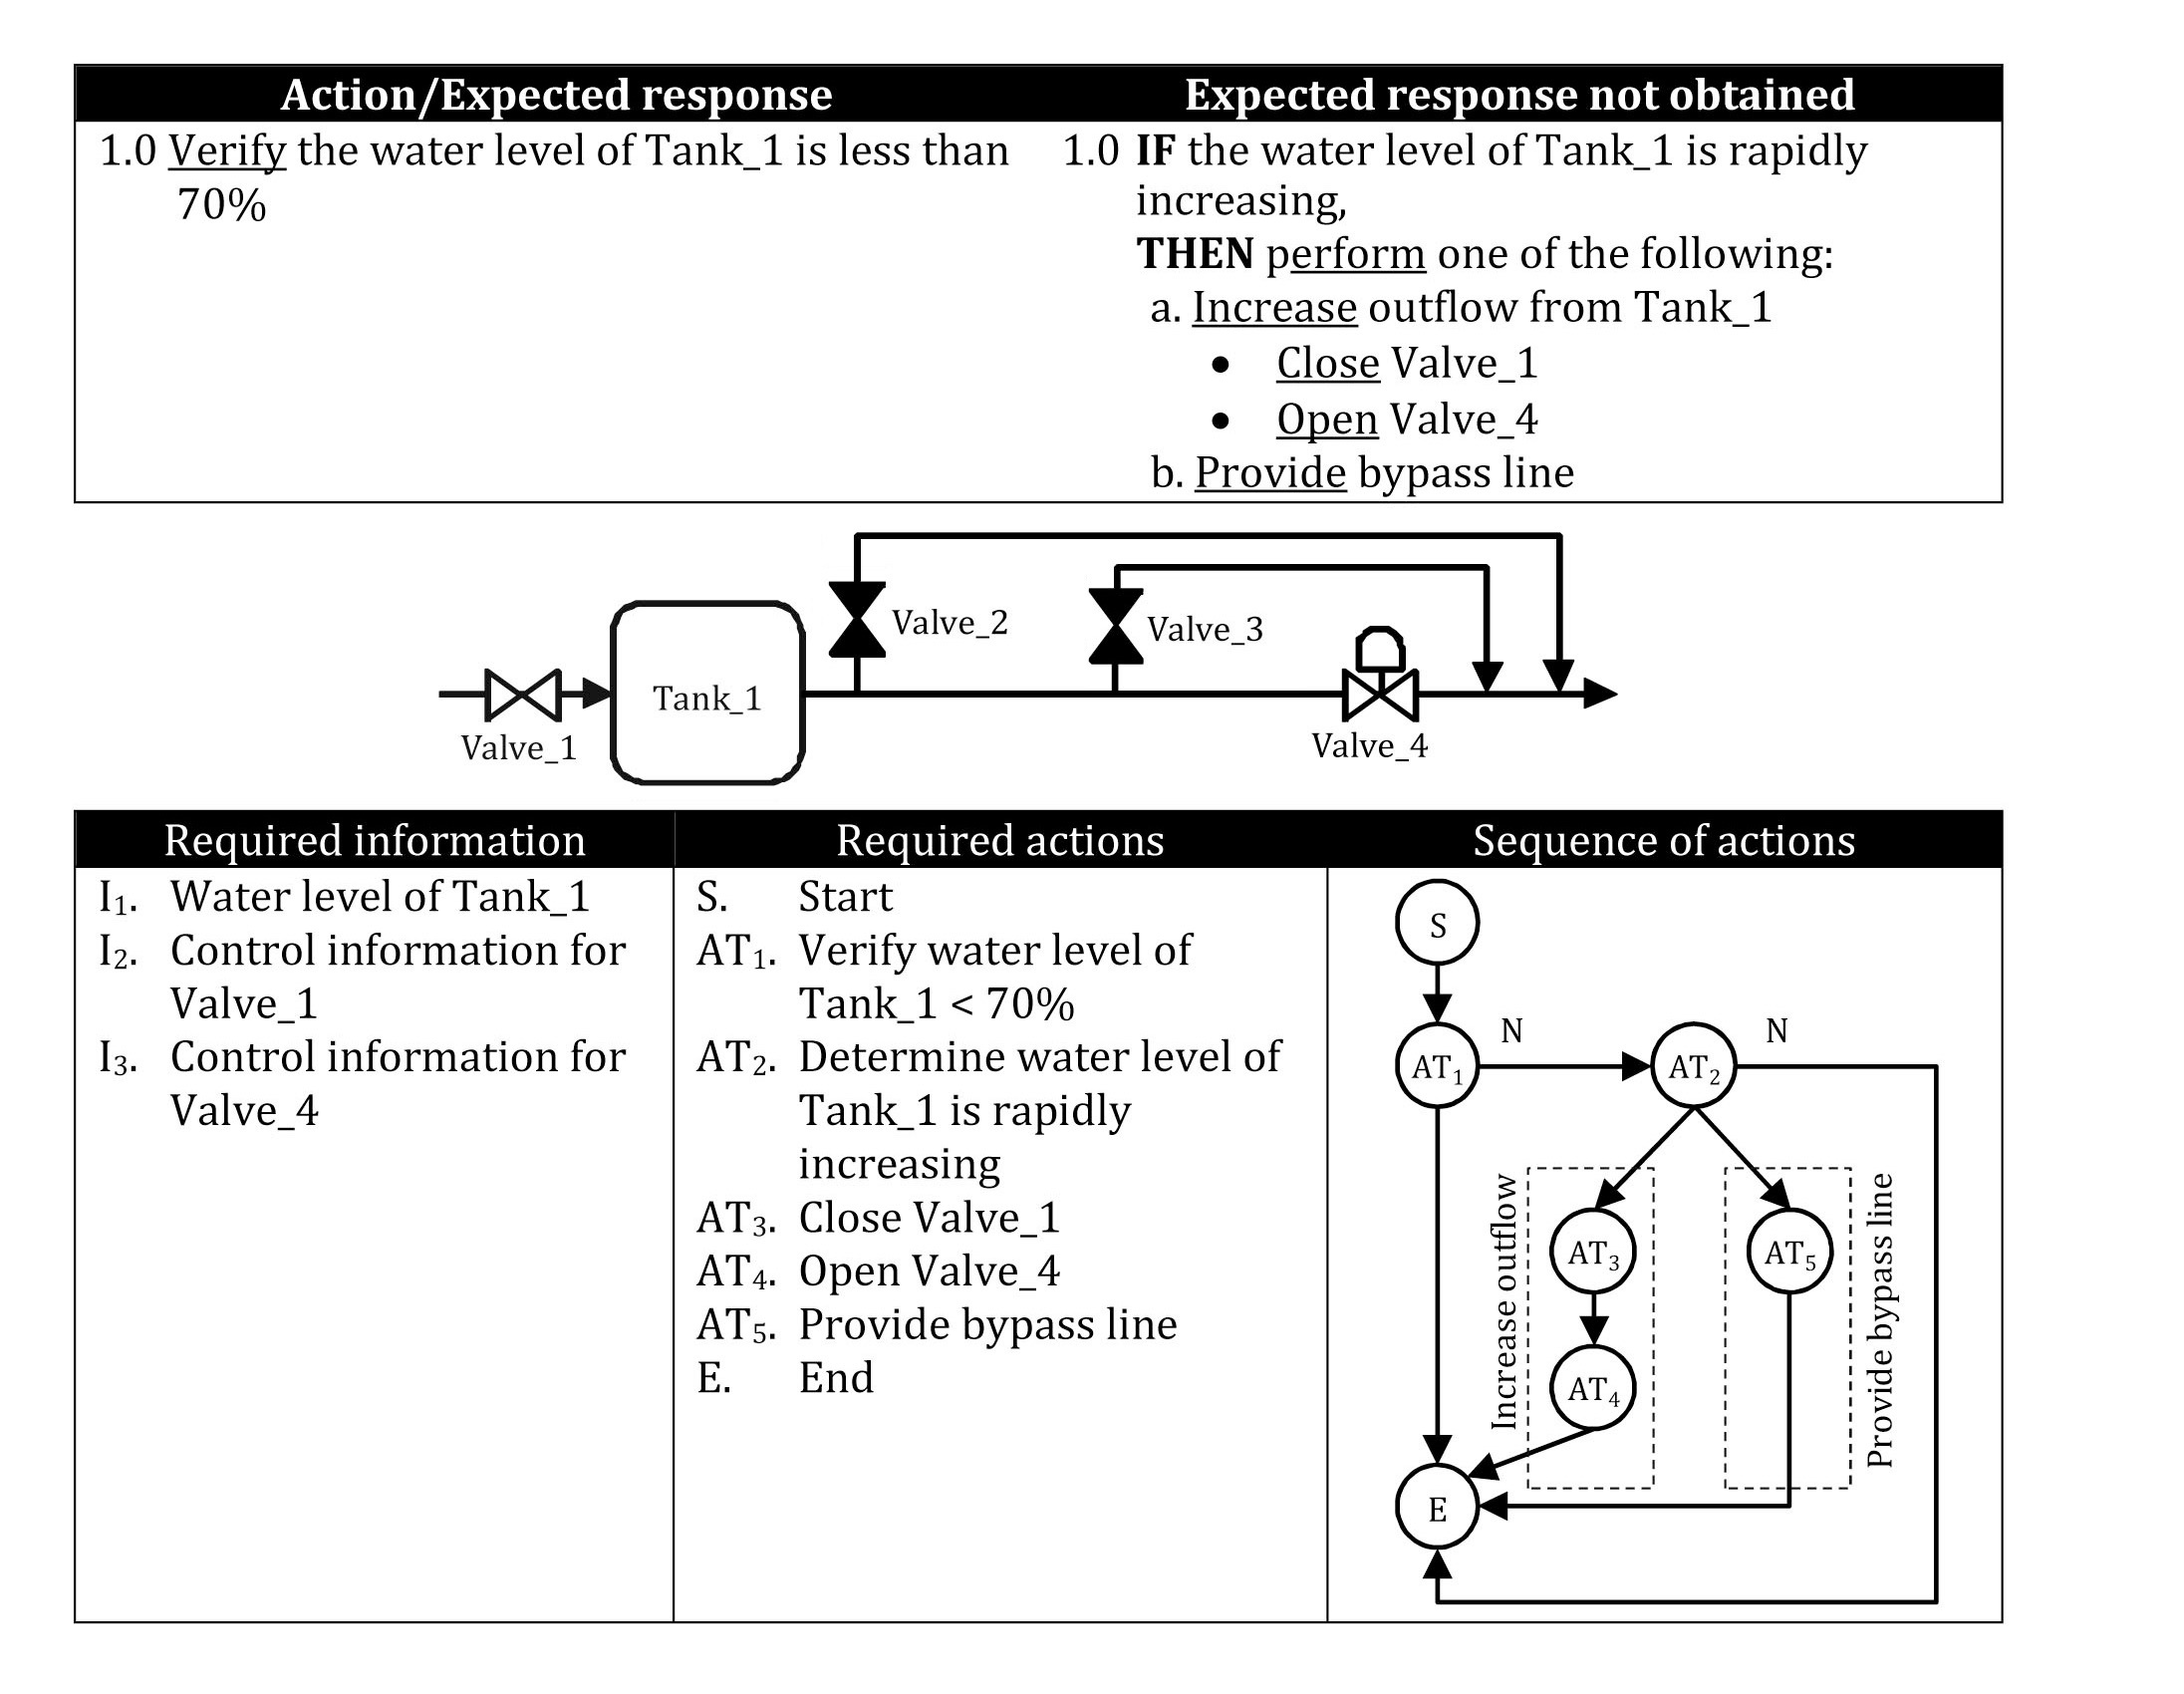
The five sub-measures quantifying the complexity (Table 2) are introduced with the aid of the example in Figure 1. The figure shows an excerpt of a hypothetical procedure for the task of maintaining the water level of Tank_1 less than 70%, and the associated system configuration.
The essential elements to carry out the given task are also provided in Figure 1. Concerning the required information, operators need to know three elements: the water level of Tank_1 and the control information for Valve_1 and Valve_4 (i.e. how to operate these valves). In addition, operators have to maintain the level of Tank_1 by performing a prescribed task that is composed of five actions. The first two sub-measures of Table 2 cover complexity characterization related to the amount of information as well as the number of actions.
The third sub-measure considers that the required actions should be conducted according to specific paths and sequences of actions, the logical organization of which can contribute to the complexity of the tasks, as results from “multiple path-goal connections” [18] or “path-goal multiplicity” [19]. For example, as it can be seen from Figure 1, there are four paths to accomplish this task. First, if the water level is less than 70%, then there is no action to be conducted. In addition, even if the water level is greater than 70%, operators do not need to carry out any action if it does not increase rapidly. On the other hand, if the water level is greater than 70% and rapidly increasing, then operators have to select one of two paths (i.e., strategies): (a) increase outflow and (b) provide a bypass line. To this end, it is natural to expect that operators need to decide which path is more appropriate for a situation at hand. The third sub-measure in Table 2 is introduced to measure the logical complexity of a procedure-guided task.
The above-mentioned sub-measures are not sufficient for quantifying the complexity, because two significant factors are not properly considered yet. The first one is the amount of domain knowledge that is closely related to the actual execution of a task being analyzed. For example, let us compare three actions AT3, AT4 and AT5 shown in Figure 1. Of them, since the targets of actions AT3 and AT4 are dedicated components (i.e., Valve_1 and Valve_4), it can be anticipated that operators do not need to recall and /or extract additional domain knowledge (such as component configuration) when they decide that the increase of outflow from Tank_1 is the most effective strategy (i.e. they decide for option a in the procedure). In contrast, the execution of the other strategy (i.e., “Provide bypass line”, option b) requires additional domain knowledge such as “how many bypass valves are connected to Tank_1?” Indeed, it is possible that action descriptions without sufficient details hamper the decision of an appropriate strategy or its execution.
Accordingly, the fourth sub-measure of Table 2 measures the complexity of procedure-guided tasks in terms of the amount of knowledge required to carry out the task.
The last factor to be considered is the amount of cognitive effort (or resources) to establish appropriate decision criteria for performing required actions. For example, let us consider action AT2 (i.e., “Determine water level of Tank_1 is rapidly increasing”) in Figure 1. Judgment is required to decide if the increase of the water level is rapid, in lack of a specific criterion for determining a “rapid increase”. Depending on the situation, this decision can be more or less challenging and adds to the complexity of the task. Accordingly, the last sub-measure is intended to account for whether the task requires complex decisions.
The TACOM score for a given procedure-guided task is quantified by combining the values of the five submeasures (Figure 2).
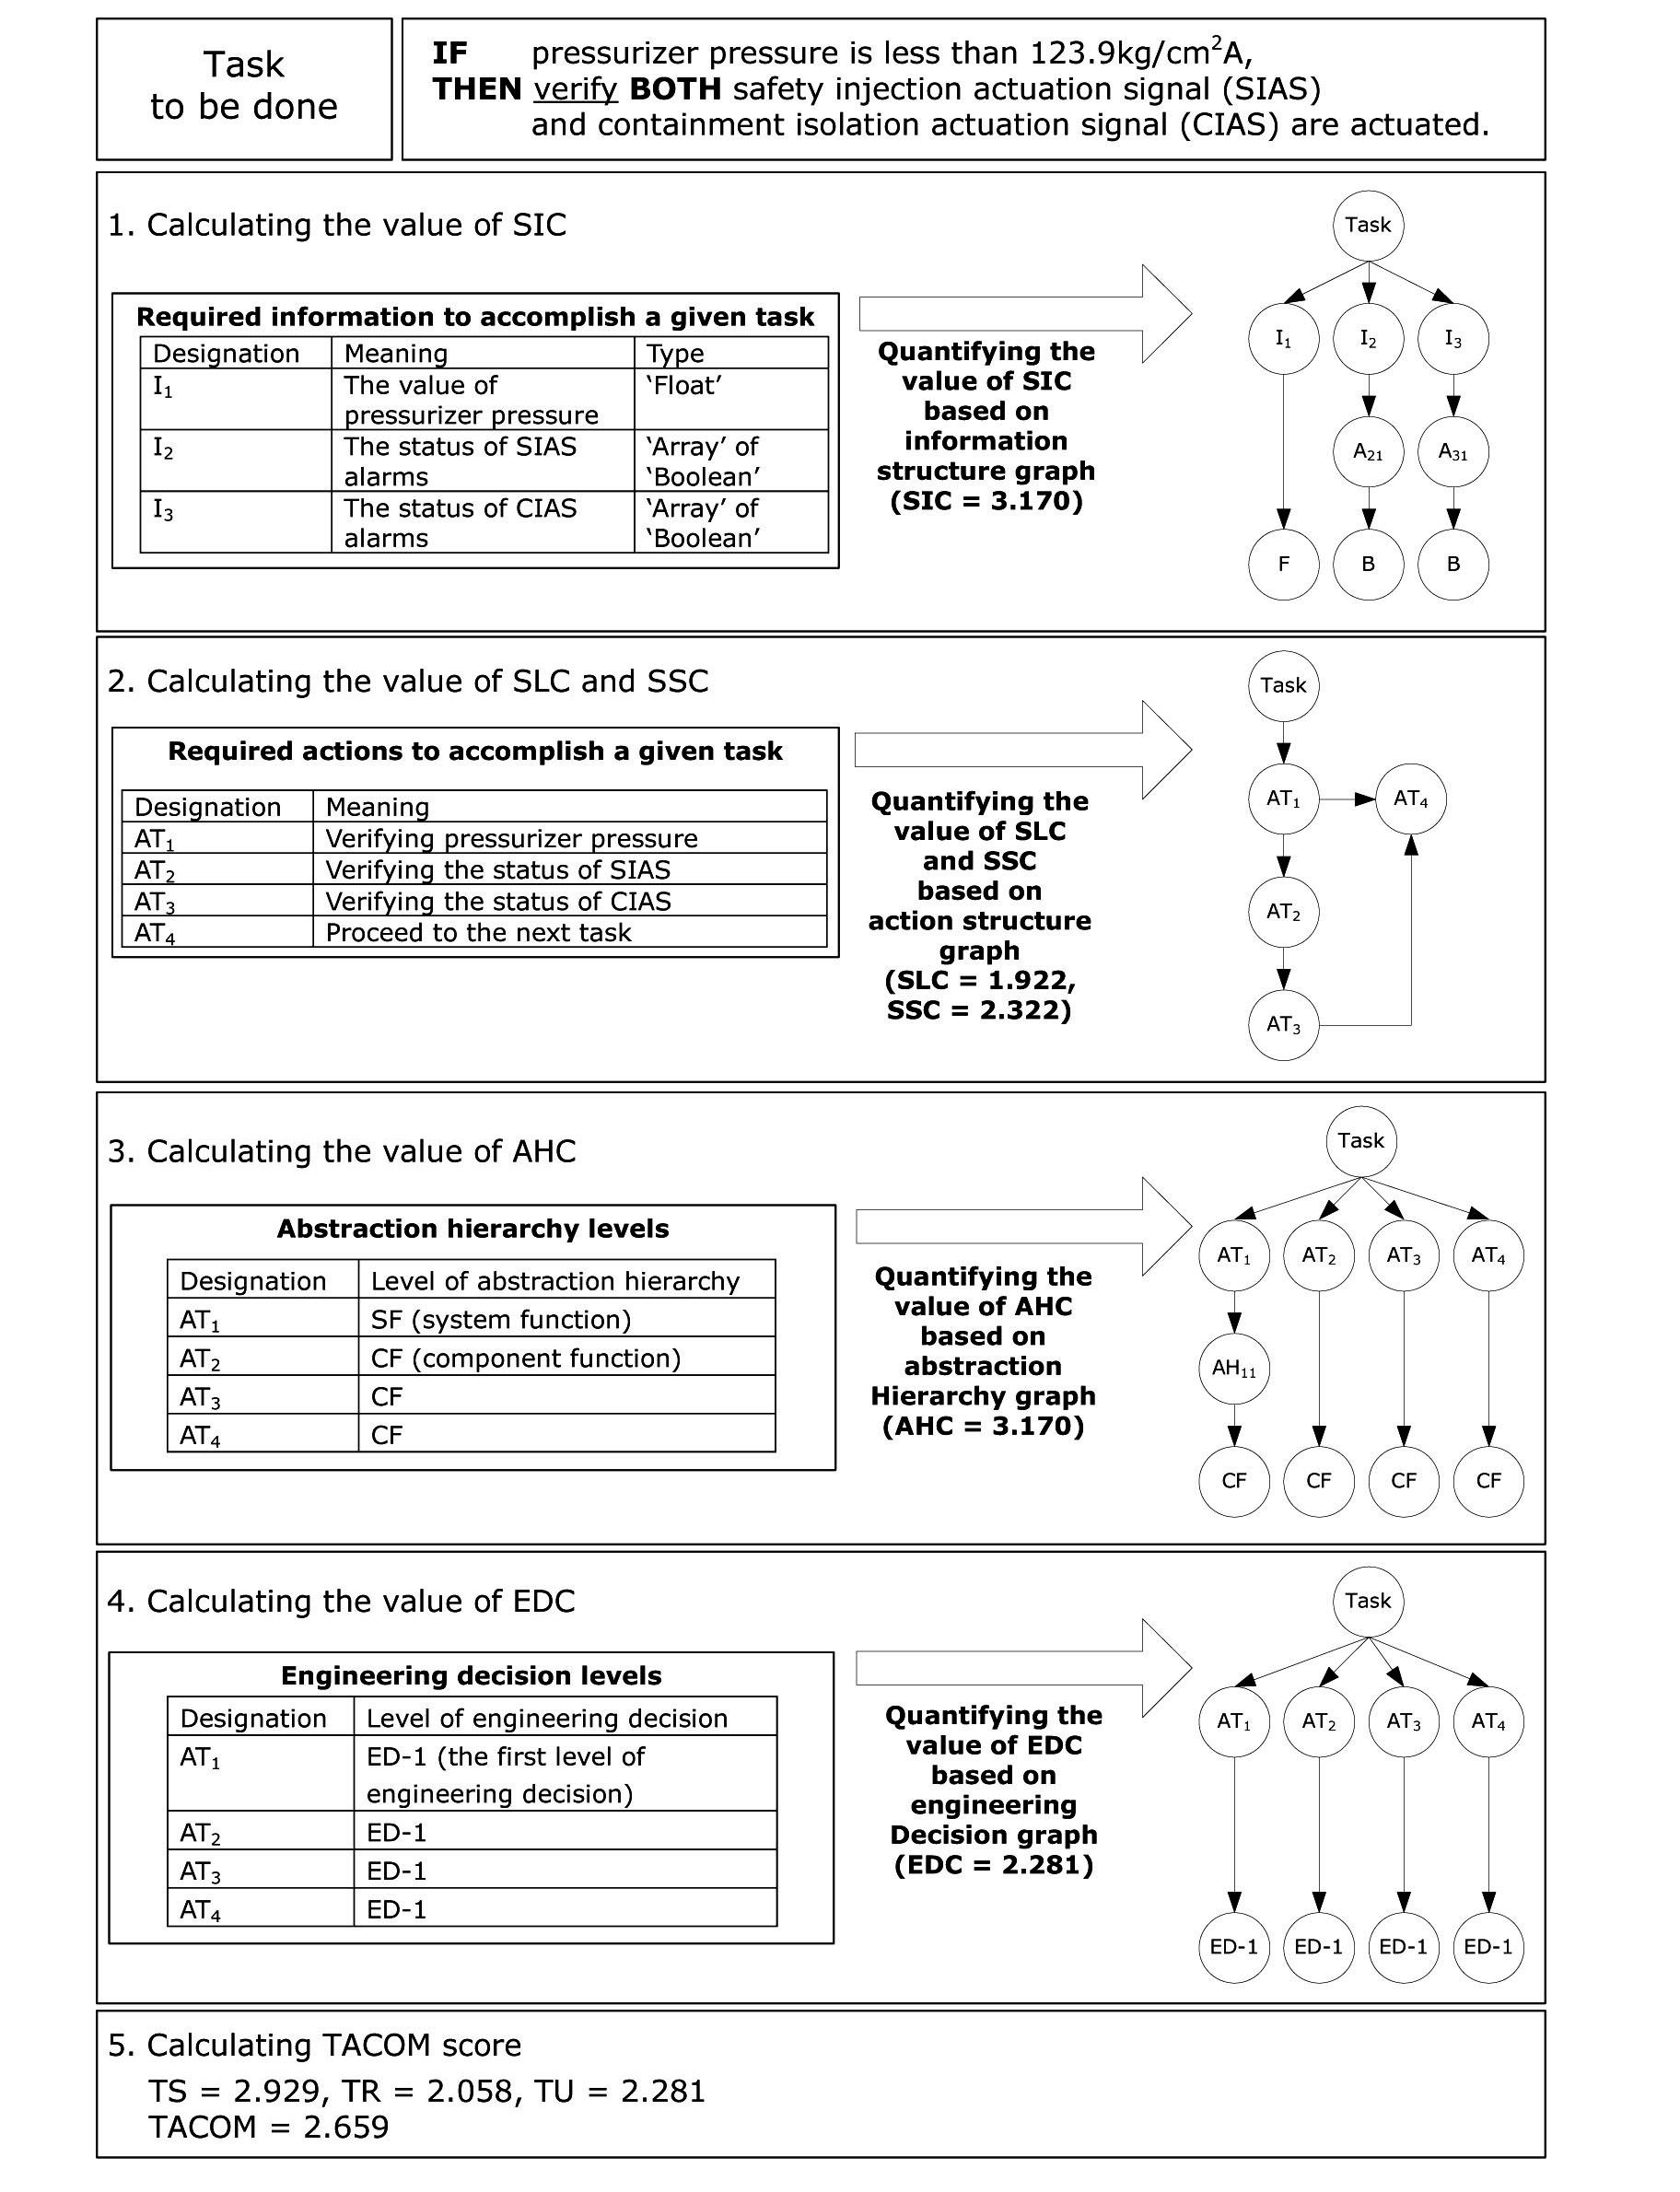
Figure 3 illustrates the whole process to quantify the value of each sub-measure, for a procedural step connected with the control of the pressurizer pressure ? see Figure 3 for the task description [20]. Table 3 identifies the elements entering in the calculation of the TACOM score. At first, the required information necessary for accomplishing the task isd. For the specific example in Figure 3, this corresponds to: (1) the value of the pressurizer pressure, (2) process alarms for indicating the actuation of safety injection (SI), and (3) those for containment isolation (CI). Then the specific operator actions (and their sequence) required to carry out the task need to be determined (AT1 to AT4 under step 2 in Figure 3). The calculation of the TACOM score then requires to distinguish the level of knowledge needed to carry out each action, from component level up to process level, step 3 in Figure 3 (see also levels in Table 3). For example, the action “Verify pressurizer pressure” requires system-level knowledge (the pressurizer is a system that consists of two or more components, e.g., the pressurizer heater and power operated relief valves). Finally, the level of engineering decision needs to be determined (depending on the cognitive effort required by the decision, see Table 3). The present example involves a simple comparison between the set point and the reading of the pressurizer pressure, which corresponds to the lowest level (i.e., ED-1 in Figure 3).
When the identification of all the required information and actions is completed, four graphs are constructed: (1) an information structure graph that represents the required information, (2) an action control graph that depicts the required actions with their execution sequences, (3) an abstraction hierarchy graph representing the system knowledge that is necessary to accomplish the required
actions, and (4) an engineering decision graph denoting the cognitive resources placed on operators. By using these graphs, the values of five sub-measures are calculated by the concept of the first and the second order graph entropy.
[Table 3.] Elements Entering the TACOM Calculation
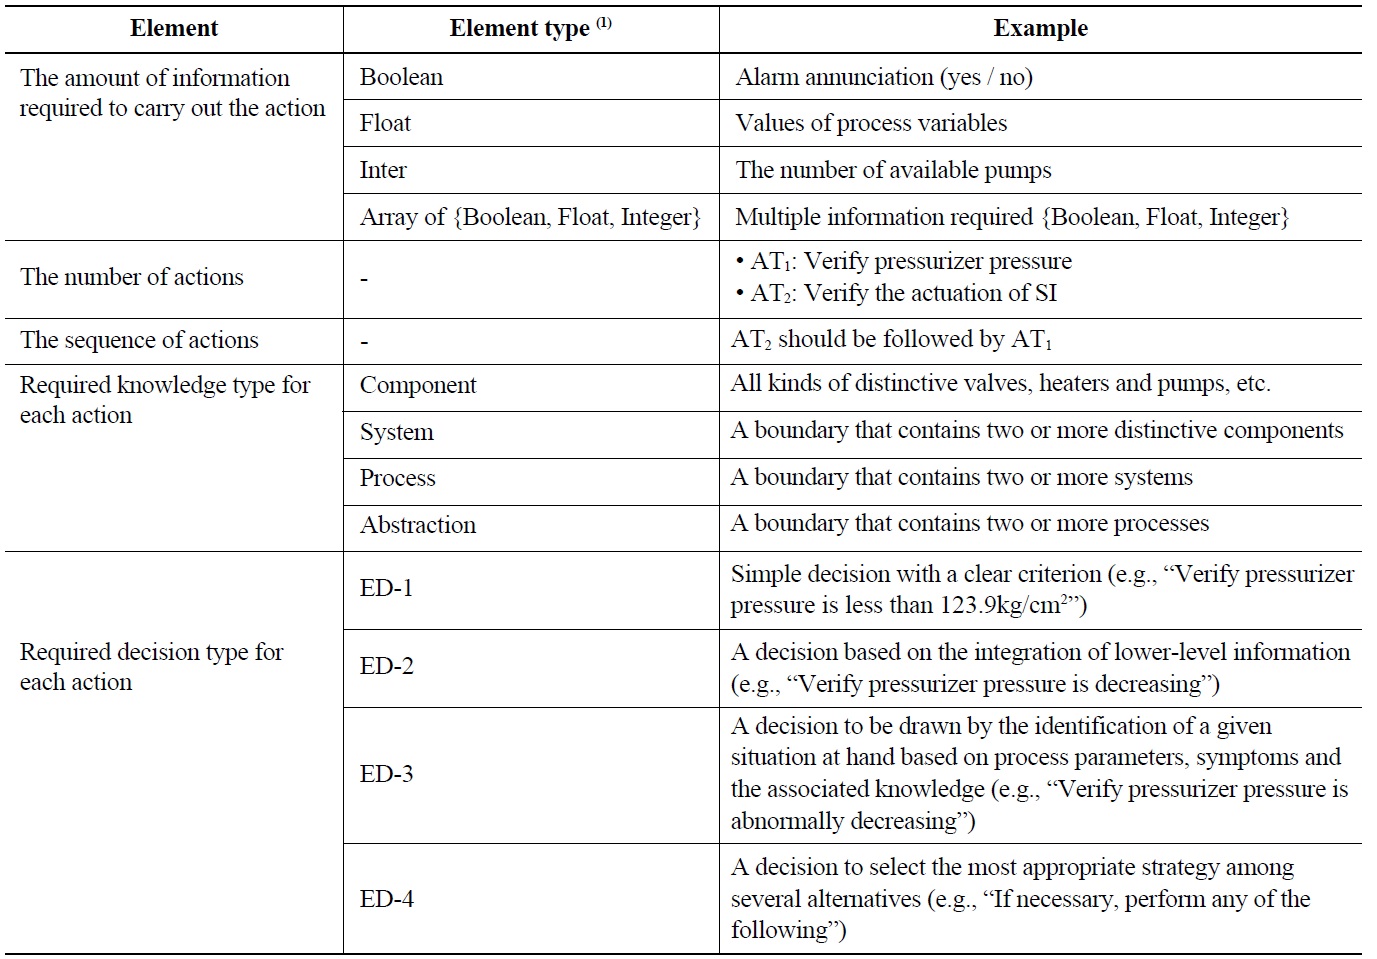
Elements Entering the TACOM Calculation
Finally, the TACOM score can be quantified by the formula given in Figure 2. More detailed explanations about the quantification of sub-measures can be found in [7].
3. METHODOLOGY FOR THE EMPIRICAL EVALUATION
As explained in the previous Section 2, the TACOM measure provides a quantitative index (a score) of the complexity of procedure-guided tasks, based on a number of objective elements (e.g., number of actions to be performed, corresponding indications, decision criterion at the basis of the procedural step, and the like). This is an attractive property for HRA, for which the subjective PSF evaluations are one of the reasons for the variability of the HRA results as well as the difficulty of collecting data for building and validating models, as discussed in the introduction. In this regard, the purpose of the present paper is to initially investigate the validity of the TACOM measure in representing the task complexity issues relevant to HRA models. Generally, a validity statement should address:
Whether the TACOM definition covers task complexity issues relevant to HRA models
Evidence that the TACOM score correlates with human error probabilities
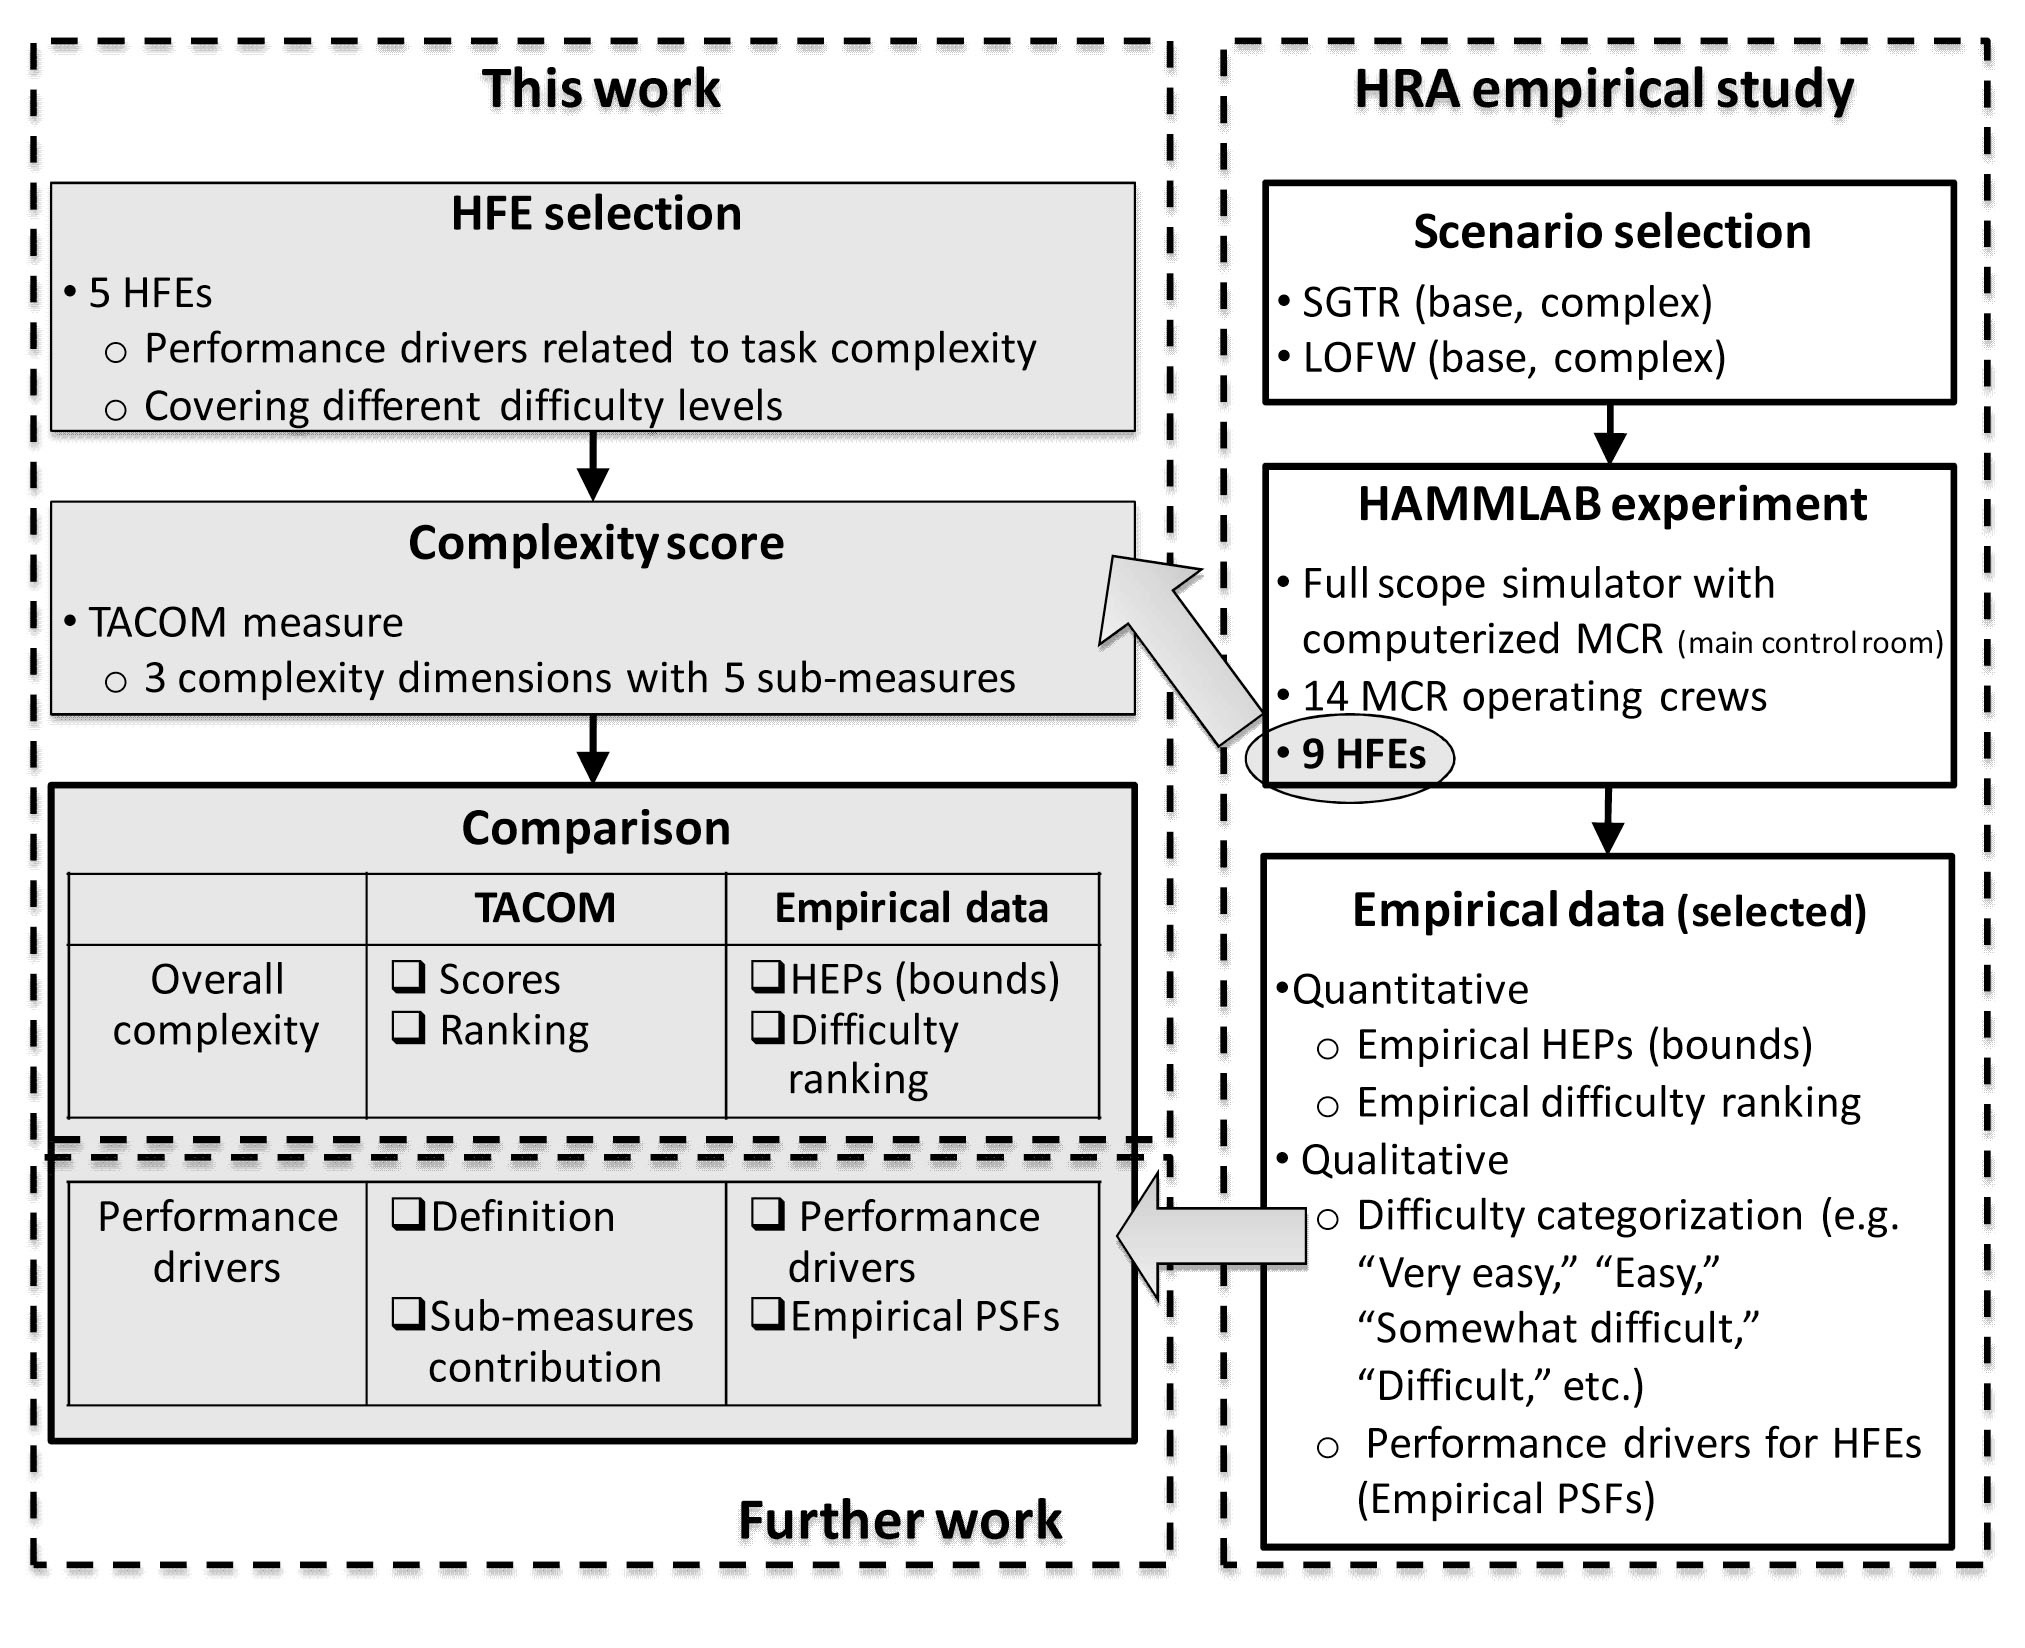
From these considerations, the TACOM measure is applied to multiple emergency tasks of different complexity, for which empirical evidence of the error probability is available (albeit with large uncertainty), along with evidence of the factors influencing it. Figure 4 gives an overview of the present study.
In particular, as depicted in Figure 4, the empirical basis (to which TACOM scores should be compared) is taken from the International HRA Empirical Study [2]. In the context of the Empirical Study, a number of emergency tasks were simulated, obtaining evidence on the error probability and on the factors influencing the performance on pre-determined Human Failure Events (HFEs) (Section 4 will present in detailical data from [2] used for the present study).
As shown in Figure 4, two levels of comparison are envisioned. The higher is at the overall complexity level (note the present paper focuses on this level). As explained in the previous Section 2, task complexity has multiple dimensions (e.g., TS, TR, and TU), and the TACOM measure provides an overall score aggregating these dimensions. At the higher level, the comparison aims at evaluating the TACOM measure as an overall complexity indicator. The lower level of comparison (out of the scope of the present paper) would address the definitions and values of the five TACOM sub-measures.
The comparison at the overall complexity level addresses two aspects (Figure 4):
The correlation between the actual TACOM scores and the empirical HEPs of the considered HFEs.
Whether the TACOM measure is able to provide a difficulty characterization coherent with the qualitative characterization as a result of the empirical evidence (in other words, the ability to discriminate between, e.g., “easy” and “difficult” tasks).
Concerning the first aspect, due to the limited number of HFEs available for the present study and to the large uncertainties associated with their (empirical) probability values, the comparison is not based on the calculation of statistical indices such as the correlation coefficient. Rather, a qualitative discussion of the TACOM-HEP trend was considered more appropriate (see Section 5). Due to this limitation, the second aspect above (qualitative characterization) becomes necessary. Along with the empirical HEPs, a piece of evidence from the HRA Empirical Study is the general characterization of the difficulty of each task. This comes in the form of a qualitative judgment (e.g., “easy”, “difficult”, “very difficult”) supported by a description of the operational difficulties connected with the task. The qualitative judgment is determined in [2] aggregating information both quantitative (e.g., the observed failures) as well as qualitative (e.g., possible operational difficulties observed that may not result in task failure). Due to the large uncertainty bounds for some of the HFEs considered, it is important to analyze how TACOM scores discriminate between the different difficulty categories, which, in turn, relates to different levels of error probability.
An important element to be considered in this study is the selection of the HFEs. The crew performance in the nine HFEs of the HRA Empirical Study [2] was not solely influenced by factors related to the task complexity (as measured by the TACOM measure). Other factors, both scenario-related (e.g., clarity of indications, time available to perform task) and crew-related (e.g., stress, work processes, communication), played important roles. From the point of view of the purpose of the present study, it is important to select HFEs for which the crew performance (and the error probability) is driven by complexity-related factors. For example, HFEs driven by other factors (e.g., clarity of indications) are not relevant because they are out of the scope of the TACOM measure. Another difficulty is that PSFs are interdependent, so that as one factor changes (e.g., as more complex tasks are considered) others change as well (e.g., stress increases, familiarity with the task decreases). As discussed in more detail in Section 4, in the present study, it is made sure that the task complexity is the main factor of primary influence.
As stated above, two levels of comparison are envisioned (Figure 4), with the second level related to the TACOM sub-measures. The sub-measures relate to the specific influences that determine the task complexity (e.g., number of actions involved, amount of information required, and amount of engineering knowledge required, etc.), and depending on the task, they contribute differently to the final TACOM score (Figure 3). Indeed, an important aspect to investigate is whether these differences in sub-measure contributions match the operational difficulties observed for the HFEs. These are reflected in the empirical PSF evaluations and descriptions of operational crew behaviors in the various tasks, derived in [2]. For example, observed crew difficulties due to the need to follow multiple parameters at the same time should be represented by a higher contribution of the sub-measure SIC, related to the amount of information to be processed to carry out the task (Table 1). This level of comparison provides information on the completeness of the TACOM definition (each of the task complexity issues emerging in the different HFEs should be represented by any of the TACOM sub-measures) as well as on the physical meaning of TACOM sub-measures. This investigation will be the subject of future work.
4. THE EMPIRICAL DATA (INTERNATIONAL HRA EMPIRICAL STUDY)
The data used for the empirical evaluation presented in this paper are taken from the International HRA Empirical study, which investigated the performance, strengths, and weaknesses of different HRA methods [1,2]. In the HRA Empirical Study, predefined emergency tasks carried out by operating crews in nuclear power plants were analyzed by different HRA teams using different HRA methods. These analyses were compared with empirical results obtained from experiments performed at the Halden Reactor Project HAMMLAB (HAlden huMan-Machine LABoratory) research simulator, with real crews (14 crews participated). The data was collected and interpreted by HAMMLAB experimentalists. A group of experts compared the performance data to the HRA predictions.
The data from the HRA Empirical Study relevant to the present paper consists of (for each analyzed HFE):
1. Difficulty ranking and qualitative difficulty characterization (e.g., “easy”, “difficult”, see Table 4).
2. Empirical HEPs. These were obtained from Bayesian update of a minimally informed prior (lognormal distribution with 1.2E-4 and 0.3 for the 5th and 95th percentiles, respectively) based on the number of failing crews out of the 14 crews.
3. PSF ratings. The empirical data was processed to determine the influences that each of the factors had on crew performance. The following ratings were used:
a. MND = Main negative driver
b. ND = Negative driver
c. 0 = Not a driver
d. N/P = Nominal/Positive driver.
Note that the development of the methodology to collect, interpret, and aggregate the raw data from the 14 crews (e.g., simulator logs, videos, operator interviews) into the above data form (difficulty ranking and characterization, empirical HEPs, PSF rating) was an important achievement of the HRA Empirical Study [1]. The description of this methodology is beyond the scope of the present paper.
Table 4 gives an overview of the empirical data used for the present study. The HRA Empirical Study addressed 9 HFEs, corresponding to a set of predetermined tasks on two variants (a “base case” and a “complex” one involving multiple additional failures challenging the crew response) of a Steam Generator Tube Rupture (SGTR) accident scenario. The HFEs (and the corresponding success criteria) were defined based on the main crew tasks in response to SGTR events:
HFE-1A and HFE-1B, identify and isolate the SGTR (base and complex case, respectively)
HFE-2A and HFE-2B, cool down the reactor coolant system (base and complex case, respectively)
HFE-3A and HFE-3B, depressurize the reactor coolant system (base and complex case, respectively)
HFE-4A, terminate safety injection (only base case)
HFE-5B1, Close Power Operated Relief Valve (PORV) ? PORV indicator shows closed (only complex case); HFE-5B2, Close PORV ? PORV indicator shows open (only complex case).
Of the above HFEs, five HFEs (HFE-2A, HFE-2B, HFE-3A, HFE-3B, and HFE-4A) were selected for the present study on the basis of the negative drivers identified from the Empirical Study: the HFEs for which task complexity issues resulted as negative drivers of the operator performance. To this purpose, Table 5 identifies which
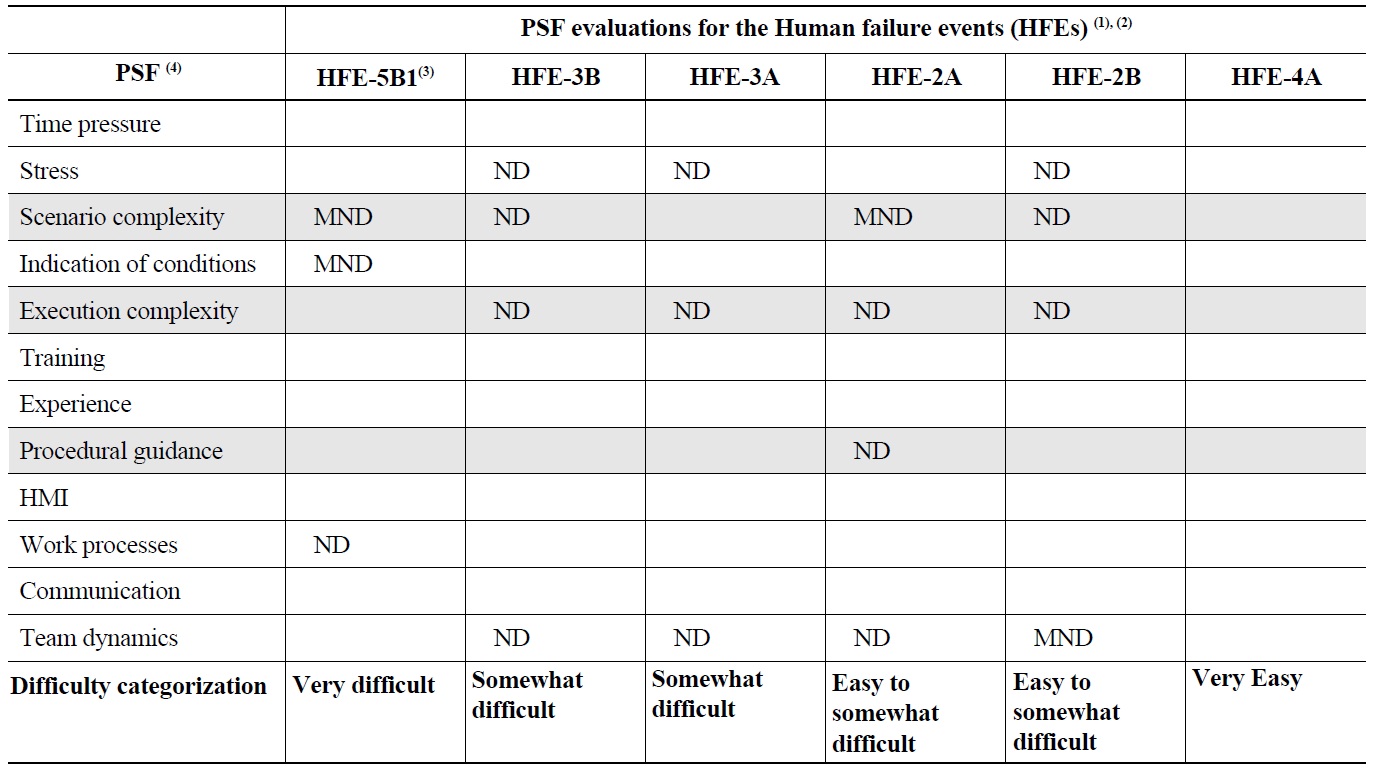
The Empirical Data for the Present Study: HFE Difficulty Ranking and PSFs Evaluations from the HRA Empirical Study
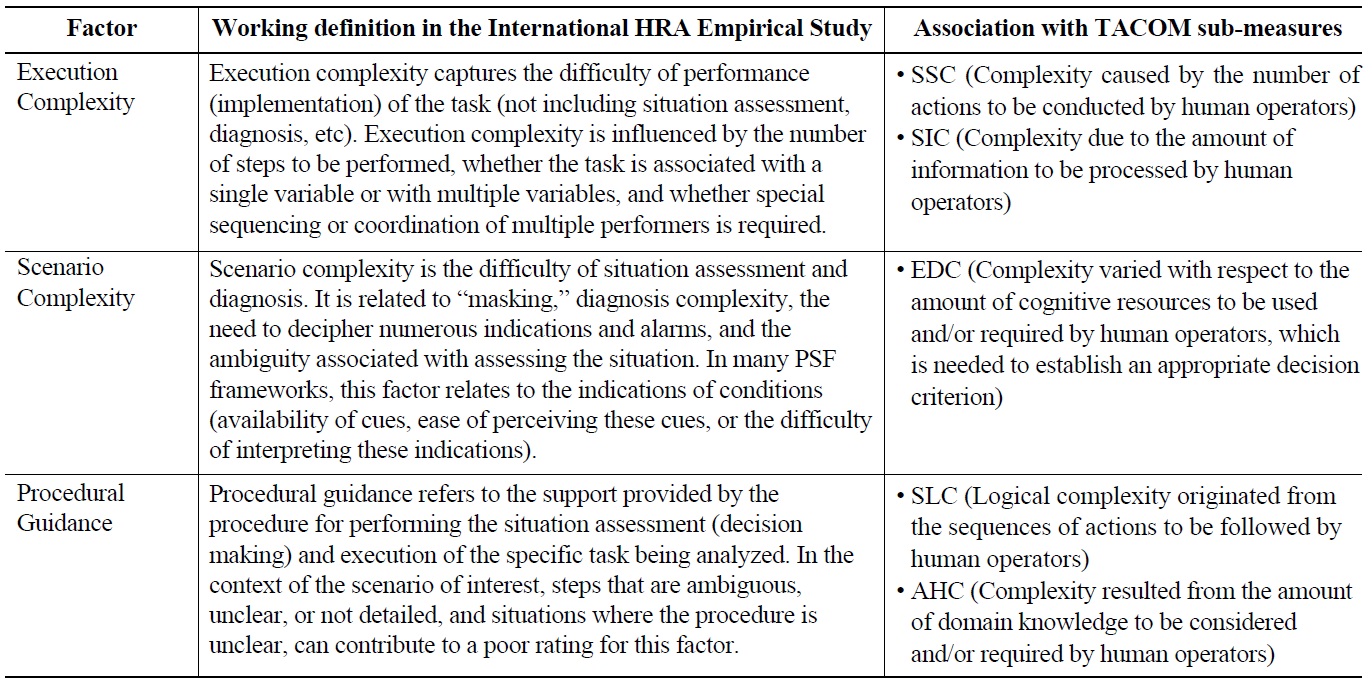
Identification of TACOM-related PSFs (from Definitions Adopted in the International HRA Empirical Study)
Empirical Study PSFs can be associated with the TACOM measure. For example, the definition of “Execution complexity” (as adopted in [1]) designates several attributes (such as the number of steps to be performed or the amount of variables) within the scope of the TACOM measure. Then, execution complexity issues are covered by submeasures SSC and SIC, because they quantify the complexity of procedure-guided tasks based on the number of actions and the amount of information to be processed, respectively. Similarly, “scenario complexity”, covering decision-making activities (such as situation assessment and diagnosis) can be associated with the elements of sub-measure EDC. Note that the associations in Table 5 are not crisp: some PSF elements can be associated with different sub-measures as well; Table 5 only highlights the most evident associations.
As shown by Table 4, the performance in the five selected tasks is not solely driven by the complexity-related factors (execution complexity, scenario complexity, and procedural guidance). In particular, the factors of “stress”, “team dynamics”, and “work processes” also played a role in some of these HFEs. Indeed, as explained in Section 3, the influencing factors are interdependent so that in general they cannot be changed one at a time: as the task changes, the influences of the other factors may change as well. In particular, this occurs for the observed negative influences of “stress” and “team dynamics”; as the task complexity
[Table 6.] TACOM vs. Empirical Results: Difficulty Characterization, Drivers, and HEPs
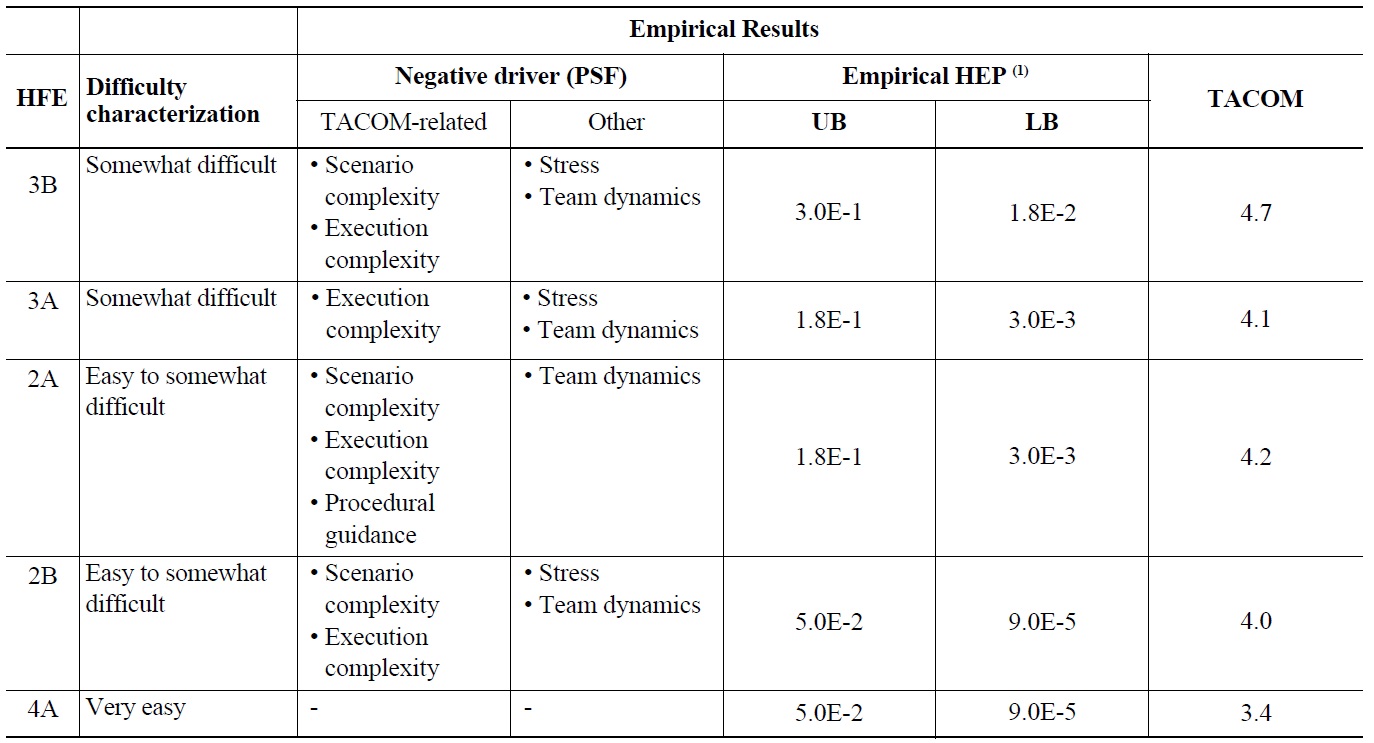
TACOM vs. Empirical Results: Difficulty Characterization, Drivers, and HEPs
characteristics change, the observed effect of “stress” and “team dynamics” are different. What is important is that task complexity-related factors of relevance for the TACOM measure are those driving the operator performance in the different HFEs (and therefore responsible for the HEP changes). Indeed, the same crews perform across all tasks so that crew-specific elements influencing crew PSFs (“stress”, “team dynamics”, and “work processes”) do not change across HFEs.
Table 6 presents the empirical results and the associated TACOM scores for each of the considered HFEs, characterized by task complexity-related dominant drivers (PSFs: scenario and execution complexity, and procedural guidance).
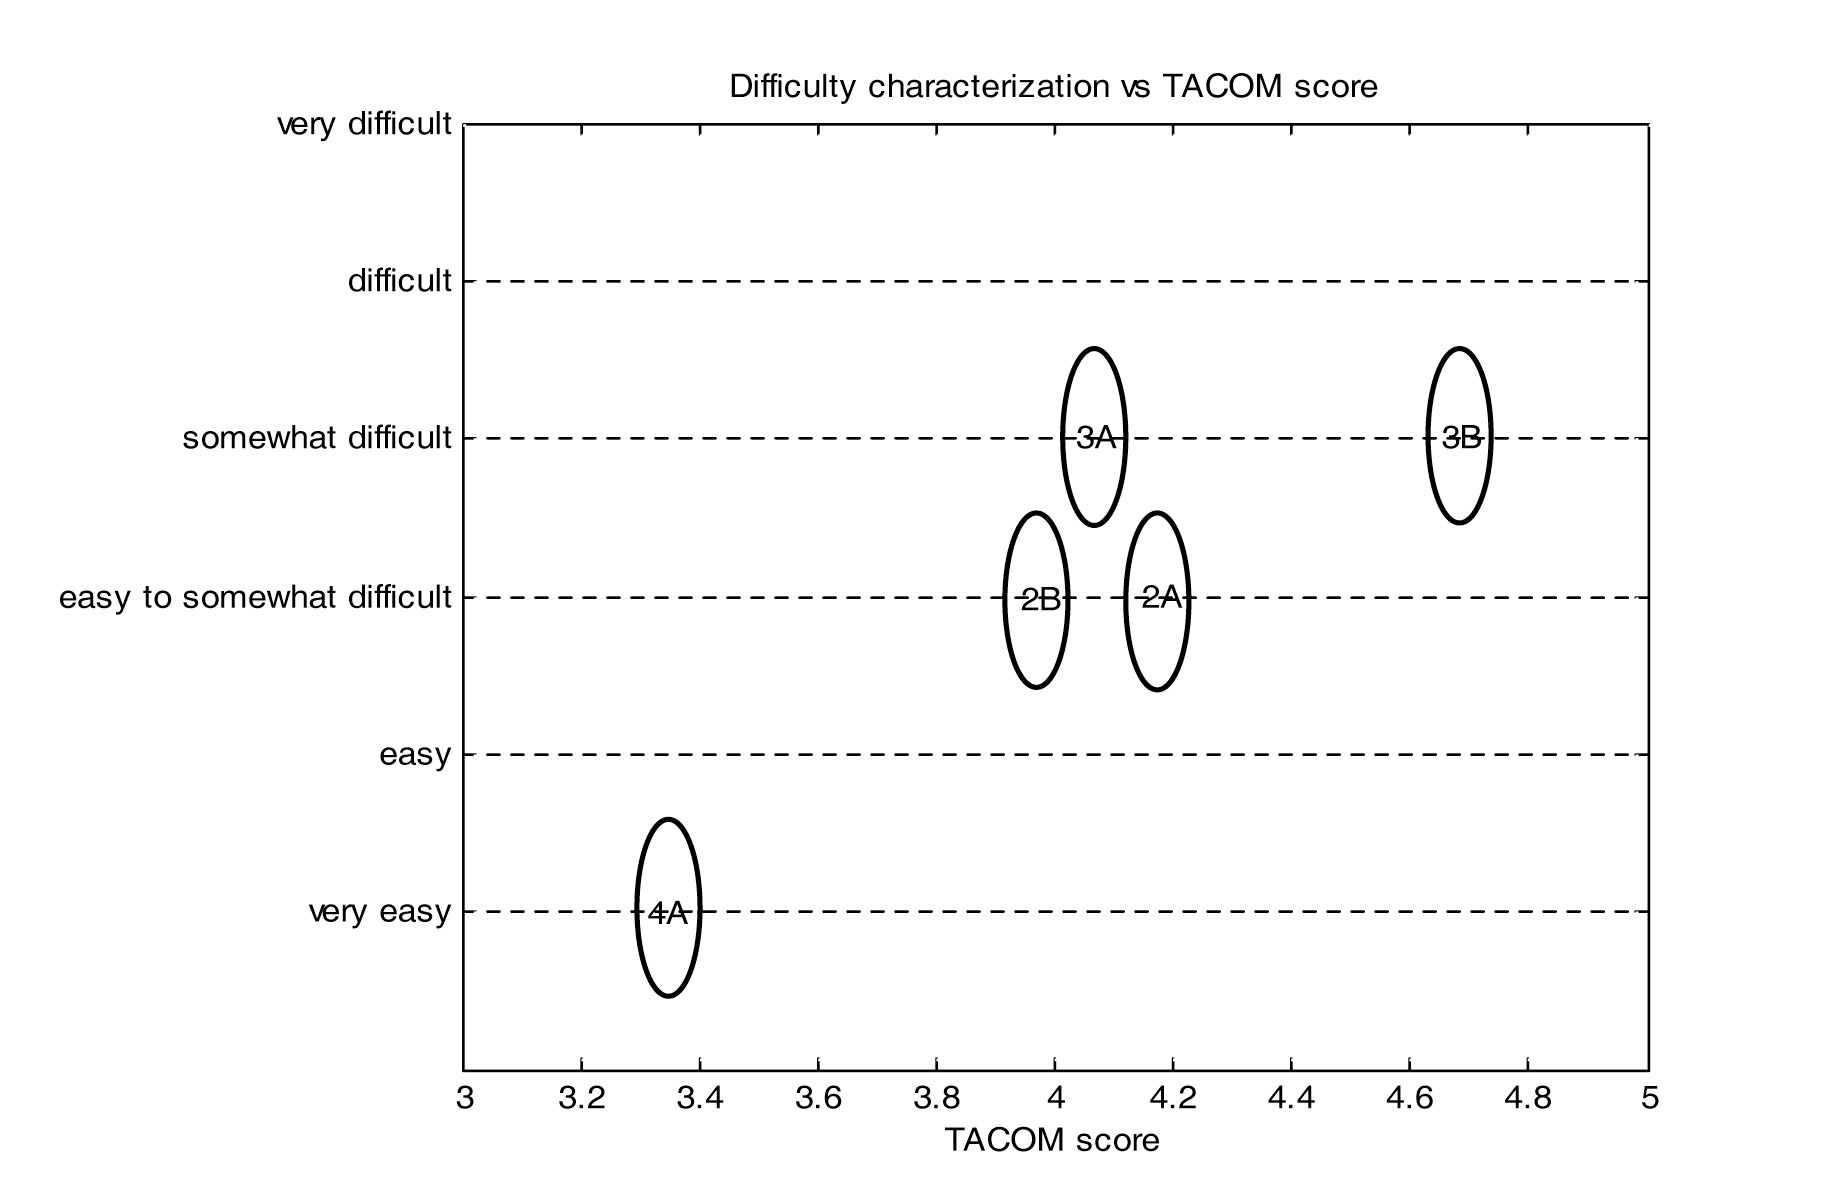
Table 6 shows that the variation of the TACOM scores generally reflects that of the difficulty characterization (except for the case of HFE-3A) ? this trend is also visible in Figure 5. For example, the difficulty characterization and the associated TACOM score of HFE-4A are “very easy” and 3.4, respectively. Those of HFE-2B are “easy to somewhat difficult” and 4.0. The TACOM score of HFE- 3B is 4.7, and the difficulty is characterized as “somewhat difficult”. The TACOM scores increase with the empirical task difficulty and appear well differentiated according to the different difficulty characterizations (except for the case of HFE-3A).
As noted, the TACOM score seems to under-estimate the difficulty of HFE-3A (Figure 5). The difficulty characterization of this HFE is “somewhat difficult”, but its TACOM score is 4.1, in practice coincident with that of HFE-2A and HFE-2B (“easy to somewhat difficult”). A possible explanation of this mismatch can be that the effect of the other drivers (i.e., stress and team dynamics PSFs,
out of the scope of the TACOM measure) is more significant on HFE-3A than on HFE-2A and HFE-2B; accordingly, the TACOM score (which is limited to treating task-complexity issues) does not properly represent the difference between HFE-3A and HFE-2A/HFE-2B. This aspect will be further clarified with the discussion of HFE-5B1.
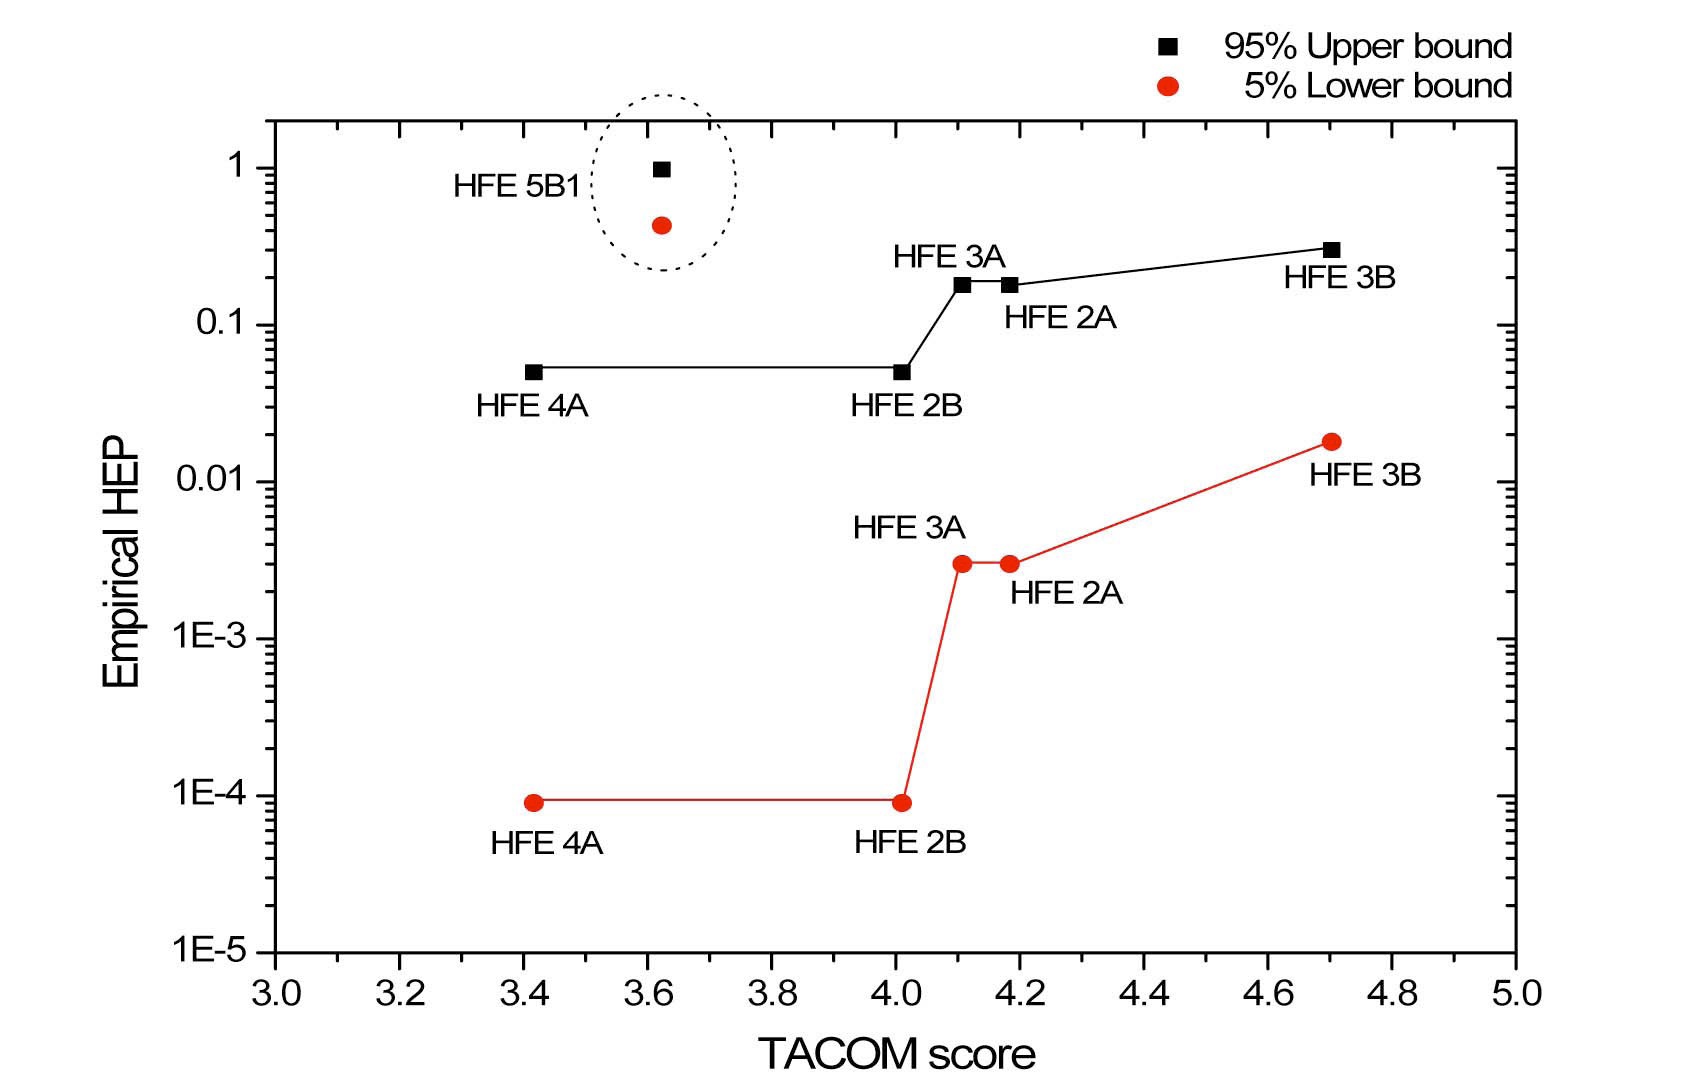
Figure 6 compares the TACOM scores with the (empirical) error probabilities ? empirical lower and upper bounds shown. The generally increasing trend (for HFE-4A/2B/3A/2A/3B) of the TACOM scores as the (empirical) error probability increases is confirmed. The trend in Figure 6 is monotonically increasing in the HEP bounds and does not show a peak in HFE-3A (suggesting underestimation by the TACOM score) as it could be expected from Figure 5. The reason is that, as stated in Section 4, the qualitative judgment on task difficulty from [2] is not only based on the observed failure counts, but also aggregates qualitative observations (e.g., possible operational difficulties observed that may not result in task failure). Indeed, HFE-2B and HFE-4A are associated different difficulty characterization (“very easy” for HFE-4A and “easy to somewhat difficult” for HFE-2B), although the empirical error bounds are the same (Figure 6). Similarly, HFE-3A and HFE-2A are characterized as “somewhat difficult” and “easy to somewhat difficult”, but the error bounds are equal. The monotonic trend of Figure 6 as opposed to Figure 5 should not lead to the conclusion that the TACOM measure is generally representing better the error probability (Figure 6) compared to the difficulty characterization (Figure 5). Indeed, the information content behind the qualitative characterization is richer than for the empirical HEPs: the uncertainty in the empirical HEPs is quite large and the difference between HFE-4A/2B and HFE-3A/2A is just of one failure count (zero failures observed for HFE-4A/2B, one failure observed for HFE-3A/2A). The conclusion from both Figure 5 and 6 should be that of a generally visible increasing trend of the TACOM as the error probability increases (determined based on failure counts as well as supplementing failure counts with qualitative information).
The aspect of the mismatch within the complexity characterization of HFE-3A can be further clarified if we consider HFE-5B1 with difficulty characterization, associated TACOM score, upper and lower bound of empirical HEP of: “very difficult,” 3.6, 0.98 and 0.43, respectively. As shown in Table 4, the dominant drivers of HFE-5B1 are: (1) scenario complexity, (2) indication of conditions, and (3) work processes. Although one ofant drivers is the scenario complexity (therefore within the scope of the TACOM measure), the TACOM score strongly underestimates the difficulty of this HFE, as shown in Figure 6.
Indeed, all of the crews failed to accomplish HFE- 5B1 because of the degraded indication information that corresponds to the PSF indication of conditions [2]. In particular, success in this HFE required indications that were not available within the timeframe defined as success criterion (which would become visible afterward). The TACOM score does not consider the effect of missing or degraded indications (Figure 3), so that the difficulties associated with HFE-5B1 are clearly not within its scope. Correspondingly, the TACOM score of 3.6 for HFE-5B1 is close to that of the “very easy” HFE-4A.
As mentioned in Section 3, further investigation of the relationship between the specific performance drivers and the definitions and values of the TACOM sub-measures is foreseen as future activity. This is expected to shed additional light on the specific contributions of each of the TACOM inputs to the sub-measures and of each of the sub-measures to the overall score.
This paper has presented an empirical evaluation of the TACOM measure as an indicator of the task complexity issues relevant to HRA. The TACOM measure is attractive for HRA because it is defined on objective elements (e.g., number of tasks to be performed, amount of information required and logic structure of the task performance paths, etc.). The adoption of the TACOM measure to represent task complexity issues in an HRA model (e.g., to measure a task complexity PSF) would allow less subjectivity in the evaluation of this factor when applying an HRA method as well as when collecting HRA data
The empirical evaluation (on five human failure events selected from those addressed in the HRA Empirical Study) has shown promising results. The TACOM score increases as the empirical HEP of the selected HFEs increases. These HFEs were selected based on whether their error probability (from the empirical evidence) was driven by issues that could be related to any of the TACOM sub-measures. This strongly supports that the TACOM measure is representative of the performance issues driving the difficulty of the considered tasks, and quantitatively suggests a relationship between TACOM scores and the error probability. Except for one case, the relative differences in the TACOM scores are coherent with the (qualitative) difficulty characterization from the empirical results: TACOM scores are well distinguished if related to different categories (e.g., “easy” vs. “somewhat difficult”), while values corresponding to tasks within the same category are very close.
Some limitations of the present study need to be underscored. The limited number of HFEs considered in the study and the large uncertainties in their failure probabilities do not allow obtaining conclusive results on the evaluation of the TACOM measure as task complexity measure for HRA purposes. In addition, the TACOM-HEP relationship should be investigated also on different profiles of the other PSFs (in which task complexity issues are not the primary performance drivers), so that the interdependence between TACOM scores and the other PSFs would also be accounted for. As mentioned in the present paper, an important next step is the evaluation of the TACOM submeasures: these relate to specific influences on the task complexity, contributing with different weights to the TACOM measure. These sub-measure contributions need to be evaluated in light of the operational difficulties observed in the different HFEs, providing information on the completeness of the TACOM definition (each of the task complexity issues emerging in the different HFEs should be represented by any of the TACOM sub-measures) as well as on the relative weights with which the submeasures enter in the TACOM formula.
Despite the limitations, this paper has presented one of few attempts to empirically study the effect of a performance shaping factor on the human error probability. Typically, the effect of these factors is studied on operator performance measures (e.g., time to complete the task or, providing a more complete characterization, workload or situation awareness indications); but for HRA applications the link to the human error probability needs to be addressed. These types of studies are important to enhance the empirical basis of HRA methods, to make sure that the definitions of the PSFs cover the influences important for HRA (i.e. influencing the error probability) and that the quantitative relationships among PSFs and error probabilities are adequately represented. However, a prerequisite for these studies is a better definition (to the extent possible objective and supported by detailed guidance) of the PSFs, toward the establishment of a direct link between collected data and the associated PSFs ratings. The TACOM measure has shown promising features in this respect.


