Patients with heart disease need long-term monitoring of the electrocardiogram (ECG) signal using a portable electrocardiograph. This trend requires the miniaturization of data storage and faster transmission to medical doctors for diagnosis. The ECG signal needs to be utilized for efficient storage, processing and transmission, and its data must contain the important components for diagnosis, such as the P wave, QRS-complex, and T wave. In this study, we select the vertex which has a larger curvature value than the threshold value for compression. Then, we reconstruct the compressed signal using by radial basis function interpolation. This technique guarantees a lower percentage of root mean square difference with respect to the extracted sample points and preserves all the important features of the ECG signal. Its effectiveness has been demonstrated in the experiment using the Massachusetts Institute of Technology and Boston’s Beth Israel Hospital arrhythmia database.
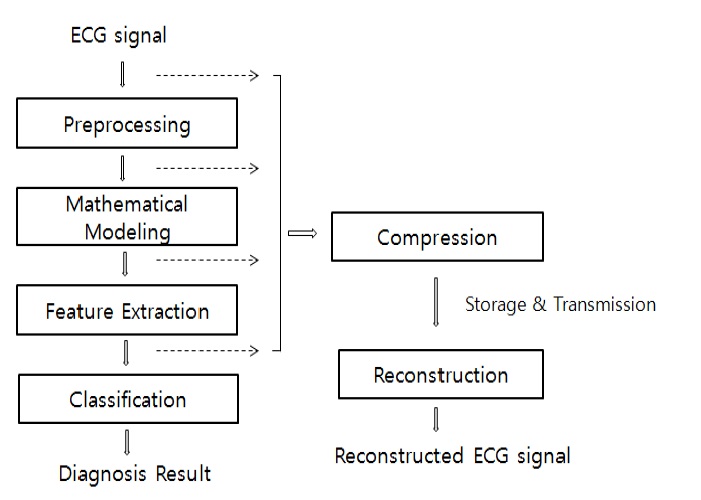
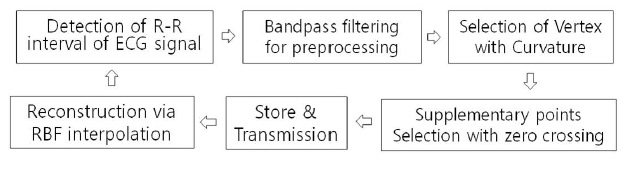
Electrocardiogram (ECG) is an invaluable tool for diagnosis of heart diseases and prognosis observation, which records the electrical activity of the heart. A large amount of data needs to be compressed for storage and transmission because generally an ECG signal has a sampling frequency of over 200 Hz. A high performance processor with mass storage is necessary to precisely digitize the ECG data, which leads to the difficulty in developing portable ECG devices because of limited resources. In addition, the ECG data must be managed with efficiency for long-term monitoring of the patient’s heart condition [1-3]. Therefore, data compression needs to be employed for efficient storage, processing and transmission. Data compression is the process of detecting and eliminating redundancies in a given data set and must achieve maximum data reduction while preserving the significant morphological features upon reconstruction. The reconstruction should be made within a predefined tolerance. Figure 1 shows the overall block diagram of the ECG signal model for compression and classification of a disease syndrome.
The compression schemes of the ECG data that have been studied thus far are the direct time-domain and transform domain techniques. Various research works have been presented
for the exact delineation of ECG signals based on numerical differentiation, pattern recognition, and mathematical models. The direct techniques include the amplitude zone time epoch coding (AZTEC), fan, differential pulse code modulation (DPCM), turning point (TP), and the coordinate reduction time encoding system (CORTES) algorithms [4-6]. Because these techniques detect and eliminate data redundancies, they have shown more efficient performance. However, they generate a large reconstruction error with a quite high signal distortion. The transformation methods include the wavelet transform (WT), discrete cosine transform (DCT), fourier transform (FT), walsh transform, karhunen loeve transform (KLT), and so on [7-9]. Most of these transforms compact the signal’s energy into a few transform coefficients, which implies that many of the transform coefficients have little energy and can be discarded.
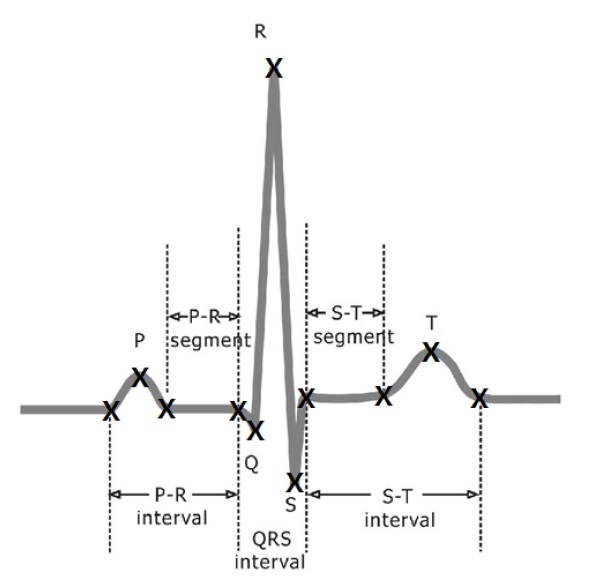
The compression techniques for the ECG signals should not cause any loss of relevant medical information, and high compression ratio (CR) is desired. The CR is defined as the ratio between the original and compressed signals. The error is evaluated as the percentage of root mean square difference (PRD) between the original and reconstructed signals. To improve the ECG compression quality, the algorithms should reduce the PRD without distorting any relevant diagnostic information. In this paper, we show that the compression must retain all specific points in the ECG signals and that the parameters of the ECG mathematical model can be used to reconstruct the ECG signal. A typical ECG signal has a P wave, QRS-complex, and a T wave, as shown in Figure 2, all of which are important components of the diagnosis. These feature points have a larger signal variation rate than the other regions. Therefore, we first
select the vertices that have larger curvature values than the threshold value, and add supplementary points with the zero crossing points. Subsequently, we reconstruct the compressed signal using radial basis function (RBF) interpolation. In general, the RBF interpolation method is mainly used in geological applications [10]. Geological application involves three dimensional modeling. However the ECG signal is two dimensional; therefore, the ECG signal modeling is simpler than the geological modeling. Moreover, the RBF efficiently represents a system with a nonlinear property, such as the ECG signal. The implemented method has been verified to have a very low reconstruction error and to maintain important components for diagnosis information.
This paper is presented as follows. The second section presents the general theories of the RBF interpolation and the algorithm that obtains the vertices based on the curvature. Then, the third section provides the experimental results of the proposed method. The conclusion is presented in the final section.
2. Compression with Reconstruction via RBF Interpolation
2.1 RBF Interpolation Overview
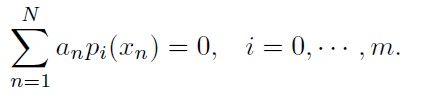
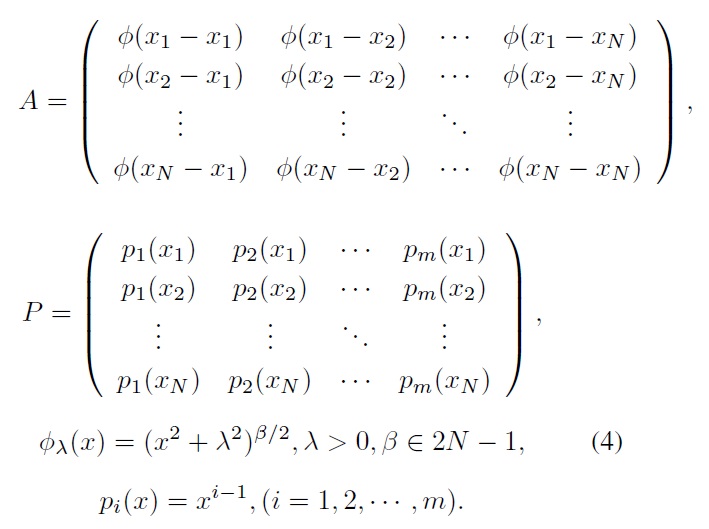
The RBF is an approximation model for multivariate interpolation, which has been widely used in many engineering branches. In this section, we introduce the basic theory of RBF interpolation [11,12]. We assume that a continuous function
The RBF interpolation of
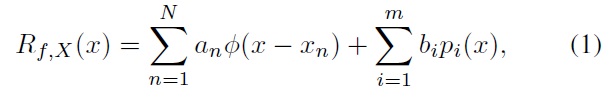
where
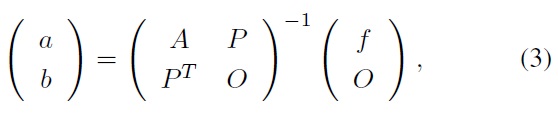
The coefficients of
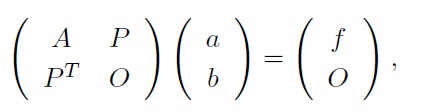
where
2.2 Vertex Selection Based on the Curvature
Curvature refers to the deviation rate of a curve or a curved surface from a straight line or plane surface tangent to it [13]. The curvature value of the input ECG signal is calculated for the vertex selection, which has a larger curvature value than the threshold value. Initially, the original ECG signal is preprocessed by band-pass filtering at 0.5?25 Hz to reduce the ECG signal noise [14] because a typical ECG signal contains a 60 Hz power line noise, baseline wander, and muscle noise. Then, a Gaussian LPF is used to eliminate the high frequency noise in the preprocessed ECG signal. The curvature is calculated for vertex selection with the smoothed ECG signal.
The curve function with a time variable is represented by
O(t) = (s(t), v(t)),
where
C(t, σ) = (S(t, σ), V(t, σ)),
where
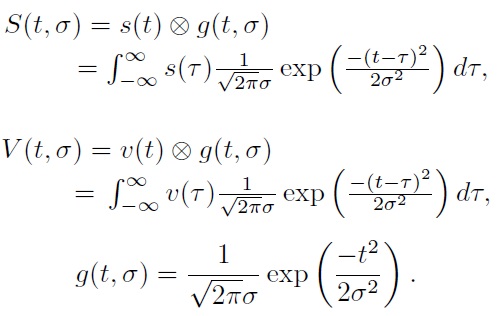
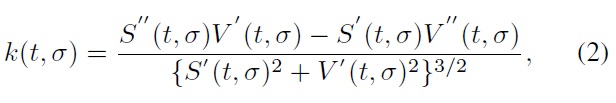
where
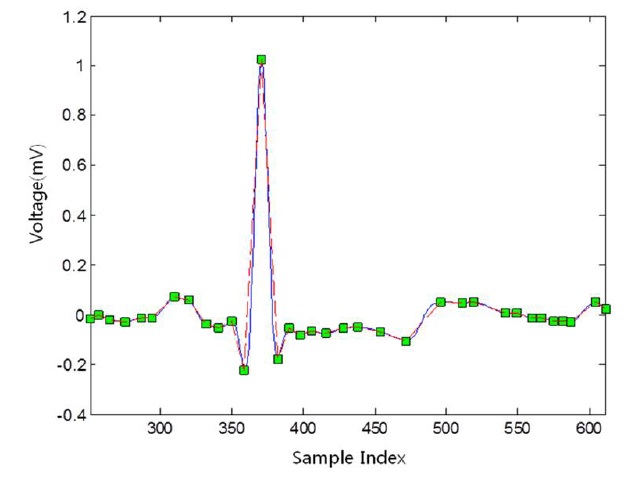
Finally, the vertices are selected by the curvature, whose value is calculated by Eq. (2) to be more than the threshold value. Figure 3 shows the restored ECG signal based on the selected vertices, marked as small square boxes.
2.3 Reconstruction via RBF Interpolation with the Selected Vertex
The compression process must retain all specific points in the ECG signal, which are the important components for diagnosis. These points include the local maximum and minimum points of the ECG signal, such as the P, Q, R, S, and T waves [15]. The significant points selected from Section 2.2 will be used as the parameters for signal reconstruction using the RBF interpolation. The selected vertex has a larger curvature value than
the threshold value. However, the restored ECG signal with the selected vertices based on the curvature is not sufficiently complete because of over-distortion with the original ECG signal. Therefore, for pertinent RBF interpolation, zero crossing points are selected as supplemental points on the sampled data of the ECG signal and added to the initially selected vertices. The block diagram of the global compression and reconstruction processes is shown in Figure 4.
For a given sample data set
where
In this study, we use the basis function called multiquadrics among the many RBFs. One of the reasons for choosing this particular function is our desire to use the parameter as a tension parameter. The value of
3. Experimental Results and Discussions
In this study, an experiment to evaluate the proposed method is conducted using the MIT-BIH arrhythmia database [16]. The MIT-BIH arrhythmia database has a 360 Hz sampling frequency acquired in 1800s. The personal computer used in this experiment has a 2.40 GHz Core2 Quad CPU, and a 2 GByte memory. The Matlab R2010a compiler is adopted. The ECG signal is sampled within a 0.0028s period. We choose a signal period that matches with the cardiac cycles. To identify the cardiac cycles in the ECG signal, R wave detection is performed as a preliminary step.
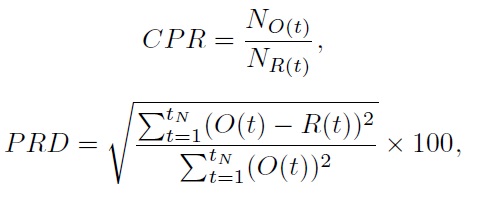
To evaluate the performance of the ECG signal, we use the compression points ratio (CPR) instead of the CR and the PRD. The CPR is defined as the ratio between the number of samples in an average cycle period of the original signal and the compressed signal sample points. The CPR and PRD are defined as follows:
where
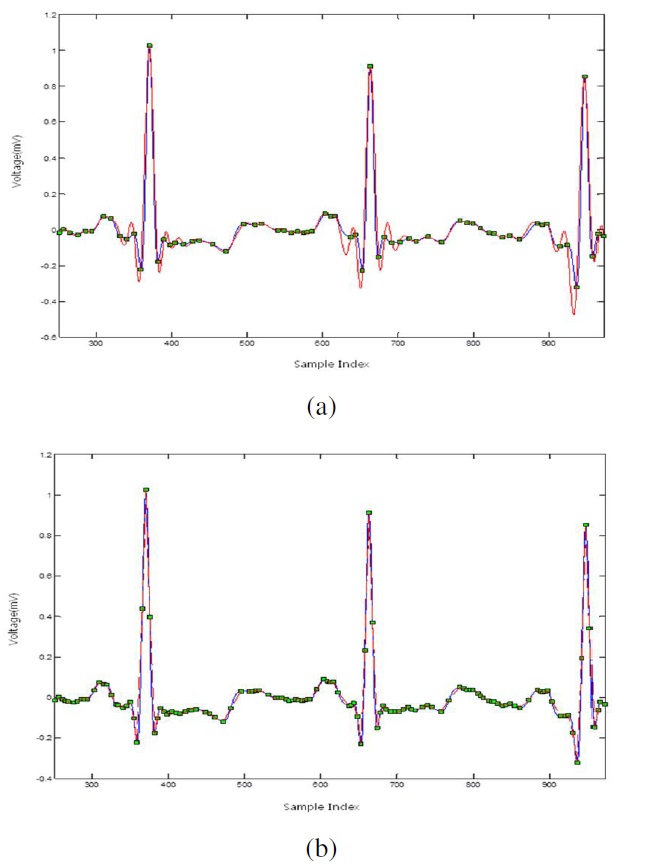
Figure 5 shows the reconstructed signal with RBF interpolation using the dataset with vertices based on the curvature (a)
and the supplemental dataset with the zero crossing points (b). The reconstructed signal with vertices based on the curvature is not sufficiently complete because it has an over-distortion with the original signal. Therefore, it needs supplementary points which are beneficial for RBF interpolation. We select the additional zero crossing points that can help in the reconstruction by the RBF. We used multiquadrics as the basis function of the RBF and used the third-order algebraic polynomials. More issues have to be addressed in reconstructing the curve using multiquadrics. The tension parameters such as
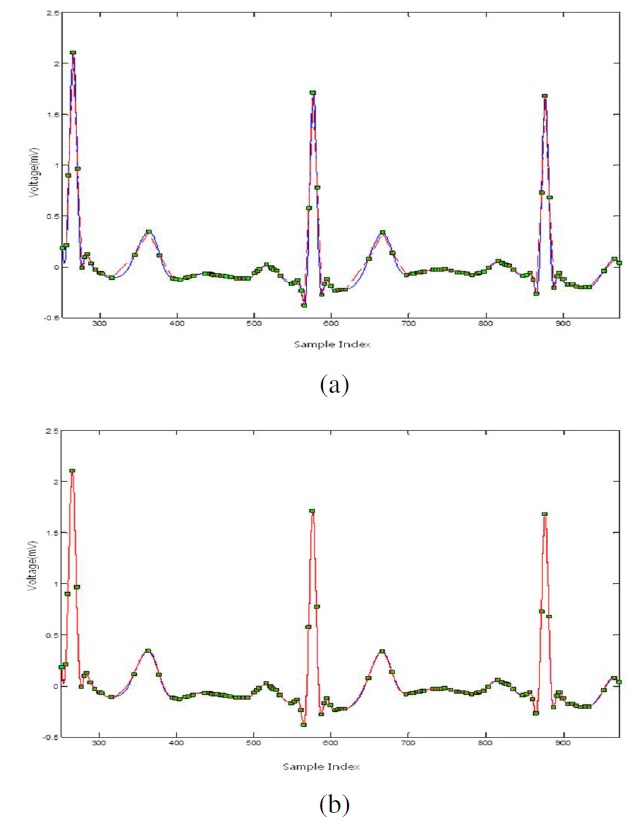
Figure 6-(a) and (b) show the reconstructed signal via linear and RBF interpolations, respectively, using the MIT-BIH arrhythmia database based on record 103 of the ML II signal.
The blue line is the original ECG signal, and the red line is the reconstructed signal.
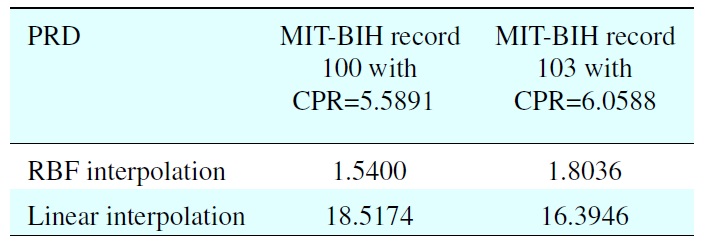
We compared the evaluation by the linear function, and it was clear that the implemented method provided a remarkable performance and a low restoration error rate, as shown in Table 1. The best performance with PRD = 1.5400 via RBF interpolation is within the “very good” quality range at
The ECG signal needs to be utilized for efficient storage, processing and transmission, and its data must retain their important components for diagnosis information, such as the P wave,
[Table 1.] Performance comparison of the RBF and linear interpolations using the proposed algorithm

Performance comparison of the RBF and linear interpolations using the proposed algorithm
QRS-complex, and T wave. This study has demonstrated an efficient method that reconstructed the transmitted ECG signal with the minimum amount of compressed data. The ECG data were compressed to selected sample points, which were the vertices with large curvature, and zero crossing supplemented vertices in the original signal. The signal was reconstructed by RBF interpolation. The multiquadric function was used as the basis function because it has a tension parameter that could influence the smoothness. The reliability of the proposed method was clearly verified with a very low reconstruction error, in addition to maintaining the diagnostic features. Improvement in the compression rate via RBF interpolation with vertex, including the diagnostic components, is left as a topic for future research.
No potential conflict of interest relevant to this article was reported.