Mass spectrometry (MS)-based quantitative proteomics has been applied to solve a wide variety of biological problems, and several MS-based workflows have been developed for protein and peptide quantitation1. In mass spectrometric quantitation methods it is usually assumed that the measured signal has a linear dependence on the amount of material in the sample for the entire range of amounts being studied. A prerequisite for accurate quantitation is that unwanted experimental variations in sample extraction, preparation, and analysis be minimized, and it is therefore critical that each step in the workflow is optimized for reproducibility.2 Presently proteomics utilizes highly sensitive instruments for analysis of the proteome. The proteins are identified by either matching the masses of several of the observed peptides to those predicted for a protein in a database (peptide mapping), or by obtaining sequence information from a single peptide by tandem mass spectrometry (MS/MS).3,4
Sample preparation is a vital step in proteomics which can greatly affect the proteome data at the end of an experiment after investing days of work with most sophisticated instruments available nowadays. Developments over the recent years have provided us with more sophisticated and sensitive instruments to quantify highly complex biological samples. Label free proteomics usually involves three steps including sample preparation (protein extraction and digestion), peptide separation and data analysis.5 Label free quantification has a wide range of advantages over other methods used in proteomics. Inspite of these sensitive instruments and good software, quantification may cause unreliable results if the sample preparation step is not efficient and reproducible.
In the present study we intend to introduce a new platform for the efficient and reproducible analysis of the complex biological samples using label free quantification. The proteolysis cartridges embedded with trypsin cleaves the protein efficiently in reproducible manner. We wish to introduce the online system in the present proteomics pipeline for identification of proteins in high throughput complex biological sample.
Bovine serum albumin (BSA) was purchased from Sigma, Human lung cancer cell line (A549) was purchased from American Type Culture Collection (ATCC). Tris (2- carboxy- ethyl) phosphine (TCEP) was obtained from Thermo Fisher Scientic (Rochford, IL, USA). Iodoacetamide (IAA) was acquired from SigmaAldrich (St. Louis, MO, USA). Spin column was purchased from Havard Apparatus (Massachusetts, Boston, USA). Sequencing grade modified trypsin was obtained from Promega (Madison, WI, USA). Acetic acid, acetonitrile and high-performance liquid chro-matography (HPLC) grade water from J.T. Baker (Phillipsburg, NJ, USA) were used for the study. Protease inhibitor cocktail and phosphatase inhibitor cocktail tablets were obtained from Roche (Pleasanton, CA, USA).
Two different experiments were carried out using eight different concentrations of albumin using online and offline (in-solution) digestion protocol. BSA was dissolved in milliQ water and the protein was denatured by adding 8 M Urea in 0.1 M Tris-HCl at pH 8.5. A549 cells were used for real time validation of the method.
>
Protein digestion and desalting
Protein was reduced with 5 mM TCEP for 30 min at 37 ℃ and was alkylated by blocking the cysteine residues using 15 mM IAA at 25 ℃ for 1 h in dark. The pH was adjusted to 8 using 1 M Tris and the Urea concentration was reduced to below 2 M using 10 mM Tris. The reduced and alkylated proteins were digested using sequence graded trypsin at 1:50 ratio for protein: trypsin at 37 ℃ overnight. The activity of trypsin was stopped by adding formic acid (FA) and the pH was reduced to 2-3 before desalting. The digested peptides were desalted using sep-pak columns and the peptides were eluted with 80% acetonitrile (ACN) in 0.1% FA in water. For online digestion 100 μl of the reduced and alkylated protein solution was loaded to a proteolysis cartridge automated to handle trypsinization at a flow rate of 2 μl/min.The desalting step was carried out using reversed-phase (RP) catridge and the tryptic peptides were eluted with 80% ACN in 0.1% FA in water. Proteolysis cartridge is immobilized with trypsin using 5 μL resin of size 45-53 μm on synthetic polymer coupled with trypsin by epoxide to digest a minimum of 4 μg BSA per minute at a flow rate of 2 μl/min. On the other hand RP clean up cartridges are packed in 5 μl of underivatized polystyrene-divinylbenzene beads of pore size 100 A and particle size range of 15-20 μm capable of binding 450 μg human insulin at a flow rate of 2 μL/min. Purified peptides were collected in 96 Greiner 650201, U-bottom plates and were used for RP clean-up.Tryptic digestion and RP cleanup were automated using Assay Map bravo platform from Agilent technologies with VWorks Automation Control 11.1 software.
The digested peptides were dried using speedvac and suspended in 0.1% trifloroacetic acid (TFA) for LC-MS/ MS analysis. Peptides were separated using a nano pump connected to high pressure liquid chromatography system in the presence of HPLC chip (large capacity chip, 150 mm, 300 A, C18 chip, w/160 nl trap column). The peptides were loaded to the trapping column at a flow rate of 0.3 μl/min with HPLC grade water in 0.1% FA as mobile phase A and 90% ACN, 0.1% FA in HPLC grade water as Mobile phase B. The peptides were separated using 45 min gradient by mobile phase solvent A (0.1% FA in water) and mobile phase B solvent (90% ACN and 0.1% FA in water). Peptide separation was carried out using the gradient elution: 0-45, 3-45% B; 45.10-55, 45-90% B; and return to original conditions. The samples were run in triplicates with blank in between samples to clean the column. Mass spectrometry analysis was performed using 6520 Accurate-Mass Quadrupole Time-of-Flight (Q-TOF) LC-MS (Agilent Technologies, Wilmington, DE, USA) with HPLC-chip cube source.
The raw files generated by the Q-TOF were processed and analyzed using Sorcerer using the Uniprot human protein fasta database (2012, July version), including commonly observed contaminants.6
The IDEAL-Q software was utilized to process the LCMS/ MS data. The extracted ion chromatogram (XIC) was used to determine the peptide abundance in an LC-MS run.7
>
Linearity of peptide quantity from proteolysis
Successful analysis of proteome from biological samples needs some of the major factors like linearity, reproducible, efficient and specificity in digestion of the complex protein mixture. Since a small modification in peptide cleavage can naturally alter the peptide picture resulting in increased peptides complicating the arrangement of identified peptide during label free quantification.8 Hence refining the sample preparation to obtain reproducibly quantifiable peptides will be a great breakthrough in comparative proteomics. Our preliminary studies with different concentrations of BSA using proteolysis and RP cartridges showed reproducible results (data not shown). Hence we were interested in comparing the elution profile and the peptide picture of BSA using off-line method. The online system from Agilent technologies contains 9 desks combined with an automated robot to pick up catridges, aspirate and dispense liquids at controlled conditions. The major advantage of online method over off line is the time consumption for tryptic digestion; online method can be completed within 100 minutes (depending on the sample volume and flow rate) whereas the conventional offline method needs 16 h. Reducing the exposure time of trypsin for digestion can dramatically decrease the products of tryptic autolysis.9 Proteolytic digestion and RP clean up were carried out separately using automated protocol which consisted of priming and equilibrating cartridges, loading samples, washing unbound material, eluting the digested peptide with 80%ACN in 0.1% FA in water, followed by regeneration of the column and re-equilibrating using proteolysis and RP cartridges respectively. Tryptic digestion was carried out in a stepwise manner using the online system with cartridges embedded with trypsin (1) priming using 50 mM ammonium bicarbonayte buffer (ABC) [100 μL at flow rate of 300 μL/min], (2) equilibration using 50 mM ABC [50 μL at flow rate of 10 μL/min], (3) digestion of sample using tryptic cartridge [200 μL at flow rate of 2 μL/min], (4) regeneration using 1 mM HCl [50 μL at flow rate of 25 μL/ min]. On the other hand RP clean-up utilizes the following steps for desalting the tryptic peptides (1) priming using 80% ACN in 0.1% FA in water [100 μL at flow rate of 300 μL/ min], (2) equilibration using 0.1% FA [50 μL at flow rate of 25 μL/min], (3) load sample for desalting using RP cartridge [200 μl at flow rate of 2 μL/min], (4) cartridge cup washing using 0.1% FA [50 μL], (5) internal cartridge wash using 0.1% FA [50 μL at flow rate of 25 μL/min], (6) stringent syringe was using 80%ACN in 0.1% FA in water [50 μL], (7) elution of desalted peptides using 80%ACN in 0.1% FA in water [50 μL at flow rate of 5 μL/min], (8) re-equilibrium using 0.1% FA [50 μL at flow rate of 25 μL/min].
The presence of tryptic cleavage sites (Lys or Arg) at the Cterminus is often used to validate efficiency of trypsin-ization; conversely, a substantial amount of peptides with missed cleavage sites are commonly observed in samples. The completeness of trypsinization can be detected by the presence of either none or
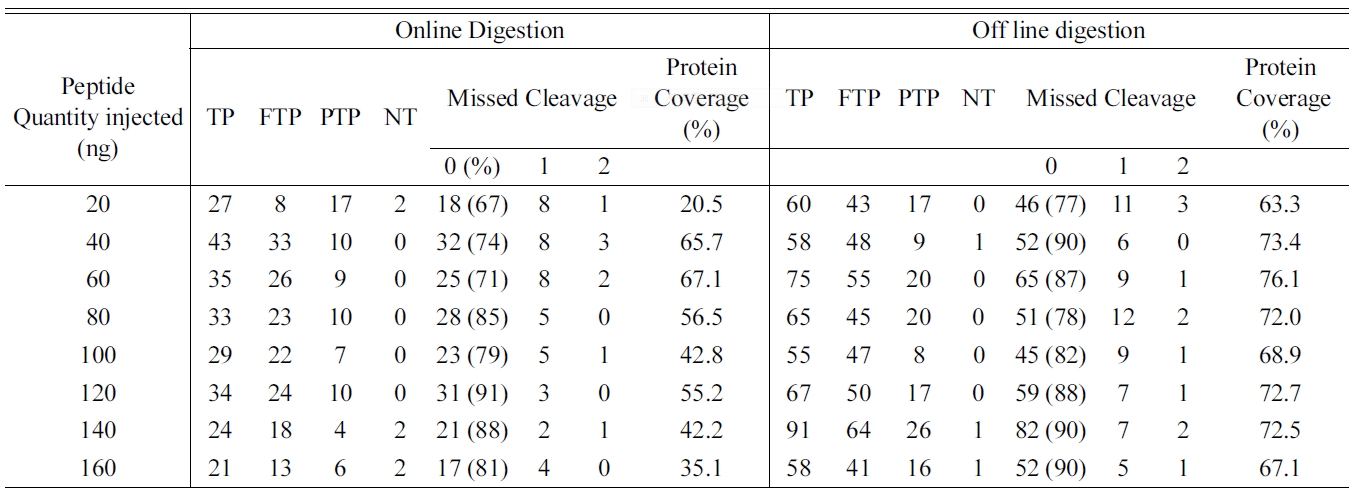
Total number of identified peptides and proteins in bovine serum albumin (BSA) digested using Online and off line digestion.
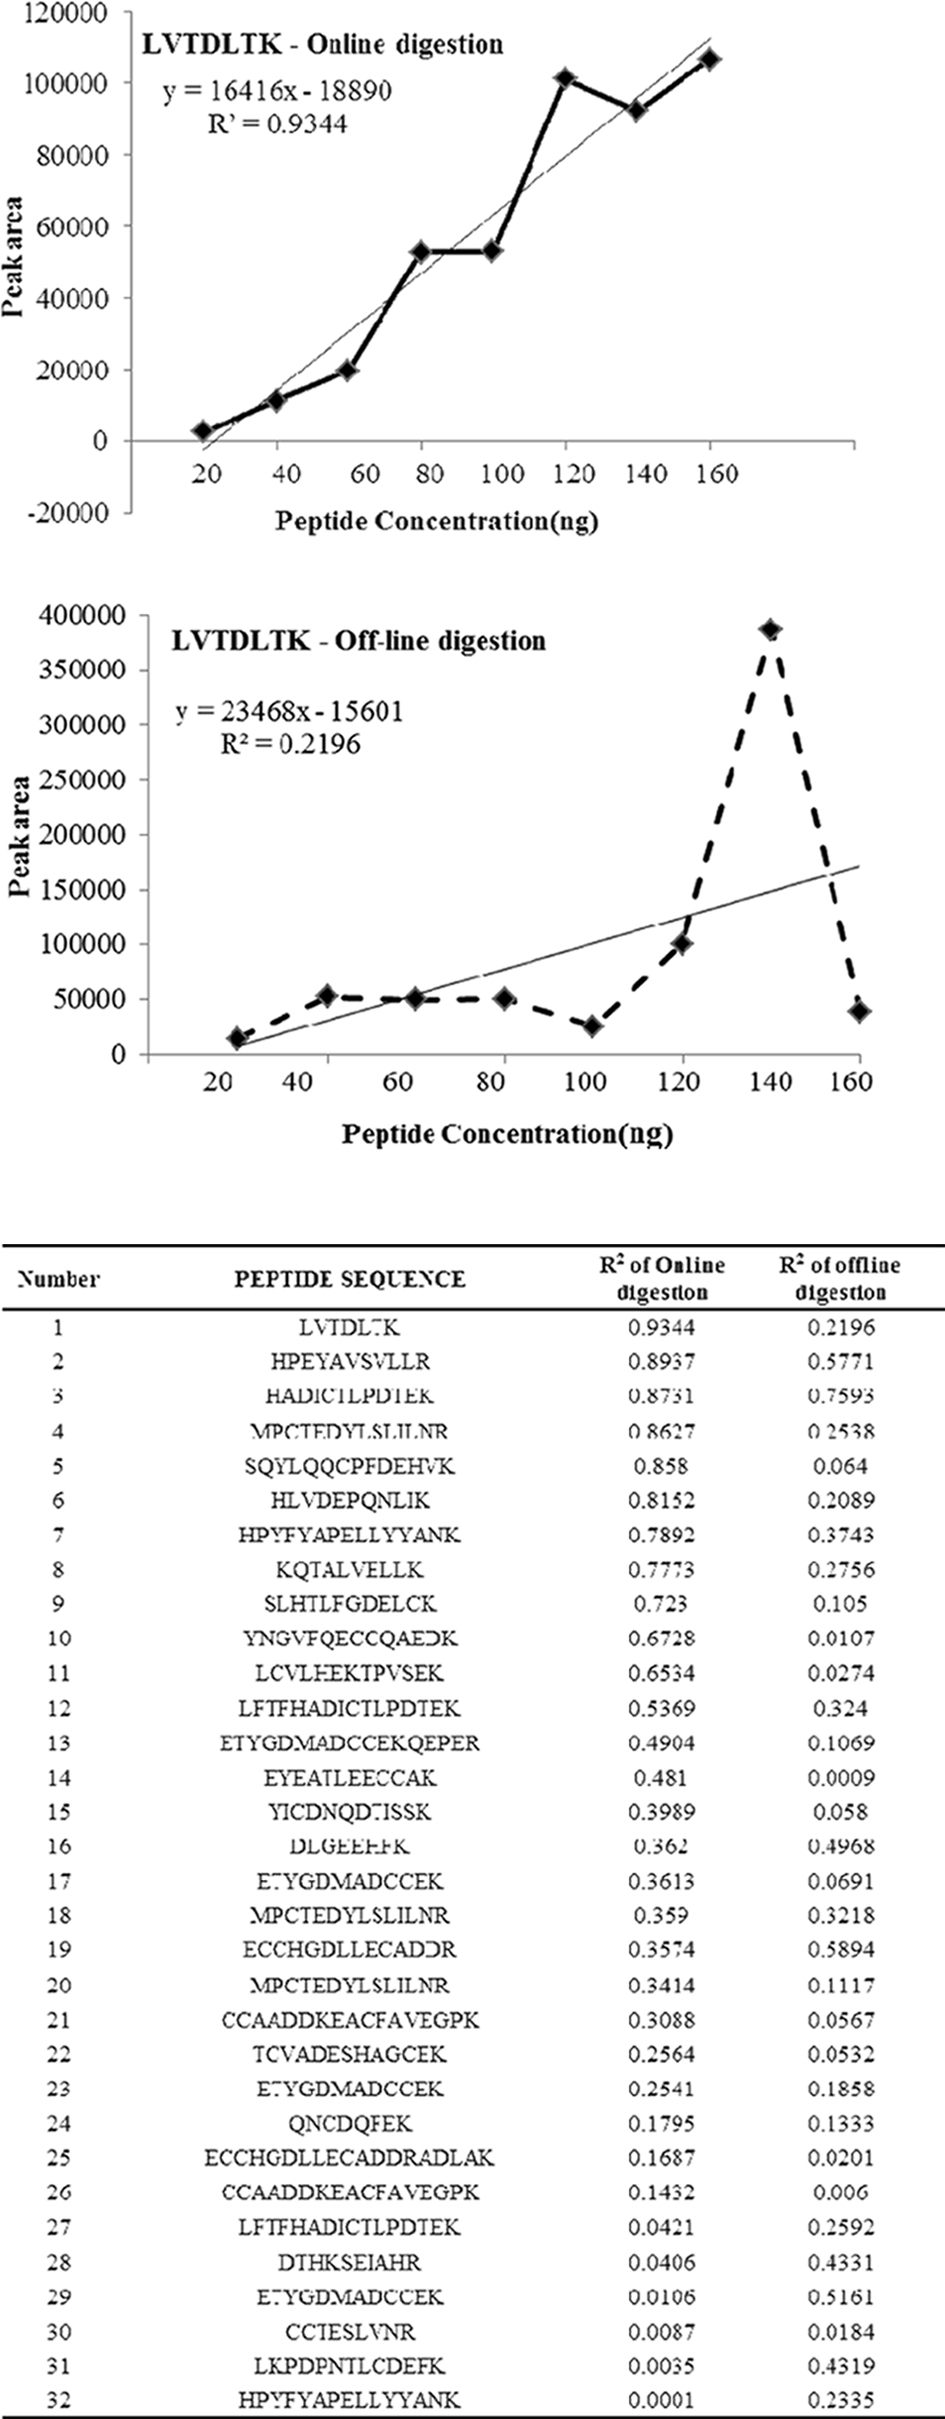
one lys residue in the observed peptides. Presence of two or more Lys residues within a peptide reflects incomplete digestion. Thus, the multiple patterns of the peptides produced provide a means to assess trypsin efficiency using any digestion conditions. The amino acid sequence coverage is also used as a measure for both the completeness of the protein digestion and the detection efficiency of the various tryptic peptides, and is common way in proteomics to define the digestion rate.10 To determine the linearity of the identified peptides and reproducibility eight different concentrations of BSA were used and the eluted peptides from online and off line methods were analyzed for MS/MS with increasing concentration to determine the peptide abundance versus sample ratio. Equal concentrations of peptides (20, 40, 60, 80, 100, 120, 140, and 160 μg) were loaded for LC-MS/MS analysis to compare the linearity and reproducibility of eluted peptides for online and off line methods. Table 1 shows the identified, tryptic, partially tryptic and non tryptic peptides with missed cleavage and the protein sequence coverage for BSA processed using online and offline method. The results of the present study shows that the offline method shows increased percentage of peptides with zero missed cleavage (fully tryptic) whereas online method shows decreased percentage of the same. Also the protein coverage was found to be very good in the offline method compared to online. Hence we wished to determine the ability of online system for linearity and reproducibility of the observed peptides. To determine the linearity of the methods regression coecient (R2) of identified peptides were taken as a measure. Figure 1 shows the R2 of similar peptides identified from online and off-line digestion. Proteolytic digestion and desalting using online method showed highest linearity (high R2 values) compared to the off-line method which showed lowest linearity.
Label free quantification uses two different criteria for measuring comparative expression of proteins in biological sample for analyzing biomarker candidate in disease and treatment. Hence given with more sophisticated analytical instrument the quality of the data remains on the perfection of
protein digestion. Peptide peak intensity or spectral count is measured for individual LC-MS/MS runs and changes in
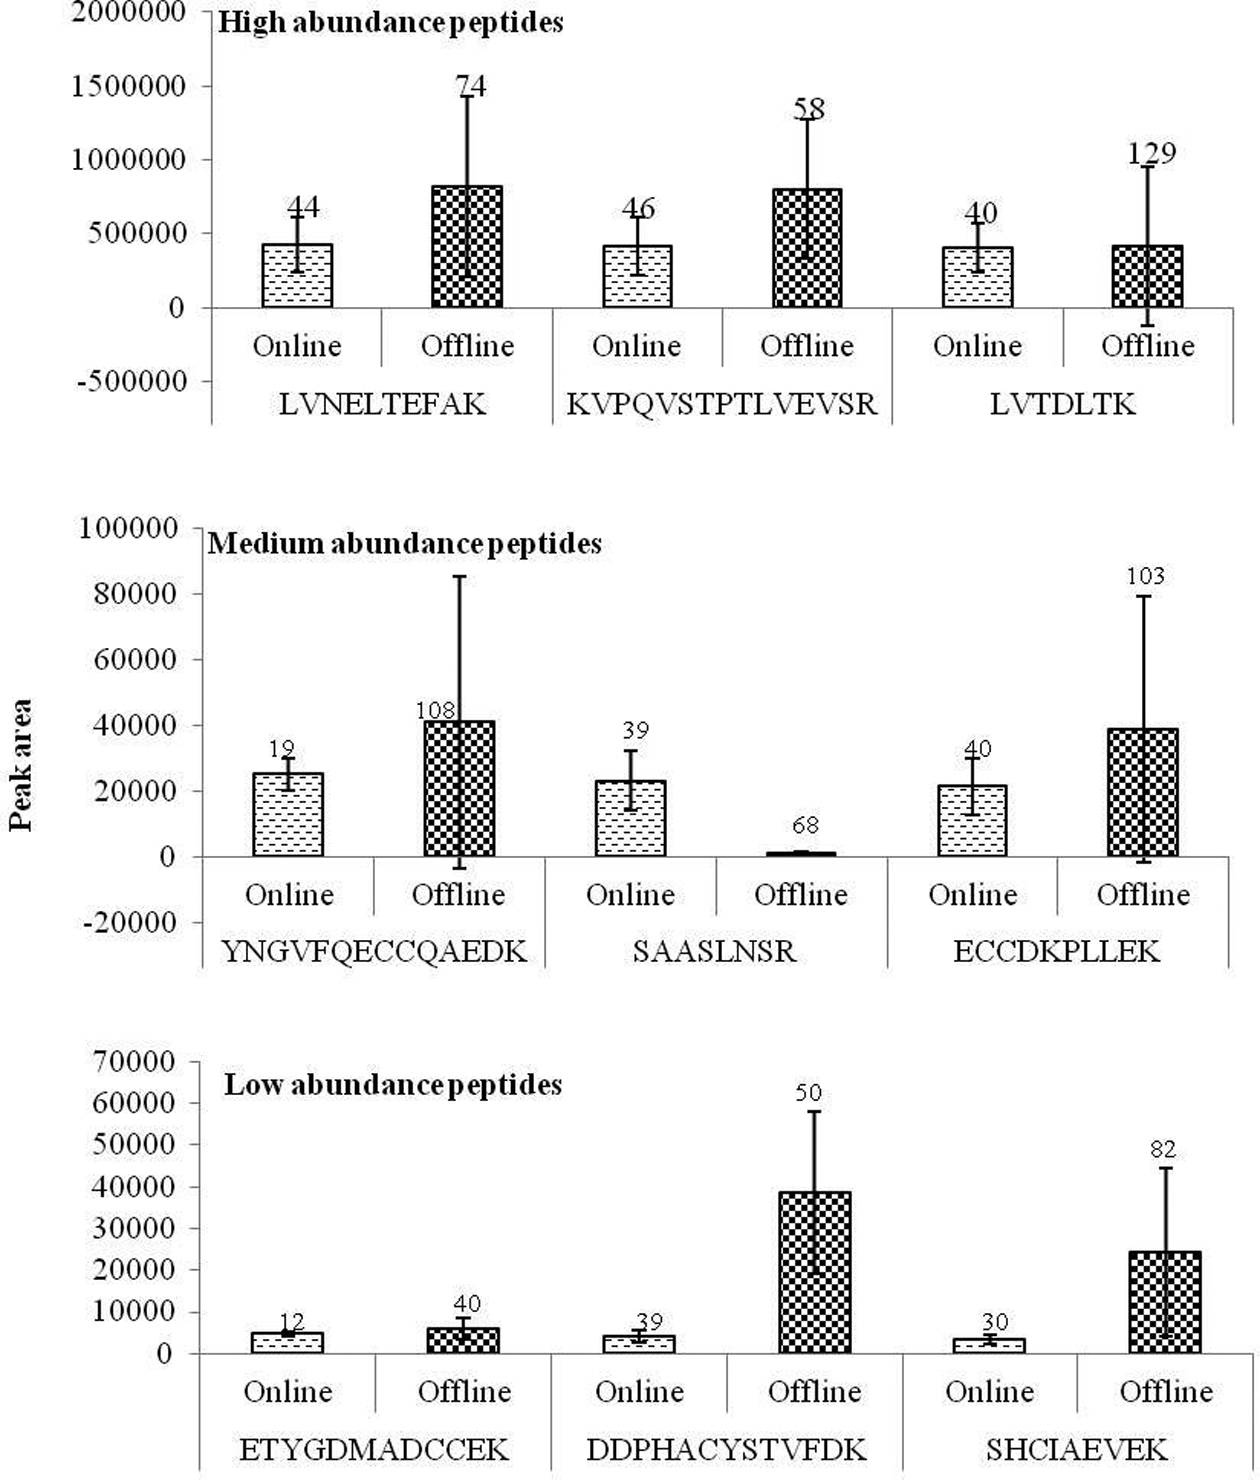
protein abundance are calculated via a direct comparison between different analyses .11 We observed a clear increase in peptide quantity with increase in initial sample concentration indicating peptide peak intensity is directly proportional to protein quantity in sample processed using online system. Figure 2 represents the average peak intensities of common high, medium and low abundance peptides with their standard deviation and error percentage. Albumin processed with online system shows consistence results with very small standard deviation and standard error percentage. Since label free quantification utilizes data from replicate run a greater difference in peak intensity between replicates will give an undesired result when in comparative proteomics. Albumin subjected to online proteolytic digestion and desalting resulted in quantitative peptides directly proportionate to the protein level in sample with a very little deviation between analyses.
The present method was validated using reduced and alkylated proteins from A549 cells using online method with the same experimental conditions. The reproducibility ability of online system was determined by comparing equal loading (8 replicates) of protein and peptides for sample preparation and mass spectrum analysis respec-tively. The elution profile of the replicates exhibits very similar features and we were able to identify 61±6 proteins per replicate and a whole of 187 proteins were identified using sorcerer data base search tool
[Table 2.] Distribution of peak area of identified peptides in real time sample (A549)
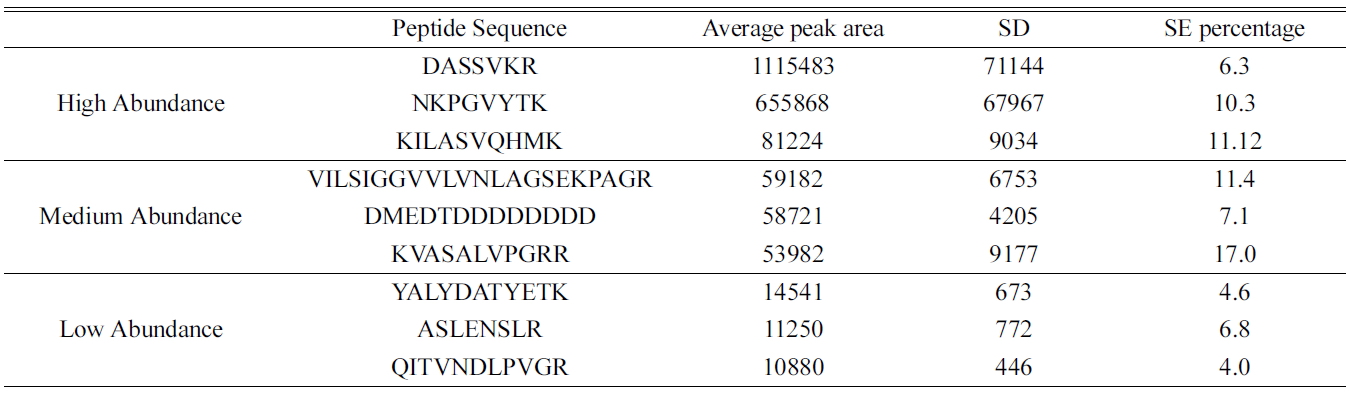
Distribution of peak area of identified peptides in real time sample (A549)
(data not shown). The reproducibility of the method was determined based on the standard deviations and standard error percentage of the average peak area intensity from eight replicate samples using ideal-Q. Table 2 shows the common high, medium and low abundance peptides in the samples. The standard error percentage is very low in peptides eluted from online method compared to the conventional in-solution method which can be beneficial in quantitative identification of protein. This online digestion is reproducible.
The result of the present study shows online digestion produces quantifiable peptides which will be a huge advantage for label free quantification. Identification of increased number of peptides and proteins which cannot be accurately quantified will not help in identifying potential biomarkers for disease conditions. Hence there is a need for more precise methodologies to refine the sample before taken forward to analytical instruments and software tools. The present online method will be a most reliable in terms of comparative proteomics based approach using high throughput data with less time.