Cellular processes such as proliferation, differentiation, and adaptation to environmental changes are regulated by protein phosphorylation. In order to enhance the understanding of molecular dynamics for biological process in detail, it is necessary to develop sensitive and comprehensive analytical methods for the determination of protein phosphorylation. Neural stem cells hold great promise for neural repair following an injury or disease. In this study, we made differentiated oligodendrocytes from human neural stem cells using over-expression of olig2 gene. We confirmed using quantitative phosphoproteome analysis approach that combines stable isotope labeling by amino acids in cell culture (SILAC) and TiO2 micro-column for phosphopeptide enrichment with MS2 and MS3 mass spectrometry. We detected 275 phosphopeptides which were modulated at least 2-fold between human neural stem cells and oligodendrocytes. Among them, 23 phosphoproteins were up-regulated in oligodendrocytes and 79 phosphoproteins were up-regulated in F3 cells.
Protein phosphorylation is a key regulator in cellular signaling pathways. Phosphorylation of serine (S), threonine (T), and tyrosine (Y) residues is one of the most abundant post-translational modifications of proteins. It is estimated to be present in more than 30% of the proteins at any given point and time in mammalian cells.1-4
Abnormally phosphorylated proteins have been associated with the pathology of a variety of disease states including cancer, diabetes, and Alzheimer’s. Many important cellular processes, such as signal transduction, cell division, metabolism, apoptosis, cell motility, and carcinogenesis, are controlled through reversible phosphorylation of proteins.56 Due to its transient nature, the level of phosphorylation of specific amino acid residues at a given time is often very low.78 Consequently, phosphoproteome analysis requires highly sensitive and specific methodology. Typically, a protein sample is enzymatically digested to yield a mixture of phosphorylated and non-phosphorylated peptides. This complex peptide mixture can be selectively enriched to concentrate phosphorylated species using a variety of techniques, including immobilized metal affinity chromatography (IMAC),9 titanium dioxide solid phase extraction,10-15 and affinity capture with antibodies against phosphorylated S, T, and Y residues.16
Mass spectrometry can be used to identify the number, location, and relative abundance of phosphorylated amino acid residues through peptide mapping experiments. For complex biological mixtures, it is difficult to detect phosphopeptides using mass spectrometry due to the general low natural occurrence of phosphopeptides and their poor ionization in the presence of non-phosphorylated peptides. Although several strategies have been devised for affinity enrichment of phosphorylated peptides, the coverage of the phosphoproteome of a given sample is limited.17 Since mass spectrometry (MS) offers some unique benefits, such as specificity, sensitivity, resolving power, and capability to deliver high-quality structural information over the last few years, mass spectrometry-based phosphoproteomics have been widely used in combination with specific enrichment methods.18
Stem cells hold great promise in regenerative owing to their unique properties of unlimited self-renewal and ability to differentiate into specific lineages when triggered by proper signals.19 Much work has been carried out to gain insight into intracellular signals governing embryonic stem cell (ESC) self-renewal and differentiation.2021 Recent, phosphoproteome analysis of undifferentiated and differentiated mESCs using phosphoprotein affinity purification followed by 2D LC-MS/MS indicate that many chromatinremodeling proteins are potentially regulated by phosphorylation. Interestingly, Affymetrix microarray analysis indicates that gene expression levels of these sample proteins have minimal variability between the compared samples.22
Neural stem cells give rise to neurons, astrocytes and oligodendrocytes, each of which plays an essential role in the functioning of the central nervous system. It has been demonstrated that PTMs can significantly influence adult stem cell fate decision.23 A quantitative phosphoproteomic approach facilitated by SILAC technology was used to investigate the influence of growth factor signaling on mesenchymal stem cell differentiation and was found to be mediated by tyrosine phosphorylation.24
The objective of this study is to identify specific biomarkers involved in oligodendrocyte differentiation from F3 neural stem cells. We investigated the efficiency of TiO2-based phosphopeptide enrichment of human neural stem cell (HB1.F3) cultures and evaluated the protein preparation protocols for the reproducibility of protein identifications. The consistent identification of phosphorproteins in cells from FB3 and oligodendrocytes indicate that our strategy for phosphoprotein identification yields highly reproducible results. An LC-ESI/LTQ-FT tandem mass spectrometer was used in data-dependent mode to automatically switch between MS, MS2, and neutral lossdependent MS3 acquisition. When the data searches are done by the combination of MS2 and MS3 data, better search scores of identified proteins are obtained. As a whole, this method works well and can be widely used as general procedures for the study of phosphoprotein identification.
>
Proliferation and differentiation of NSCs
Primary cell cultures were prepared from embryonic human brains of 15 weeks gestation. The immortalized cell lines of human NSCs were generated using a retroviral vector encoding v-myc oncogene. Immortalized human NSC cell line (HB1.F3), and olig2-overexpressed subclone of HB1.F3 (F3.Olig2) were used. F3.Olig2, the olig2- overexpressed subclone of HB1.F3, provided a model for characterizing downstream effects of olig2 transcription factor in NSC differentiation. HB1.F3 expressed markers specific for neural stem cells including ABCG2, nestin and vimentin. F3.Olig2 expressed marker specific for oligodendrocytelike cells including GalC. Nestin expression in HB1.F3 and GalC expression in F3.Olig2 were identified by confocal microscopy.
>
Cell culture and protein extraction
SILAC™ Membrane Protein ID and Quantitation Kit Lysine (D-MEM, Cat# SM10002) was purchased from Invitrogen (USA). Labeling Procedures were followed using manufacturer’s instructions. HB1.F3 and F3.Olig2 cells were grown for seven cell cycles in labeling media containing either light or heavy lysine. At 70% confluency, cells were washed twice with ice-cold PBS, and lysed with lysis buffer. Cell pellets were dissolved in lysis buffer containing 7 mol/L urea, 2 mol/L thiourea, 4% m/v CHAPS, 50 mmol/L DTT, 40 mmol/LTris-Base, 0.2% Biolyte (pH 3-10), 10% isopropanol, 12.5% water-saturated isobutanol, and 1% phosphotase inhibitor cocktail for 1 hour at room temperature, followed by centrifugation (35,000 × g, 1 hour) at 4 ℃. Protein concentration was measured using BCA protein assay kit (Pierce).
>
Protein separation and digestion
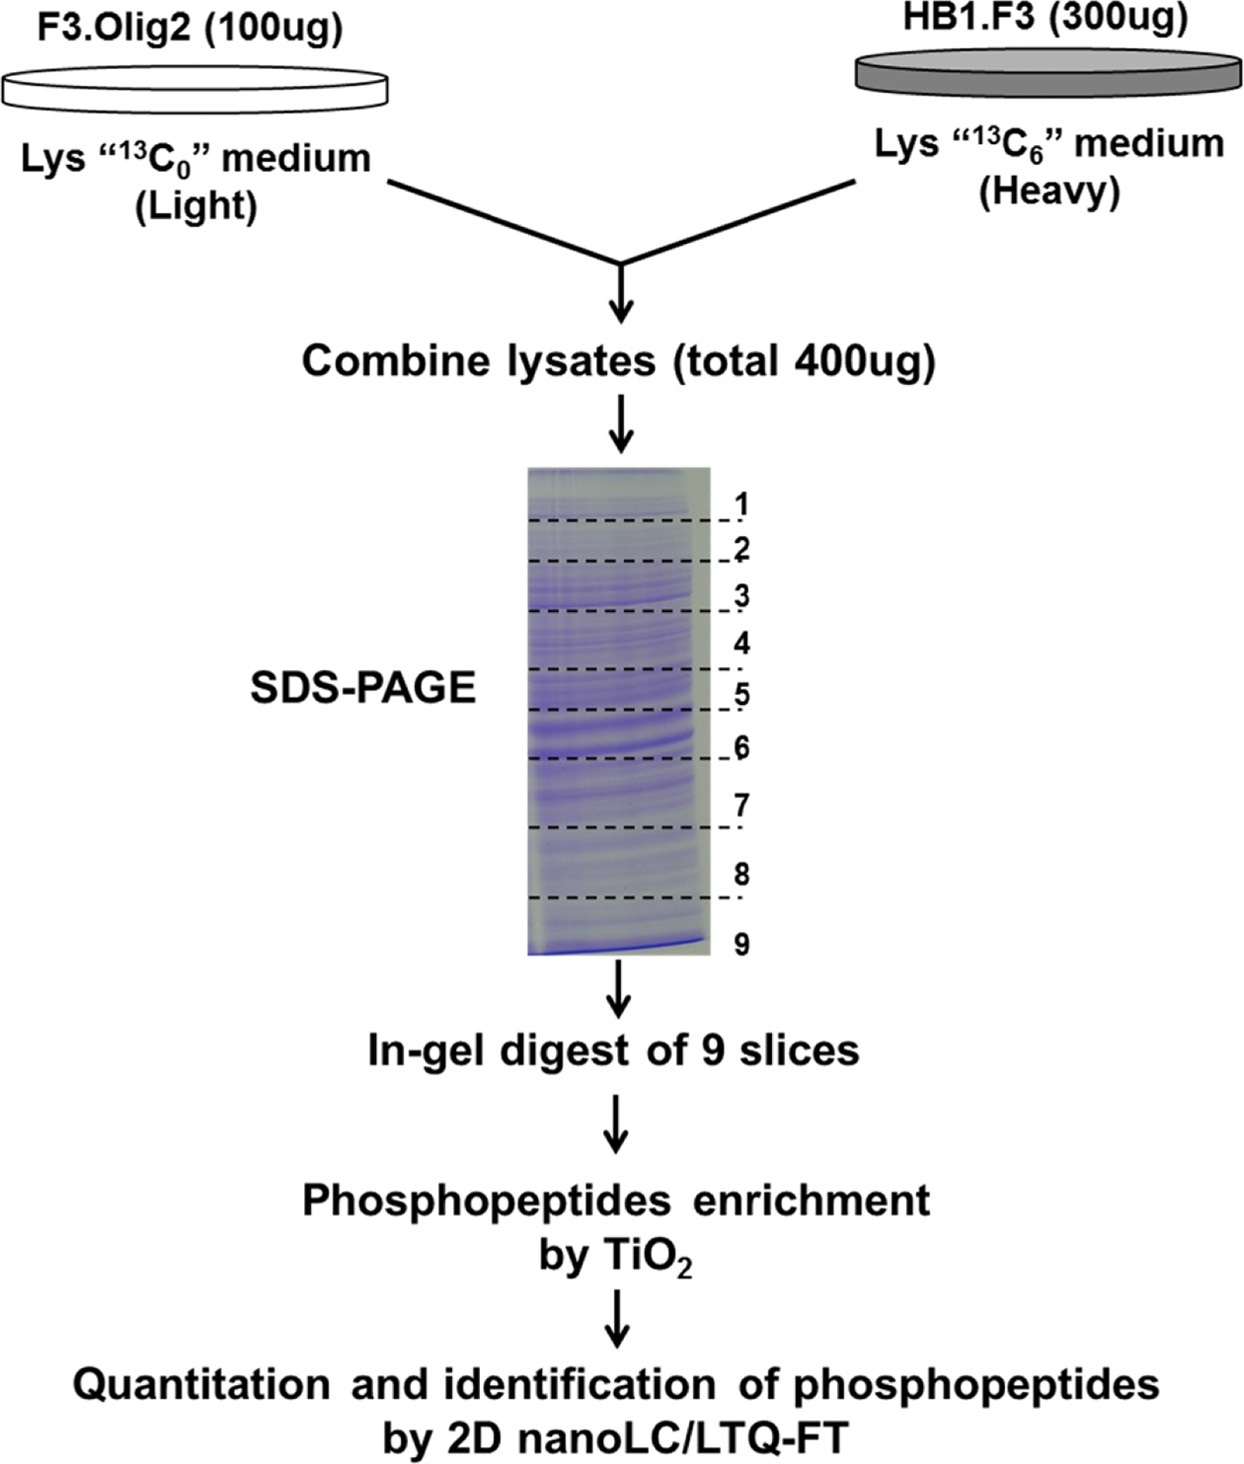
Proteins (400 μg) from Heavy-lysine-labeled HB1.F3 (300 μg) and light-lysine-labeled F3.Olig2 lysate (100 μg) were combined and separated on a 10 % SDS-PAGE gel. The gel was processed for coomassie staining. A single gel lane was excised and was divided into 9 sections. Each section was cut into small pieces and was washed in acetonitrile (ACN 50%) containing NH4HCO3 (10 mM) trice. After complete destaining, the gels were dried in a vacuum concentrator, reduced with the addition of DTT (10 mM) in NH4HCO3 (100 mM) and incubated at 56 ℃ for 1 hour, followed by carboxymethylation with IAA (55 mM), at RT in the dark for 40 min and subsequent washing with distilled H2O twice. After completely dried, reduced and carboxymethylated gels were then digested with trypsin (modified sequencing grade, promega, Madison, USA) at a ratio of 1:50 in NH4HCO3 (50 mM) overnight at 37 ℃. The following day, gel pieces were acidified and incubated with formic acid (90 %) for 4 hours at 37 ℃ to facilitate the hydrolysis of detergents. Supernatants were transferred to fresh tubes and the remaining peptides were extracted by incubating the gel pieces in acetonitrile (ACN, 50%) with trifluoroacetic acid (TFA, 5%), followed by dehydration with ACN. The extracts were combined and organic solvent was removed in a vacuum concentrator and reconstituted in loading buffer (100 μL, 80% ACN and 0.1% TFA) for TiO2 enrichment.
>
Enrichment of phosphopeptides
After lyophilization, proteins extracted from the gel pieces were enriched for phosphopeptides using TiO2 micro-column. Purification of phosphopeptides from the peptide mixture was performed essentially as described by Larsen et al.25 A TiO2 micro-column was prepared by stamping out a small plug of C8 material from a 3 M EmporeTM C8 extraction disk (3 M Bioanalytical Technologies) and placing the plug in the constricted end of a P10 tip. The TiO2 beads (suspended in ACN) were packed in the P10 tip and were prevented from leaking by C8 material, The TiO2 micro-column was packed by the application of air pressure. Buffers used for loading or washing the micro-column contained ACN (80%) to prevent non-specific binding to the C8 membrane and the TiO2 beads. The lyophilized sample was loaded onto the TiO2 micro-column of ~10 mm. The micro-column was washed with loading buffer (500 μL) followed by washing buffer (500 μL, 1M glycolic acid in 80% ACN/1% TFA). The phosphopeptides were eluted with aqueous ammonia (500 μL, 25% ammonia solution, pH 11).
Nanoscale liquid chromatography tandem mass spectrometry (nano-LC-MS/MS/MS) experiments were performed on a Surveyor nano-flow system connected to a 7-tesla Finnigan LTQ-FT mass spectrometer (Thermo Electron, Bremen, Germany) equipped with a nano-electrospray ion source. Digested proteins were analyzed with a modified 7- steps MudPIT-type separation. Lyophilized peptide samples were dissolved in a mobile phase A (100% water, 0.5% acetic acid, 0.02% formic acid). An autosampler was used to load 10 μL aliquots of the digested protein solution onto a WAX/SCX (2:1)-column of i.d. 250 μm, length 30 mm, and particle size 5 μm (PolyLC inc. Columbia, MD) which was prepared by slurry packing using an in-house pressure vessel driven by He gas.26 The peptides were concentrated and separated on the WAX/SCX (2:1)-column at a flow rate of 10 μL/min. Then, the trapped peptides were backflushed and separated on a 100 mm homemade microcapillary column composed of C18 (Aqua; particle size 5 μm) packed into 75 μm silica tubing with an orifice i.d. of 6 μm (Proxeon Biosystem, Odense, Denmark). The mobile phases, A and B, were composed of 0 and 80% acetonitrile, respectively, each containing formic acid (0.02%) and acetic acid (0.5%). The gradient began with 5% B for 15 min, ramped to 20% B over 3 min, to 95% over 60 min, remained at 95% B over 12 min and to 5% B for another 2 min. The column was equilibrated with 5% B for 8 min before the next run. For 2-7 steps, 10 iL of salts (25, 50, 125, 250, 500, and 500 mM as ammonium acetate concentrations, respectively) were injected on an autosampler by gradient same as step 1.
The mass spectrometer was operated in data dependent mode to automatically switch between MS, MS2, and neutral loss-dependent MS3 acquisition. Survey full scan MS spectra (from m/z 400 to 2,000) were acquired in the FT-ICR with resolution R = 25,000 at m/z 400 (after accumulation to a target value of 1,000,000 in the linear ion trap). The three most intense ions were sequentially isolated for accurate mass measurements by a FT-ICR selected ion monitoring (SIM) scan which consisted of 10-Da mass range, r = 50,000 and target accumulation value of 50,000. These were then simultaneously fragmented in the linear ion trap using collision-induced dissociation at a target value of 200,000.
The data-dependent neutral loss algorithm in the Xcalibur software was applied to all MS2 spectra. As the strategy of MS3 scan, we chose the data-dependent method to trigger the MS3 scan when a neutral loss of 98.00, 48.99 and 32.66 Da was detected among the tree most intense fragment ions. Former target ions selected for MS2 were dynamically excluded for 60 seconds. The general mass spectrometric conditions were: spray voltage, 2.0 kV; normalized collision energy using wide-band activation mode; 35% for MS2 and MS3. Ion selection thresholds were 1000 counts for MS2 and MS3. An activation q = 0.25 and activation time of 30 ms was applied in MS2 and MS3 acquisitions.
>
Protein identification and quantification
The MS2 spectra files from each LC run were converted to mzXML files using the freeware ReAdW.exe program (Institute for Systems Biology) and MS3 files were extracted for the neutral loss peaks which apparently were generated from phosphopeptides and merged to a single mzXML file. Protein identification was performed from all the MS2 and MS3 mzXML files by using the Mascot (version 2.2.04, Matrix Science) search program. The database search against target (forward orientation) and decoy (reversed orientation) human IPI protein database (IPI version 3.71) made the analysis of the false positive rate possible. The 6.0201 Da modifications on lysine residue were assigned for the heavy isotope label. We added a static modification on cysteine residue from the alkylation by iodoacetamide and a dynamic modification of methionine oxidation.
We analyzed quantitative data with the strategy in which we identified reliable proteins under the rigorous condition and by integrating three results of repeated experiments we minimized the loss of true assignments with less false positives. Because the quantitative analysis in proteomics contains some errors at both of identification and quantitation, the establishment of the rigorous criterion in peptide identification is prerequisite for reaching to the reasonable result. We decided the threshold score of peptide ion score to achieve the false positive rate less than 1% from the composite target/decoy database.
In order to analyze relative protein abundances of neural stem cell and oligodendrocyte precursor, we used XPRESS of Bioworks software. The XPRESS parameters were assigned to identify the peptide ion pairs whose mass difference is 6.0201 Da within mass tolerance of 0.02 Da and lysine residues were labeled metabolically by carbon isotope. The quantified result was validated manually by checking its corresponding XIC (selected ion chromatogram) area. In addition, we executed the normalization of peptide peaks by quantile-normalization. We classified the decreased, increased and similar proteins according to the normalized ratio by the double-fold change.
>
SILAC labeling of neural stem cells and Oligodendrocyte
The MS based screening studies phosphopeptide levels were performed for the comparison of the proteomes of SILAC-labeled HB1.F3 and F3.Olig2 quantitatively. Our strategy for quantitative phosphopeptide analysis was the combination of SILAC titanium dioxide (TiO2) chromatography for phosphopeptide enrichment25 with anion and cation mixed-bed ion exchange chromatography (WAXSCX), using high accuracy multistage MS (Figure 1).
The experiments were done trice for obtaining the confidence in the quantitative analysis for the protein analysis. Stable Isotope Labeling with Amino acids in Cell culture (SILAC) is a broadly used approach in quantitative proteomics.2728 A major drawback of this technique is the metabolic conversion of labeled amino acids that may hinder accurate quantification. A typical illustration of this phenomenon is the so-called arginine conversion problem, where degradation of this amino acid via the arginase pathway leads to the generation of labeled proline, biasing the quantitative ratios of proline containing peptides.
Several strategies have been proposed to either prevent arginine conversion or to correct its detrimental effects. Many researchers report that increasing proline concentration in the growing medium successfully avoids arginine conversion in human embryonic stem cells,29 although it has been suggested that such increase may lead to back conversion of proline into unlabeled arginine.27 For this reason, F3.Olig2 cells were grown in normal medium containing light lysine, whereas HB1.F3 neural stem cells were grown in medium containing heavy lysine. Masses of each peptides increased by 6 Da in their isotope-labeled forms corresponding to the incorporation of one [13C6] lysine (Figure 1).
>
Total protein content per cell and Western blot analysis
The result of determining total protein content per cell is summarized in Figure 2. Correlation analysis was done to provide both confidence in measurements and the degree of experimental errors. Figure 2(c) shows that the differentiation of neural stem cells (HB1.F3) into oligodendrocytes (F3.Olig2) involves 2.67-fold reduction in total protein content per cell.
Since the size of differentiated cell (oligodendrocytes) is 3-fold smaller than non-differentiated cell (F3 neural stem
cell), we thought it is reasonable to carry out experiments in the same condition i.e based on the same weight of cells Therefore, we used 3-fold amount of F3 cells for the experiments and western blot. We used four different ratios of F3 and Oligo2 (0.3:1, 1:1, 2:1, and 3:1). Housekeeping protein of beta tubulin (55 kDa) was used as a loading control to confirm the ratio. The results are represented in Figure 2 (a) and (b). Western blot analysis shows similar patterns for all the ratios except for 0.3:1 ratio of F3 and Oligo2 (Figure 2(a)). This is indicative that differentiated cell has significantly smaller quantity of protein than nondifferentiated cell. However, when the ratio of F3 and oligodendrocyte was 3:1, the amount of protein from each cell was almost equal (Figure 2(b)). Although F3 was used 3 times more, percentage of weight percent did not dramatically increase, just (121%). Moreover, heavy chain from F3 and light chain from Oligo2 were found by using mass spectrometry and the ratio of intensity was 0.87. Therefore, there is good agreement between two techniques. This shows that 3:1 ratio of F3 and Oligo2 is a reasonable choice to compare the tendency.
>
Enrichment of phosphopeptides by TiO2
Titanium dioxide (TiO2) has been explored and widely applied to the enrichment of phosphopeptides. It has been demonstrated to possess high affinity with high specificity to phosphopeptides in simple peptide mixtures.11 However, we found that significant nonspecific bindings were observed when proteome samples were applied to TiO2 columns. Many researchers have observed the same phenomenon. Larsen et al.30 used a buffer containing 2, 5-dihydroxybenzoic acid (DHB) to load samples as well as for subsequent washes of the TiO2 column to minimize these nonspecific bindings and to enhance the selectivity for phosphopeptides. To date, however, only a few applications using TiO2 to enrich phosphopeptides from complex mixtures have been reported.31 Our study showed that a column wash after sample loading using a buffer containing glutamic acid dramatically reduced nonphosphopeptide binding to TiO2. We verified a method for purification of phosphorylated peptides using TiO2 in combination with peptide loading in high organic solvent including strong acid and 5% trifluoroacetic acid (TFA) or glycolic acid to exclude nonphosphorylated peptides from binding to the chromatographic material.
>
Phosphopeptides separation of 2D-LC system by WAXSCX chromatography
A common feature of all large-scale studies is the requirement for phosphopeptide enrichment due to the general low presence of phosphorylated species. In fact, most studies to state phosphopeptides identification have two features in common: protein (or peptide) fractionation and phosphopeptide enrichment. Commonly used fractionation techniques include SDS-PAGE separation and strongcation exchange (SCX) chromatography.32 It has been shown that strong cation exchange (SCX) chromatography provides an additional, robust enrichment tool for phosphopeptides. SCX is often used as a primary separation strategy for complex peptide mixtures before analysis by reversephase liquid chromatography (LC)-MS/MS, in which peptides elute according to their solution state charge. The most common implementation utilizes an on-line system in which complex mixtures are adsorbed to a bi-phasic column packed with SCX and reverse-phase resins. Several salt solution cause release discrete peptide that make to fractionation successful on the reverse phase column. This is because that SCX chromatography has poor retention about most tryptic phosphopeptides, that is not suitable for enrich phosphopeptides procedure. Gygi et al was reported as the phosphopeptide identification result by using SCX based strategy, they found over 2000 phosphorylated sites from HeLa cell which were determined by tandem MS. In this study, to evaluate the recovery of phosphopeptides, both WAX and SCX ion-exchange resins were challenged with the TiO2 enrichment of phosphopeptides. The mixedbed ion exchange resin improved peptide recovery over SCX resins alone and showed better orthogonality to RP separations in two-dimensional separations. In other words, the ACE mixed-bed format would perform best when combined with pH fraction-based phosphopeptide enrichment methods because it provides better separation for abundant acidic phosphopeptides. The application of the method to phosphopeptide-enriched samples increased by SCX alone.
>
Phosphoprotein identification by LTQ-FT MS2 & MS3
High reproducibility and accurate quantitation of phosphorylation sites is always expected in quantitative phosphoproteomics. Quantitation variances can be ascribed to analytical variability associated with the procedure for the analysis of a sample and biological variability associated with individual cells, tissues, or organisms. Generally, the analytical variance in quantitative proteomics is approximately 20-30%,33-35 but more accurate quantitation with less variability would be expected when high performance mass spectrometers are used.
In order to reduce sample complexity and dynamic range in protein abundance levels, we separated proteins on 1DSDS- PAGE and 9 bands were excised and subjected to ingel tryptic digestion. In total, 27 fractions were analyzed by liquid chromatography (LC) on-line coupled to a hybrid mass spectrometer consisting of a linear ion trap coupled to a high resolution Ion Cyclotron Resonance (LTQ-FTICR) instrument. The mass spectrometer was programmed to perform survey scans of the whole peptide mass range, select the three most abundant peptide signals and perform narrow range selected ion monitoring (SIM) scans for high mass accuracy measurements. Simultaneously, with the SIM scans the linear ion trap fragmented the peptide, obtained an MS/MS spectrum and further isolated and fragmented the most abundant peak in the MS/MS mass spectrum to yield the MS3 spectrum. A selected peptide was measured in SIM mode and fragmented (MS2). The most intense fragment in the MS2 spectrum was selected for the second round of fragmentation.36 We detected 275 phosphopeptides that were modulated at least 2-fold between human neural stem cells and oligodenrocytes. Among them, 23 phosphoproteins were up-regulated in oligodendrocytes as well as 79 up-regulated in F3 cells (Supplemental Table).
>
Correlation of differentiated of neural stem cell and phosphorylated peptides
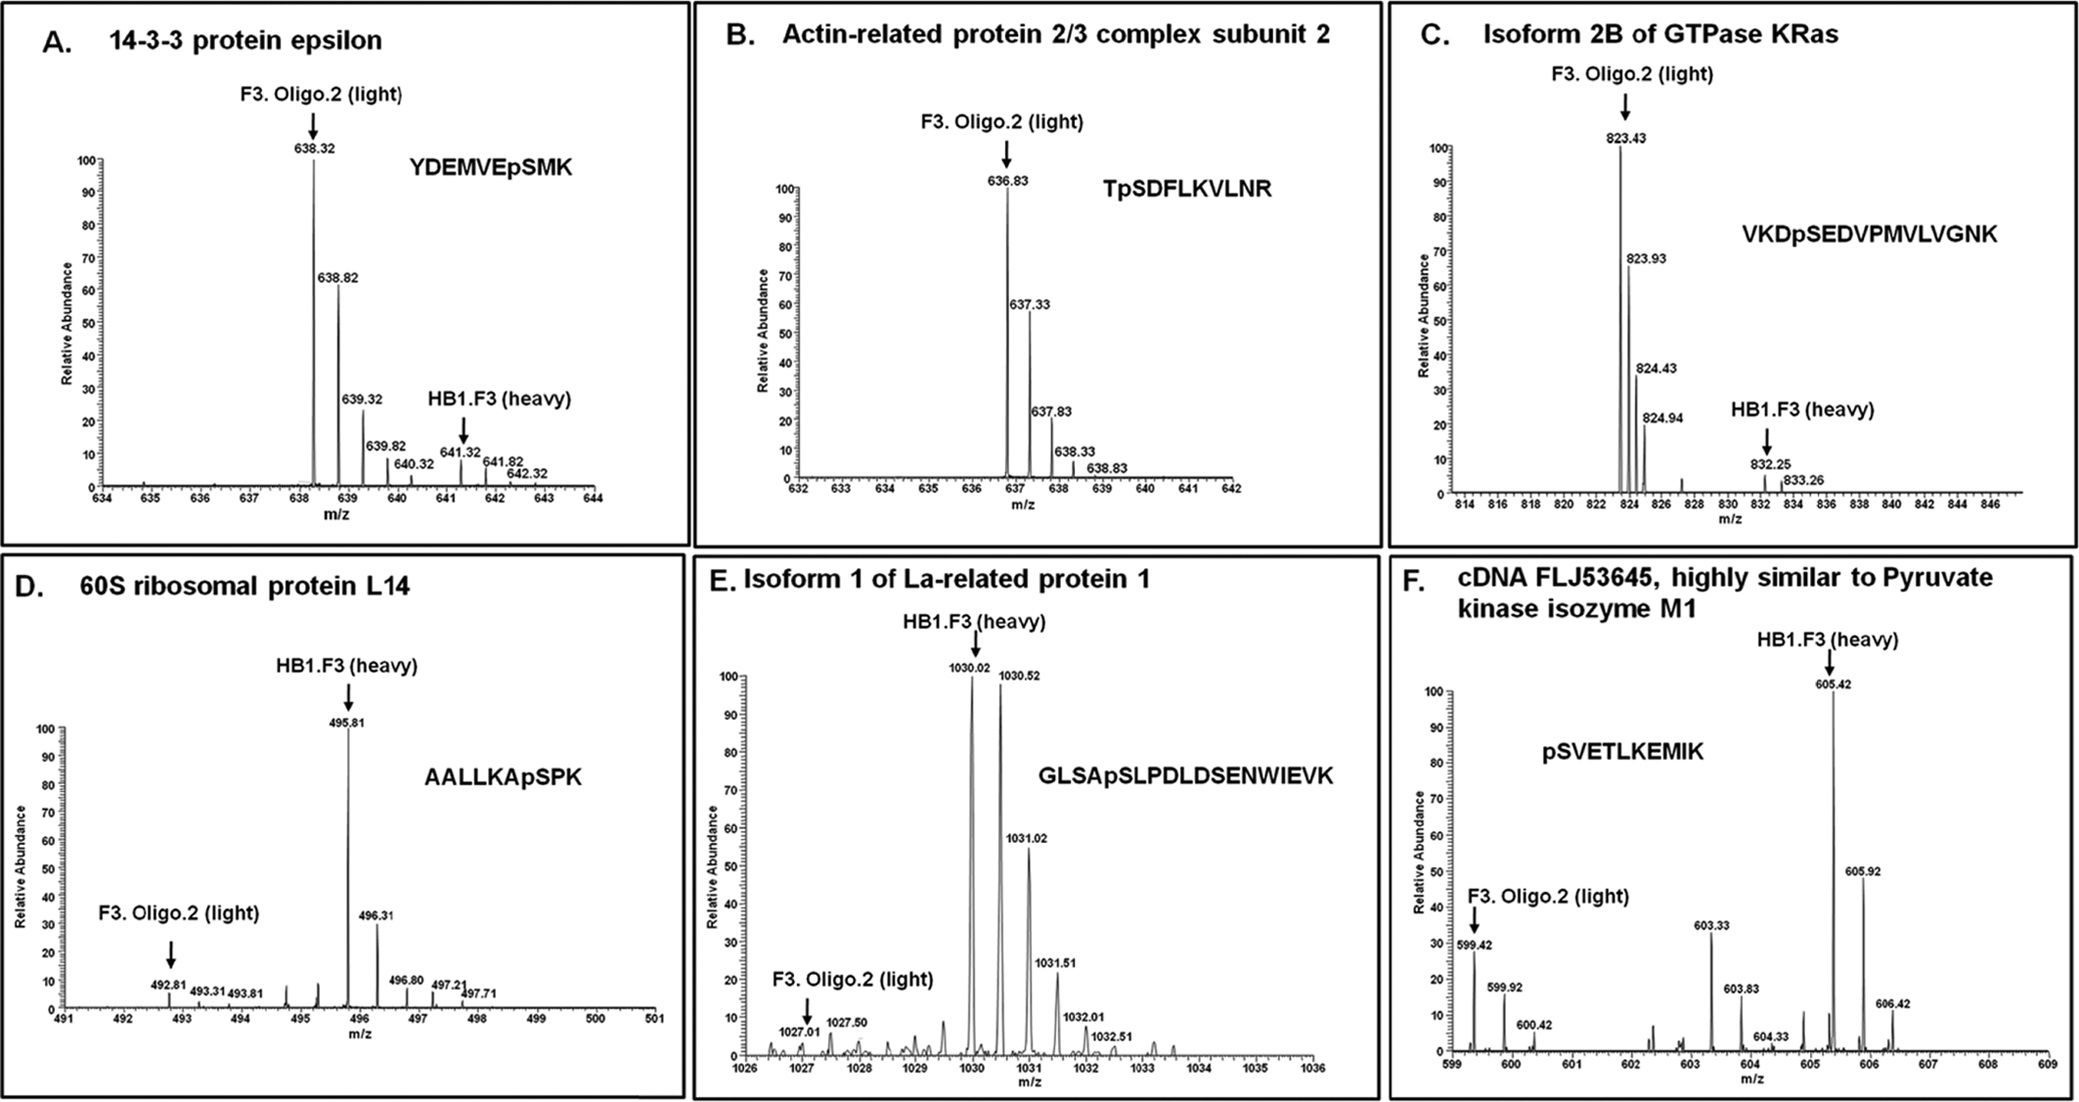
Some of MS spectrums are presented in Figure 3, and showes identified phosphopeptides related to F3 and oligodendrocyte. Figure 3 indicates that phosphorylated peptides have the tendency to differentiate well than non phosphorylated peptides. Although few studies have been done to evaluate the biological variability of protein phosphorylation at the phosphoproteome level, this kind of information still is important. Understanding the biological variability in the quantitation of protein/peptide phosphorylation would facilitate the elucidation of protein functions in signaling pathways as an effect of the degree of phosphorylation.3738 It would be helpful to mine meaningful biological information by setting standards for addressing the issues related to the reproducibility and interpretation of quantitative phosphoproteomic data.
>
Phosphoproteins in neural stem cells and oligodendrocyte
Cell adhesion plays a pivotal role in differentiation, in cell shape, survival, and motility, and in malignant transformation through dynamic interactions between the extracellular matrix, various transmembrane adhesion receptors, and the actin cytoskeleton.
We have identified thirteen phosphorylated proteins in undifferentiated neural stem cell such as YWAHE, ARPC2 whereas other phosphorylated proteins indentified were MAPB1, ACTN1 in differentiated oligodendrocyte. These data indicate that growth of the signals and morphological changes might be controlled by phosphorylation of YWAHE, ARPC2, MAPB1 and ACTN1.The biological importance of 14-3-3 has been elucidated by many researchers.39 Multiple isoforms of 14-3-3 proteins have been shown to play an essential role in regulating cell differentiation, proliferation and transformation, and also to interact with a wide variety of proteins related to signal transduction, cell cycle control, vesicular transport, DNA replication and apoptosis.40 14-3-3 proteins are known to control cell cycle progression by binding in a phosphorylation- dependent manner to key cell cycle regulators modulating their activity.4142 Phosphorylation of BAD a member of the BH3-only subfamily of the Bcl-2 apoptosisregulating proteins and 14-3-3 binding serves as a potent inhibitory mechanism to prevent Bad-induced apoptosis. 14-3-3 can act in a similar fashion to block cell death caused by other death promoters, such as apoptosis signalregulating kinase 1 (ASK1).43 By exerting control over multiple proapoptotic proteins, 14-3-3 may function as a general promoter of cell survival.44 There are seven distinct 14-3-3 isoforms (β, ε, ζ, η, θ, γ and σ), which are encoded by separate genes in mammals.45 Among these, 14-3-3 epsilon is an intracellular signaling molecule belonging to the 14-3-3 protein family, which is known to be involved with neuronal migrations.46 It is also reported that 14-3-3 epsilon controls actin polymerization in neurons by regulating MK5 (MAPK-activated protein kinase 5).47
A key regulator of actin polymerization is the Arp2/3 complex. The Arp2/3 complex is the core machinery that nucleates actin for the generation of the filamentous actin network. Arp2 and Arp3 structurally resemble actin and are hypothesized to mimic an actin dimer, forming a seed that catalyzes filament growth.48 Actin-related proteins such as ARPC2 play an important role in bFGF-induced morphological changes and maintenance of differentiation potency in mesenchymal stem cells.49 Microtubule-associated protein 1b (MAP1b) is suggested to play an important cytoskeletal role in development and function of the nervous system.50 MAP1B expression is markedly up-regulated during neurite outgrowth in various types of neurons.51 MAP1B and TuJ-1, two markers for early neurons, are expressed at about the same levels before and after neural cell differentiation of hMSCs in vitro52 α-Actinin is found to be essential for integrin-cytoskeletal linkage and focal adhesion formation in Swiss 3T3 cells.53 α-Actinin is a focal adhesion kinase (FAK) substrate; FAK-dependent phosphorylation of tyrosine- 12 (Y12) on α-actinin reduces its binding affinity for actin filaments, which may serve to regulate focal adhesion maturation and turnover.5455
Embryonic stem cell-derived neural cells and adult neural stem cells are promising sources for cellular and gene therapies in central nervous system disorders. To investigate key molecular mechanism involved in human neural stem cell differentiation to oligodendrocyte, we have used immortalized neural stem cell line (HB1.F3) and Olig2- induced NSC differentiation model (F3.Olig2). We employed SILAC method using nano-LC FT-ICR/MS for quantitative analysis of the phosphoprotein profile changes to create differentiation related biomarker profiles for HB1.F3 and F3.Olig2. We have developed and applied a strategy that includes SILAC for monitoring activation profiles with WAX-SCX and TiO2 chromatography for phosphopeptide enrichment for high-accuracy mass spectrometric characterization.5657 Additionally, there is good agreement between results from the western blot analysis and the mass spectrometry analysis. In conclusion, the developed strategy in our studies is efficient to utilize phosphoproteomics analysis and can be successfully applied for detailed understanding of molecular dynamics of complex biological process.