It is essential for a country or business organization to develop and/or acquire new technology for economic success. However, in many cases it is hard to make a decision on whether or not it is economically feasible to invest in the development of the required technology. Or, it is complicated to evaluate the feasibility of a technology-based new business project.
Although many techniques have been developed and established to analyze business feasibility, the discounted cash flow method (DCF) is the most commonly used in practice because this method gives realistic values by calculating the income-producing potential of new business at the present time. However, the process to evaluate the feasibility, in particular a technology-based business, is very complex even under the best of conditions because it includes three major inputs: a) the duration of the income stream (i.e., the economic lifetime), b) the amount of income to be generated and the pattern of future income generation (i.e., the potential cash flow), and c) the risk linked with the realization of the expected income (Sampath Kumar et al., 2004). This future potential cash flow over the lifetime of the technology implies that the valuation method requires many estimates and assumptions. Therefore, it is critical to obtain realistic input with respect to technology per se and external and internal factors (Van Triest and Vis, 2006).
In this study, we will focus on the duration of the income stream and consider the pattern of future income generation in the context of feasibility analysis of the technology-based business. Estimating the duration and analyzing the lifetime pattern of the product adopting the subject technology becomes fundamental in estimating cash flows. Many studies have focused on estimating the duration of the income stream, known as the economic lifetime, through analyzing patent information. However, the output of patent-based analysis does not reflect the economic lifetime and the life cycle pattern when it comes to the subject of technology. Furthermore, there are no guidelines as to how to use other information from analyzing the technology, the market, and the firm to estimate cash flows. Thus we present an approach to estimating the economic lifetime and the pattern by providing the adjustment factors.
In chapter 2 of this paper, we review the literature on the quantitative methods of estimating the economically useful lifetimes of a technology and identify issues with these methods. Then, we suggest the product life cycle approach as a qualitative method to solve the issues. In chapter 3, we propose a framework to estimate economic lifetimes of a technology and develop a set of factors to be considered in each transition of a product life cycle to reflect the characteristics of the product adopting the technology at the evaluation point of time. In chapter 4, the proposed method is applied to an example case to illustrate its practical use. Finally, the implications of the framework for firms or valuators are discussed.
2. Approaches to Estimating Economic Life of a Technology
The income approach is considered to be suited for the valuation of intellectual property like technologies because it is based on the rationale that its value is determined by income-producing capability of a subject technology (Park and Park, 2002). It determines the fair value of a specified technology by calculating the present value of the income stream over its life time (Kumar et al, 2004). Thus, estimating the economic life of a technology is the first important prerequisite step in the valuation analysis. That is, the estimation of a longer economic life means a greater number of periodic economic income flows to be projected. This implies a higher value for the subject technology compared to other technologies with a shorter economic life, with all other factors remaining constant (Reilly and Schweihs, 1998).
Many empirical studies have concentrated on patent information to estimate a length of the time period for a technology (Trajtenberg, 1990; Ernst, 1997). Hirschey and Richardson (2001) defined technology cycle time (TCT) as the median age in years of earlier U.S. patents referenced on the front page of U.S. patents. TCT represents the amount of time that has elapsed between the application of a current patent and the generation of the past related patents. TCT is essentially a measure of cycle time between a current patent and the prior state of knowledge.
Korea Institute of Science and Technology Information (KISTI) developed a methodology called the cited-patent life time (CLT) and then proposed the method to refer the economic life period for a technology in South Korea. However, this approach to estimating the technology lifetime by measuring patent activity indices raises a practical problem. This is partly due to the fact that the international system of patent classification (IPC) does not offer classes exactly corresponding to a certain, product-related technology. In addition, most technologies cannot be identified with a clearly defined set of technical search terms (Haupt et al., 2007).
When a technology that does not have a legal, contractual, and judicial document for its life determinant is valuated, the life cycle analysis is recommended to estimate the economic life period for the technology since it incorporates qualitative considerations of future technological and market conditions with quantitative consideration of existing and historical environments. Thus, this analysis allows for changes in the future with a logically derived estimate of when these changes may occur (Reilly and Schweihs, 1998). The life cycle analysis has evolved from the theory of marketing and marketing management. A typical life cycle is described by an introduction stage, a rapidly increasing growth stage, a decreasing growth stage leading to maturity, and a decline stage when substitution occurs. Many empirical studies have focused on the factors leading to success or failure of a new product in the market (Norton and Bass, 1986; Popper and Buskirk, 1992; Mahajan and Muller, 1996; Klepper, 1996).
Although estimating the economic life of a technology is the first critical step in the whole valuation process, many studies have concentrated on quantitative analysis via patent information. Thus, there is no approach to estimate the economic life of the technology with a qualitative method such as life cycle analysis in the valuation. This study proposes a new approach that can estimate economic life of a technology by analyzing the historical lifetime of a product substituted by the new technology and then by adjusting it with important factors that are significantly influenced in transitions during a life cycle stage. In this study, we adopt a product life cycle stage rather than a technology life cycle because, in practice, the economic feasibility of technology-based business is derived on the basis of the income-producing capability of a product that the subject technology is applied to.
3. Framework of New Approach to Lifetime Analysis in Valuation
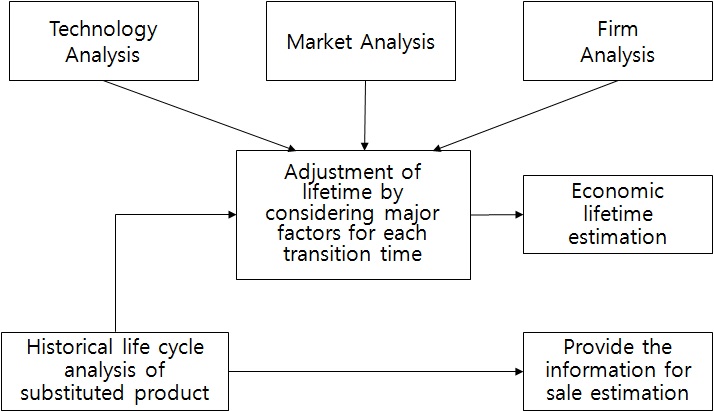
Various methods have been used to estimate the lifetime of a technology. However, current methods to estimate the lifetime in the whole valuation process are mostly fragmentary because they neither consider other important factors that influence the lifetime nor provide explicitly the important parameters that influence the expected sales and growth rate for the period as shown in Figure 1 (Lee, 2010). Such estimation analysis has high possibility to cause the technology lifetime to be underestimated or overestimated since economic lifetime and income estimation are significantly influenced by various capacities and strategies of a firm (Griffin, 1997; Filippini et al., 2004). Consequently, a new approach to estimating technology lifetime is required.
The proposed approach to lifetime analysis is designed to enhance the logic of the valuation by interconnecting with the results of analysis in diversified perspectives such as technology, market, and firm. In the new framework, the valuation progresses are as follows:
First, a historical life cycle analysis for the product that a new technology-adopted product will substitute is conducted. The length of each stage in the product lifetime is derived through analyzing the historical life cycle of the substituted product. Additionally, important parameters such as growth and decline rates, and maximum market size are identified.
Second, adjusting the historical life cycle of the substitute product is required to reflect the conditions that the new product faces at the time of valuing the product. That is because the product adopting the new technology faces different situations compared to that which the substituted product faced.
In this study, we propose multidimensional critical factors to consider for each transition that have been examined in the product life cycle literature. The information for these factors can be verified by analyzing technology, market, and firm. Therefore, it can strengthen the logical structure of valuation (See Figure 2).
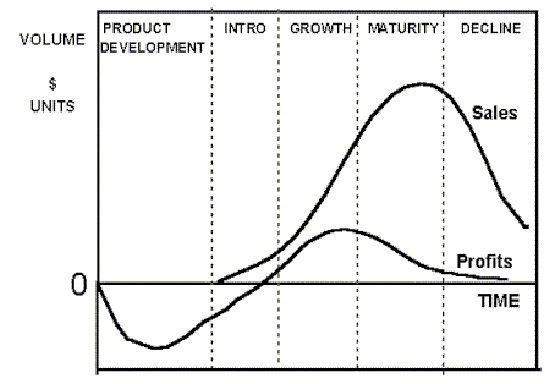
The product life cycle (PLC) analysis provides information for better managing the entire lifetime of a product from its conception, through design and manufacture, to service and withdrawal from a market. Therefore, the understanding of a product’s life cycle can help a valuator to estimate logically and rationally its economic life cycle. Generally a product life cycle consists of four stages and each stage is defined as follows (Golder and Tellis, 2004; William et al., 1997).
The duration of each stage of the cycle varies with the product characteristics, uncontrolled market situations, the management’s support, experience in R&D and production, etc. In order to adjust the life cycle of a new product, we use a three-dimensional approach for each distinct phase. The dimensions are technology, market, and firm.
3.1 From Introduction to Growth Stage
The degree of technological innovation may disrupt the existing economic conditions and require a change in the business context. Generally it is presented as radical or incremental innovation based on the degree of technology innovation. Radical innovations make the existing knowledge obsolete and promote an alternative user group to experiment with the new technology. Incremental innovations, on the other hand, have more to do with exploitation and competence-enhancing measures, enabling the firms to build on existing routines and skills (Elfring and Hulsink, 2003). If a new product containing radically innovational technologies is introduced, there is considerable uncertainty as to its technological performance in the market (Tatikonda and Rosenthal, 2000).
Firms tend to combine field testing and test marketing due to the initial low reliability of the new product. In order to survive during this phase, firms need R&D to alter and improve the existing product’s weak points. This technological evolution can lead firms to discover unknown customer benefits and applications from observing product usage (Popper and Buskirk, 1992). This implies that firms must concentrate on a market research effort more than customer support in the transition from the introduction to the growth stage. Therefore, valuators need to understand market uncertainty and technological uncertainty that could impact the new product’s life. Chen et al. (2005) suggested the conceptual construct of uncertainty in technology. Uncertainty of technology is posited in terms of novelty and turbulence.
For the organizational perspective, capacities in R&D will determine successful survival from the perspective of technology (Lilien and Yoon, 1989). In addition, these continued technological evolution activities among firms require an amount of investment in the condition that firms cannot produce the same incremental profits. R&D is intrinsically characterized by high information opacity, implying more difficulties to find external financial funds constraints (Ughetto, 2008; Brighi and Torluccio, 2009). Thus, valuators should consider a firm's internal finance capabilities when in a condition of not producing enough profits.
3.2 From Growth to Maturity Stage
The available and advanced technological features that are embodied in the new product are explored throughout the transition from the introduction to the growth stage. As this exploration between producers and customers starts to converge on a consensus of the desired technological configuration, a dominant design emerges (Schilling, 2009). The dominant design establishes a stable architecture for the technology and enables firms to focus their efforts on process innovations that make production of the design more effective and efficient or on incremental innovations to improve components within the architecture (Schilling and Esmundo, 2009). Reducing price and increasing adoption leads to the take-off of the product in the market while avoiding uncertainty. Thus, to become the dominant product design among competitors for the industry is the goal of this stage. The primary sources that shape which technology design will rise to dominance are network externalities and learning effects (Schilling, 2010).
Network externalities exist when the utility of a product to a consumer increases as more consumers adopt the new product (Rohlfs, 2001). Network externalities are considered to be direct if utility is directly affected by the number of other users of the same product, as in the case of telecommunication products and services such as faxes, phone, and e-mails (installed base). Network externalities can also be indirect if the utility increases with the number of users of another complementary product (complementary goods).
For the organizational perspective, as firms accumulate experience with the technology, they discover better ways to produce new technological solutions that may enable it to reduce input costs or waste rates. This is known as the learning effect. However, it diversely appears in every firm due to the firm’s absorptive capacity (Cohen and Levinthal, 1990).
Once the product has been proven a success, more customers become aware of it and its benefits. This increases sales and attracts numerous competitors to enter the market very quickly. Many new entrants erode market share among market leaders, triggering the start of a price war (Popper & Buskirk, 1992). However, this competition drives productivity improvements forward which induce growth in the market (Nickell, 1996; Peres et al., 2010). This dynamic in markets need considerable marketing concentration on brand, distribution, and promotion.
3.3 From Maturity to Decline Stage
As the industry evolves towards maturity and decline stages, the product design becomes more standardized and uniform, and the premium attached to technological superiority recedes (Agarwal and Audretsch, 2000). Diminishing technological differentiation in this transition leads to participating in price wars and the firms which can produce most cost effectively and efficiently rather than most sophisticatedly can be successfully maintained. Consequently, firms that are successful will be ones that emphasize the production-oriented technology to provide low-cost and high quality output, which requires choosing a capital-intensive strategy (Popper and Buskirk, 1992).
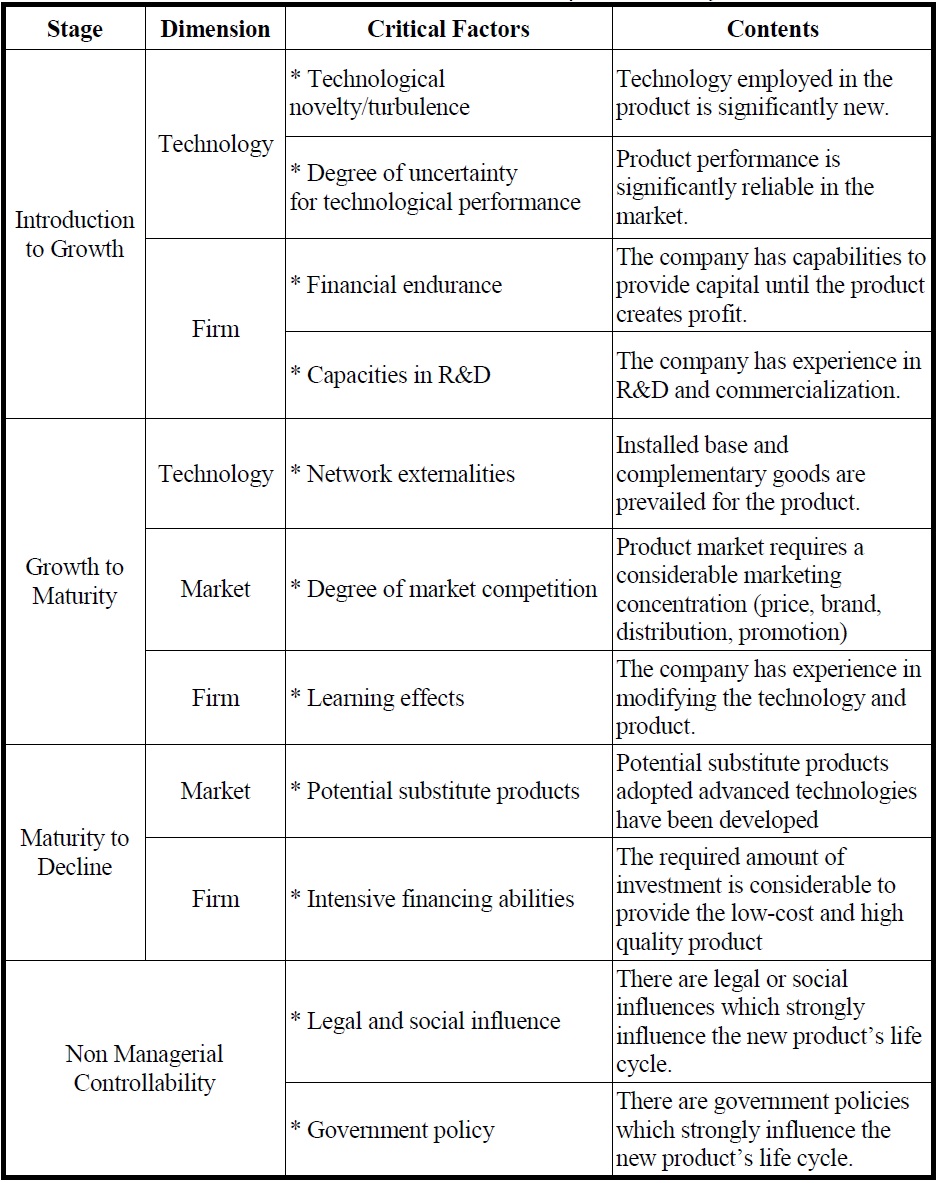
[Table 1] Critical factor in the transition phase of life cycle

Critical factor in the transition phase of life cycle
From the aspect of the market, obsolescence is a major cause that drives the transition from the maturity stage to the declining stage. If a new innovative product is released in the same market, the value of a technology-related product may decline rapidly. The development of 3.5-inch diskettes and CD-ROMs, replacing the 5.25-inch floppy diskettes and the increasing number of compact disk (CD) musical recordings as opposed to vinyl records, are examples of retirements due to obsolescence (Reilly and Schweihs, 1998). For a valuator, it is mandatory to identify potential competitive products and understand the long-run trend of their development activities.
3.4 Non Managerial Controllability
For the product life, some factors are controlled within a firm, while others can be partly controlled, or are not under the control of management at all. The uncontrollable factors include regulation, government’s subsidy policy, and other social influences (Lilien and Yoon, 1989) that could strongly impact the new product’s life cycle (Keoleian, 1993; Abernathy and Utterback, 1978).
Restriction of the Hazardous Substances Directive (RoHS) and the emission standards in the EU are examples of regulatory factors that cannot be controlled by a firm. RoHS restricted the use of the six substances like lead (Pb), mercury (Hg), cadmium (Cd), hexavalent chromium (Cr6+), polybrominated biphenyls (PBB), and polybrominated diphenyl ether (PBDE) due to their environmental hazards, taking effect on July 1, 2006. As a consequence, the productions of nickel-cadmium (NiCd) batteries have dramatically shrunk while the growth of lithium batteries has rapidly accelerated. In addition, new emissions standards forced auto manufacturers to develop hybrid electric vehicles or electric vehicles, leading to the promotion of lithium batteries. These regulations not only brought the growth of lithium batteries forward, but also shortened the lifetime of NiCd batteries.
We can summarize the critical factors in each phase of the life cycle in terms of technology, market, and firm. As a company is approaching toward the later stages, marketing efforts are more necessary than technical or engineering efforts (Popper and Buskirk, 1992). Thus we need to concentrate more on technology and/or market in each transition phase. Additionally, we can describe each critical factor in detail in Table 1. The contents of critical factors make valuators to extrapolate economic life cycle of a new technology-adopted product by comparing the technological and/or market circumstances that the substituted product faced.
In this section, we applied the proposed framework to an illustrative case to show how valuators could estimate the lifetime of a technology in consideration of the critical factors. In this example, we valued the light emitting diode (LED) backlight unit (BLU) technology for the liquid crystal display (LCD) TV, which substituted, the cold cathode fluorescent lamp (CCFL) BLU technology for the LCD TV. First, we analyzed the substitute products, the LCD TV adopting the conventional BLU. Second, we considered the critical factors to adjust the economic lifetime of the LCD TV adopting LED BLU technology at the time of the valuation. Finally, we obtained the important information such as growth rate and market size which might be useful to estimate the sales.
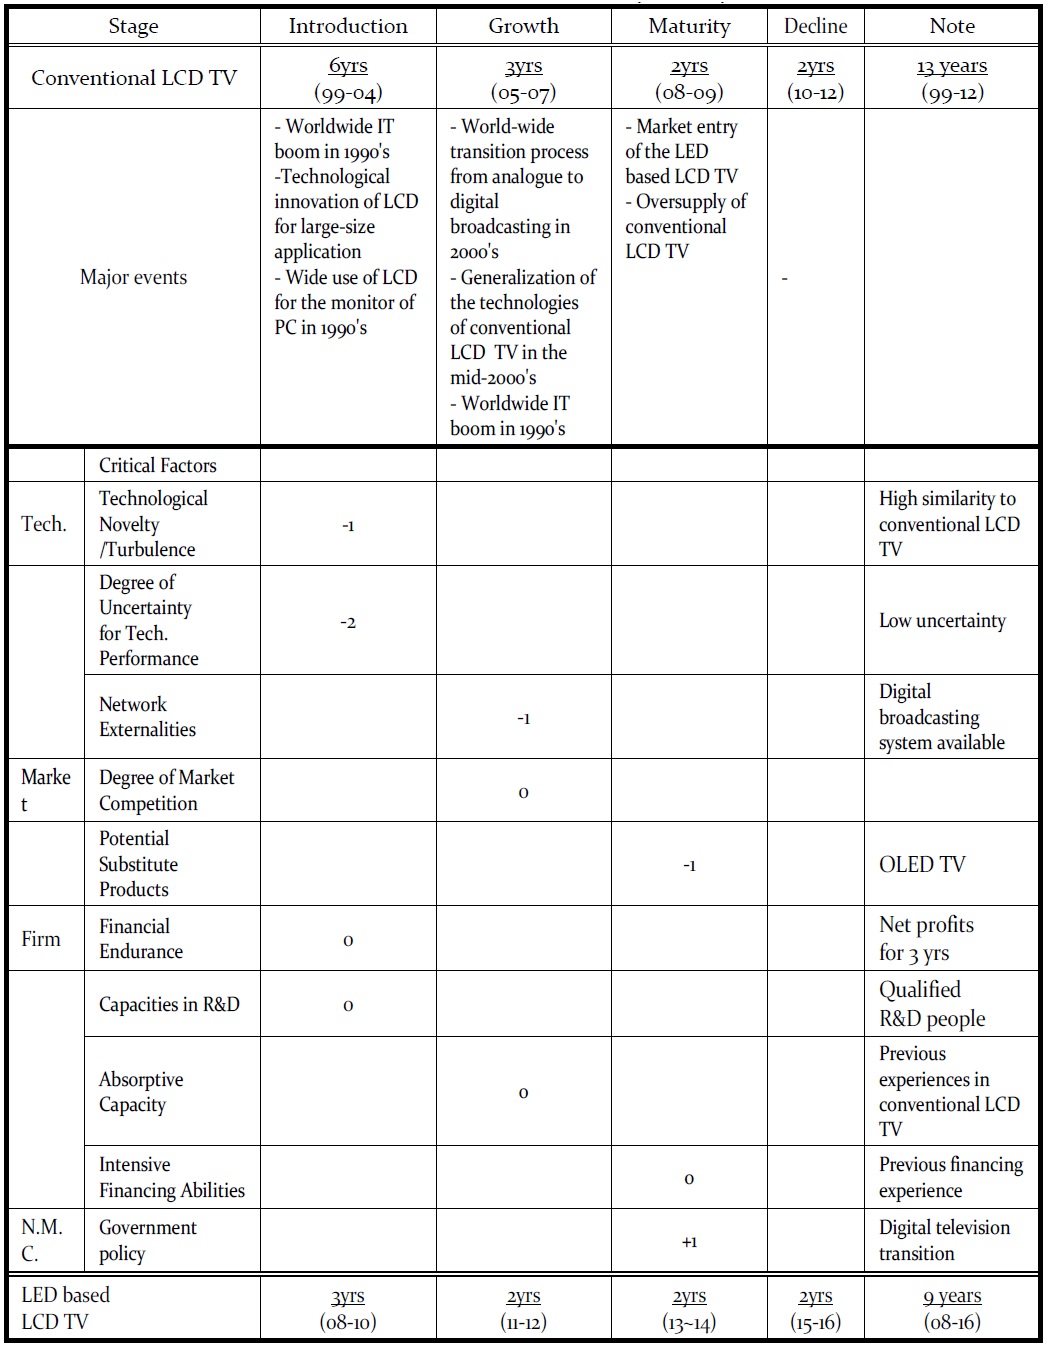
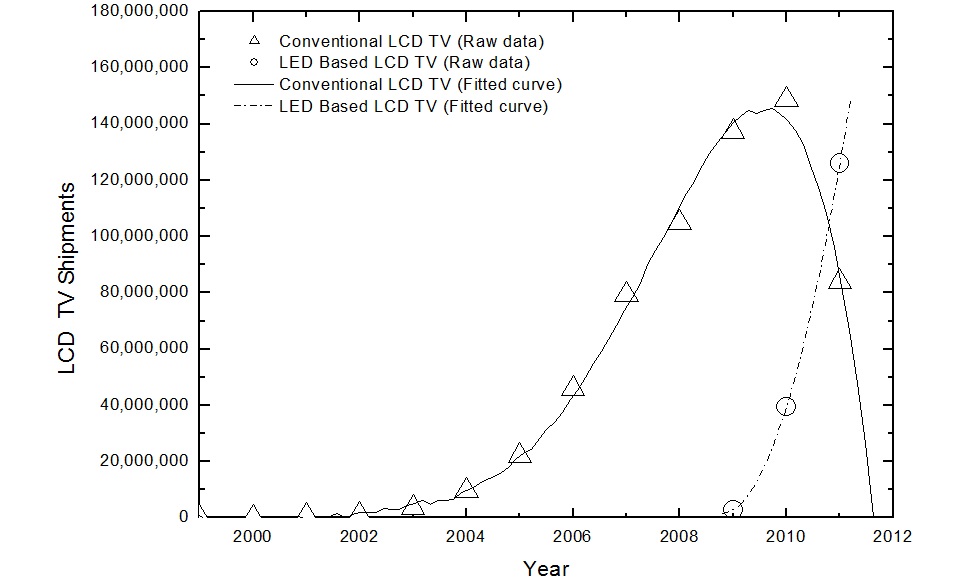
The patterns of global shipments of the conventional LCD TV(mainly LCD TV with CCFL BLU) and LED based LCD TV(LCD TV with LED BLU) are described in Fig. 4. Shipment data were obtained from several sources, including Display serarch, ISuppli, Digital Times, Gartner, etc. In order to investigate the product life cycle, we fitted the data to polynomial functions by using origin 7 software.
Four different stages in the life cycle of the conventional LCD TV were identified. The introduction stage covered the first 6 years (1999-2004), 210 followed by another 3-year growth stage (2005-2007). After the growth stage, the maturity stage (2008-2010) began in the 10th year and finally it entered into a stage of decline in the 12th year (2011-2012). It can be seen that the period of the decline stage is about 2 years. Consequently, we concluded that the economic lifetime of the LCD TV with the conventional BLU (substitute product) is 13 years. We examined the relations between this life cycle and the critical factors in the transition phase of the life cycle by investigating the events of the IT industry in Korea.
In the 1990s, there was the worldwide boom of IT industry. The rapid development of IT industry in the 1990s brought large capital and advanced research experience to the IT firms. Hence, in terms of both the financial endurance and the capacities in R&D, we regard the worldwide IT boom in the 1990s as one of the most important events that influenced the transition from the introduction stage to the growth stage since major firms that produced the LCD TV were ones of the successful IT firms of the 1990s.
In the mid-1990s, it was thought to be impossible to create an LCD TV exceeding 40 inches. However, in 2002, a 42-inch LCD was developed by LG-Philips LCD. In 2004, the size of the LCD was increased to more than 55 inches. Since one of the main motivations for buying a TV is its size, we consider the technological innovation of the LCD for large-size application as one of the important events that influenced the transition from the introduction to the growth stage, in terms of technological novelty.
On the other hand, before the market penetration of the LCD TV, LCD monitors for PCs were widely used and showed possibility to replace the CRT TV with LCD TVs. Hence, in terms of the degree of uncertainty for technological performance, we regard the wide use of the LCD for the monitor of the PC in the 1990s as one of the important events that influenced the transition from the introduction to the growth stage.
Comprehensively, we suggest that four critical factors: such as the degree of uncertainty for technological performance, the technological novelty/turbulence, the financial endurance, and capacities in R&D significantly influenced the transition from the introduction to the growth stage in the life cycle of the conventional LCD TV.
Growth to Maturity
The world-wide transition process from analogue to digital broadcasting in the 2000s created the large demand for high-definition televisions (HDTVs). As LCD-type HDTVs were developed, such increase in the demand of HDTVs led to increase in the demand of LCD TVs. On the other hand, HDTVs are used for much more than watching broadcast TV. Beyond watching TV, HDTVs can be used in a variety of situations, including playing games and connecting with a computer for work. Indeed, HDTVs are multi-functional entertainment centers with adapters that enable compatibility with many other devices that increase consumer's utility. The additional functionality of HDTVs includes compatibility with household PCs, video game consoles, and audio/video devices (including high-definition devices), etc. The large number of products that are compatible with HDTVs would accordingly influence consumer's value of the TV beyond a simple device used to watch traditional broadcast TV. Hence, the market for HDTVs is likely to exhibit an indirect network externality. Comprehensively, in terms of the network externalities, we suggest the worldwide transition process from analogue to digital broadcasting in the 2000s as one of the important events that influenced the transition from the growth to the maturity stage.
As the technologies of the conventional LCD TV were generalized in the mid-2000s, competition among LCD TV companies became more intense and the cost of the conventional LCD TV came down. Such price decreases led to the popularization of the LCD TV, and also led to increased demand of the LCD TV. Hence, in terms of the degree of market competition, we regard the generalization of the technologies of the conventional LCD TV in the mid-2000s as one of the important events that influenced the transition from the growth to the maturity stage.
Major firms in recent years that produce LCD TVs are some of the very successful IT firms of the 1990s. The rapid development of IT industry in the 1990s brought sufficient experience in commercializing a new technology to those IT firms. Hence, in terms of the absorptive capacity, we consider the worldwide IT boom in the 1990s as one of the important events that influenced the transition from the growth to maturity stage.
Comprehensively, we suggest that three critical factors to include network externalities, the degree of market competition, and absorptive capacity to have significantly influenced the transition from the growth to the maturity stage in the life cycle of the conventional LCD TV.
Maturity to Decline
In the past, the back light module of conventional the LCD TV mainly consisted of CCFL. However, the CCFL did not have a good color space and its lifetime was only about 15,000~50,000 hours. Furthermore, there were some environmental issues in CCFL backlighting because it contains poisonous mercury inside the lamp (Chiu and Cheng, 2007; Chiu and Chen, 2008). For these reasons, the trend today is to replace CCFL with LED as the backlight material of the LCD TV. The LCD TV with LED BLU was firstly developed by SONY. However, the LED based LCD TV was popularized by Samsung Electronics. The LED based LCD TV started to penetrate the market in 2008 and gradually replaced the conventional LCD TV. Hence, in terms of the potential substitute products, we consider the market entry of the LED based LCD TV as one of the important events that influenced the transition from the maturity to the decline stage.
As the LCD market reached its maturity, the trend of oversupply in conventional LCD TVs was started. Such oversupply led to lower price of conventional LCD TVs, and reduced the profitability of the LCD industry. After all, in 2008, several LCD companies reduced the shipments of conventional LCD TV panels. Therefore, in terms of intensive financing abilities, we regard the oversupply of LCD TV panels as one of the important events that influenced the transition from the maturity to the decline stage.
Comprehensively, we suggest that critical factors such as potential substitute products and intensive financing abilities significantly influenced the transition from the maturity to the decline stage in the life cycle of the conventional LCD TV.
Non Managerial Controllability
There were legal or social influences which strongly influenced the life cycle of the conventional LCD TV. For example, it has been reported that the rise of the LCD TV market was promoted by the World Cup. On the other hand, there were government policies which strongly influenced the life cycle of the LCD TV. In Taiwan, the LCD industry had accomplished a rapid growth on the basis of government policies and strongly influenced the global LCD TV market. Comprehensively, we suggest that two critical factors include legal and social influences and that government policy significantly influenced the life cycle of the conventional LCD TV.
On the basis of the previous review, we estimated the economic lifetime for the LED based LCD TV. In this analysis, we selected the year 2008 as the point of time for our evaluation. Evaluation time is essential in life cycle estimation, especially in an industry with very rapid technological change. The result of estimation in a certain year and in few years later may be quite different.
Introduction to Growth
Except for the BLU technology, the technology of the LED based LCD TV was very similar to that of the conventional LCD TV. Hence, several technologies of conventional LCD TVs could be used to develop the LED based LCD TV. The degree of uncertainty for technological performance in the LED BLU market was expected to be small since many kinds of LED products had been developed before 2008. The market uncertainty of the LED based LCD TV was estimated to be smaller than that of the conventional LCD TV since the market size of LCD TVs was expected to increase during 2009 to 2015 according to Display Search. Major firms developing LED based LCD TVs had sufficient R&D capacity (qualified R&D researchers) and secured funds (net profits for past 3 years). Comprehensively, we estimated the period from introduction to growth stage of the technology to be 3 years (2008-2010).
Growth to Maturity
There were several technological reasons for the delay in popularization of the conventional LCD TV such as large area manufacturing technology and the digital broadcasting system. Before the popularization of the conventional LCD TV, there were several technological constraints such as large area LCD manufacturing technology and the digital broadcasting system.
In the year 2008, such technological difficulties were mostly overcome. The degree of competition in the market of the LED based LCD TV was estimated to be similar to that of the conventional LCD TV. Firms in the LCD TV industry including LED technology-owned companies had sufficient absorptive capacity because of the similarity between the technologies of the LED based LCD TV and that of the conventional LCD TV. Comprehensively, we estimated the period from growth to maturity stage of the technology to be 2 years (2011-2012).
Maturity to Decline
An organic light-emitting diode (OLED) display had attracted much attention because of its higher performance characteristics than those of a conventional LCD, by having excellent image quality, lighter weight, and a thinner panel. OLED TVs was introduced by Sony Corporation in December 2007, and became a preferred display technology among experts in the area. However, production is still limited because of technological problems. If such problems were solved, OLED TVs will become a new leader in the TV industry (Tseng et al. 2009; Hiroshige et al. 2010; Ho et al. 2011). According to Display Search, the market for OLED TVs will reach 2.33 million units in 2013. The company proved to be able to raise a vast amount of capital from outsiders and have the financial capacity to compete with its competitors. Comprehensively, we estimated the period from maturity to decline stage of the technology to be 1 year (2013).
[Table 2] Lifetime of LED based LCD TV and important parameters

Lifetime of LED based LCD TV and important parameters
Non Managerial Controllability
The regulation for the transition to digital television has significantly influenced the sales of LCD TVs. The analogues services were expected to stop by 2015 when the Geneva 2006 Agreement set. The European Commission has designated 2012 as the year by which analogue terrestrial TV transmissions will cease in Europe. Thus, many experts predicted that the regulation would affect the LCD TV market positively. Many countries planned to complete the transition to digital service by 2012 which would extend the product lifetime of the LCD TV. Consequently, we added 1 year in the transition from maturity to the decline stage.
A number of researches on quantitative techniques have been conducted on the basis of patent information for estimating lifetimes. There has been a longstanding misconception that the more quantitative a model is, the better the evaluation can be. For the analysts, the quantitative techniques have no interconnections with other important factors which should be considered.
Dissel et al. (2005) emphasized qualitative aspects of business evaluation and proposed that these techniques generally attempted to structure reasoning and serve as an aid to decision makers in shaping their judgment. Yet, little is known about how approaches are applied.
Thus, this paper aimed to establish a structural framework of estimating the lifetime of a technology by integrating the outputs of an analysis of the determinants in each transition of a product life cycle. This paper first provided a framework for expert judgment of the technology lifetime by using multidimensional factors that have been examined in the product life cycle literature. In this framework, how to adjust the length of each stage is determined by experts. Hence, further studies to improve this framework are needed. The framework enables valuators and experts to estimate product lifetime logically. Additionally, the important parameters such as growth rate and market size are provided to estimate sales. This information also enables them to assess the sales forecast.
Finally, the framework is embedded with various organizational capacities which can play a most important role in determining the lifetime. Even though the proposed framework practically contributes a practical way to estimate lifetimes in technology valuation, it is an exploratory attempt and thus subject to limitations: (1) adjustment factors such as intensive financing abilities may not be critical due to outsourcing and the factors based on experts' judgments need subjective reviews and (2) deciding the length of decline stages requires more sophisticated analytical tools.