Studies on innovation point towards the need for both in-house research and development (R&D) capabilities along with collaborations with external organisations or linkages with other firms, universities and research institutes. The argument is that innovation is not just a firm specific factor but requires support from several other factors which in turn involves developing linkages with various actors/institutions as sources of resources and/or knowledge for innovation. This paper presents findings from an exploratory study about the Malaysian biofuel sector as an innovation system. Instead of using the neo-classical approach and proposing policy interventions based on traditional market failure rationale (Bergek et al., 2008a), the functional analysis of the technological innovation systems (TIS) approach is used to analyse the biofuel sector in Malaysia to help reveal the strengths and weaknesses in terms of its fulfillment of seven critical functions which are necessary for the generation and commercialization of a product. In addition an attempt is made to reveal the inducement and blocking mechanisms affecting the Malaysian biofuel TIS and the seeking of improved poor functionality. These functional aspects of the Malaysian biofuel sector are analysed in different phases of its development to gain an understanding of the different institutions and their functions at different phases of the development of the innovation system.
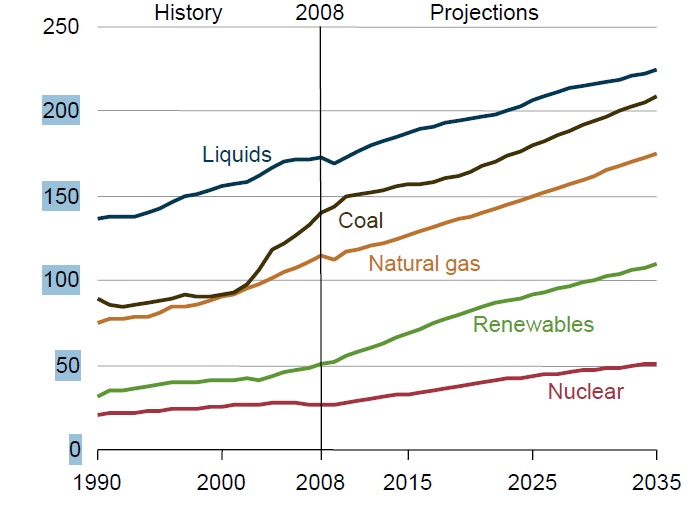
No one can deny the vital role of energy in the world economy. Energy is the blood without which economic growth is impossible. So far, the largest source of energy has been liquid fuels, followed by coal and natural gas respectively, and it is predicted that this trend is not going to change in the near future (Figure 1). All of these sources have a big problem: they are finite and will finish one day. Moreover, they play a major role in such environmental issues as the global warming and air pollution. For these reasons, renewable energy sources have been under the spotlight in recent decades.
Biofuels are one of the resources of renewable energy that can be produced from different plants. In tropical and subtropical countries including Malaysia, crude palm oil is considered one of the most attractive raw materials for its advantages including higher yield of oil and lower production costs than other vegetable oils. (Silalertruksa et al., 2011) This type of biofuel, more specifically called biodiesel, is a fatty acid methyl ester produced through transesterification of palm oil. Malaysian biodiesel is not an old industry of this country. The building of the nation’s first biodiesel plant started in 2005. (Lim & Teong, 2010) However, since then, investors’ interest in it has grown. According to the official portal of the Malaysian Palm Oil Board (MPOB), there are about twenty-nine companies in the biofuel or biodiesel industry of Malaysia. After a short-lived promising start, the biodiesel industry of Malaysia is facing a crisis now. Despite being a leader in palm-based biodiesel or palm methyl ester (PME) back in 2005, Malaysia is now losing out to latecomers like Indonesia, Thailand and Colombia, which in turn are competitive players. Exports were reported to be falling (from 86000 tonnes in 2010 to 50000 tonnes in 2012) while neighbour Indonesia exports were at 1.37 million tonnes. (Adnan, 2012). There are other success stories of biofuel development and exports from neighbours Thailand and far away Brazil, Argentina and Columbia.
While people in the industry mention about subsidies and investments needed in order to develop and promote better the biofuel industry in Malaysia, there is a push or support in terms of funding etc, from the government of Malaysia for the development of this sector as one of the NKEAs ? National Key Economic Activities. Given this situation, it was felt that the Malaysian Biofuel sector would provide an interesting backdrop for an investigation from an innovation systems perspective. It has become accepted in the developed world to use an innovation systems approach to develop or analyse developments of sectors and their innovation performance i.e. What different institutions are involved in production and the use of scientific knowledge and consequently what are the inter-linkages among science and technology producing institutions (like universities or R&D labs etc.), industry and other institutions or actors?
Thus the main aim of this paper is to explore and analyse what are the institutions and their role in the development of the biofuel / bio diesel sector of an emerging economy like Malaysia. This paper seeks to understand from the functional analysis view the problem/s facing this sector given its negative growth. The technology for this sector is based on the resource available (palm oil) and there is a research institution that has developed this technology indigenously. Hence the paper adopts a functional analysis approach to analysing the Malaysian biofuel industry as a technological innovation system (TIS).
While the biofuel sector can be seen as a sectoral innovation system ? we present the biofuel sector as a technological innovation system. We feel there is a need to see how this knowledge or technology developed by government owned research is exploited in order to create new business opportunities. This stresses the importance of individuals / entrepreneurs as sources of innovation, which could be overlooked in the more macro-oriented, national or sectoral innovation system approaches.
The structure of the paper is as follows. Following the introduction and overview of the Malaysian biofuel sector, background literature related to the paper is overviewed to identify the framework to be used for analysis of the biodiesel sector. This is followed by the main parts of the paper with an events analysis and functional analysis, and an analysis and evaluation of the Malaysian Biofuel sector. Policy implications are drawn and some recommendations based on this analysis are offered sending with a conclusion.
2. The Malaysian Biodiesel Sector
This section is an overview of some aspects of the biofuel sector in Malaysia. The Malaysian biofuel sector has twenty-nine members and if all the firms that have acquired the license start to act, the number of the competitors will exceed one hundred translating into a high level of rivalry. Furthermore, rivalry becomes destructive when its basis is price. The probability of a price war is quite high in the biodiesel industry, because the products of the rivals are more or less identical and the buyers do not have to deal with high switching costs.
The main raw material used by the biodiesel producers in Malaysia is palm oil and these suppliers seem to have a strong bargaining power over the biofuel producers. First of all, palm oil producers do not heavily depend on biodiesel firms as their main customers as they do with the food industries. (eighty percent of the Malaysian palm oil market belongs to the food sector (Jayed et al., 2011)). Moreover, although there are substitutes for palm oil (for example, jatropha oil) to which the biodiesel companies can switch, they are not fully commercialized yet. As such, the main choice of raw material is mainly palm oil. Finally, forward integration by suppliers is another source of threat and this has already happened in a number of cases. For instance, two major palm oil producers, namely Sime Darby and Kuala Lumpur Kepong Berhad, have already added biodiesel to their portfolio and are active in this sector as well.
[Table 1] Malaysia??s biodiesel production and export
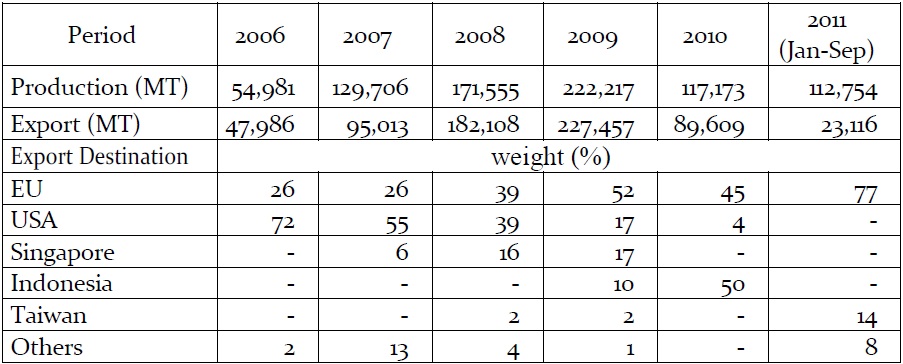
Malaysia??s biodiesel production and export
The data in Table 1 demonstrate, Malaysian producers rely mainly on exporting their product. In 2008 and 2009, the amount of biodiesel export is even greater than the production quantity in those years. The extra amount must have been sourced from the stock remained from the previous years. This shows that the biodiesel sale in the local market is even less than the small amount that the difference between the production and the export quantity indicates. Furthermore, Table 1 reflects a lack of diversity among foreign customers. According to Porter (2008) this situation shows that the buyers have negotiating leverage. To be more precise, when there are few buyers who purchase in large volumes (specially, in industries with high fixed costs such as bulk chemicals), the industry players feel high pressure from their customers. The fact that this sector relies mainly on foreign markets has already turned into a big problem. So far the EU and the USA have been the major export destinations for this sector. However, due to regulatory changes, the biodiesel industry of Malaysia is facing tough challenges in these markets.
As the brief analysis above illustrates, the biodiesel industry in Malaysia faces a difficult situation. How can this sector reduce the high pressure these different forces exert on it? This is the main question we try to find some answers to in this study. For doing so, it is felt that there is a need to have a clearer picture of the internal as well as the external institutions or mechanisms affecting this industry. Once the weaknesses and the strengths besides the threats and opportunities are known, it would be possible to offer recommendations for improvements.
In the next section, a brief review of literature related to innovation systems is done in order to identify a framework to help analyse the Malaysian biofuel industry in depth.
Biofuel industry is an example of technological change. As such, two different phases comprise it: invention and innovation (West & Gallagher, 2006). Invention is the scientific breakthrough and “innovation is invention implemented and taken to market” (Hellsmark, 2010, p.15). This process, from the birth of a technology or product to its commercialization, can be studied by means of different approaches. One of them is the neo-classical theory. In this framework, the key variable is price. Firms choose their products and the technology for making those products so that they can obtain the highest returns (Jacobsson & Johnson, 2000). As Smith (2000) has shown, the neo-classical approach is based on the assumption that technological knowledge is generic, codified, costless accessible and context independent. As a result, firms become
3.1 Innovation Systems ? Introduction
Smith (2000) believes that “more recent theory and applied research suggests that these characteristics are not a good guide to the nature of technological knowledge” (p.86). Smith is not the only scholar who has criticized the neo-classical theory and its shortcomings have been addressed repeatedly in the literature by different authors. (Bergek et al., 2008a) The main point that this framework misses is the
According to Lundvall (2010), a system has two building blocks: a number of elements and the relationships between them. Therefore, an innovation system “is constituted by elements and relationships which interact in the production, diffusion and use of new and economically useful knowledge” (p.2). Different criteria have been used in drawing the borders of innovation systems. The examples are national systems of innovation (Lundvall, 2010; Nelson, 1992), regional innovation systems (Cooke et al, 1997), sectoral systems of innovation, (Malerba, 2002) and technological systems. (Carlsson & Stankiewicz, 1991)
Among the above categories, the last one, that is the technological innovation system (TIS)1 framework, is deemed as the appropriate choice to identify a framework for this study. A number of scholars have proposed it as the suitable framework for analyzing the diffusion of renewable energies (see for example, Jacobsson & Bergek (2004) and Negro et al (2012)) because it is particularly attractive when a new technology has to compete with an incumbent one (Jacobsson & Johnson, 2000). These studies rely on the concept of a technological system defined by Carlsson & Stankiewicz (1991) as “a network of agents, interacting in a specific
3.2 Innovation Systems - Functional Analysis
Bergek et al. (2008a) argues that analyzing the structural composition of a system does not help much in its evaluation. The reason is the fact that we cannot regard the mere existence of a component as a weakness or strength. As mentioned above, the overall function of a TIS is the generation and diffusion of a specific technology. Hence, the constituting elements of a system should be assessed in relation to their contribution to this overall function. In other words, in addition to the structural focus, process focus is necessary as well. This can be done through what is called functional analysis. This type of analysis makes it possible to differentiate structure from content and understand what a system achieves (Jacobsson, 2008).
Different attempts have been made to identify these functions and classify them. For this project, we have chosen the one proposed by Bergek et al. (2008a). Their framework consists of seven functions on which, as they claim, “there is quite large agreement between different functions approaches” (p.410). These seven functions are as follows:
i. Knowledge development and diffusion: this function highlights the breadth and depth of the knowledge base of a TIS. As its name shows, it covers how this knowledge base evolves over time (development) and propagates in the system (diffusion).
ii. Influence on the direction of search: the formation and growth of a TIS depends on the number of its actors who join the system because of the incentives and/or the pressures they face. The second function is related to these factors. In addition, it “covers the mechanisms having an influence on the direction of search within the TIS, in terms of different competing technologies, applications, markets, business models, etc.” (Bergek et al, 2008a, p.415).
iii. Entrepreneurial experimentation: one characteristic that always accompanies a TIS is uncertainty. What reduces this uncertainty is entrepreneurial experimentation. Entrepreneurs probe into uncertain applications and markets and find out opportunities (Jacobsson, 2008). Here, in comparison to the first function, the emphasis is on the applied knowledge that takes shape within a TIS (Jacobsson & Bergek, 2006).
iv. Market formation: the degree of growth of a TIS is directly related to this function. In the beginning, the markets are basically nonexistent. As a TIS develops, its markets pass through three distinct phases while their sizes increase: “nursing markets”, “bridging markets” and “mass markets”. Functional analysis should illustrate what phase the markets of a TIS are in. It should also assess “who the users are and what their purchasing processes look like, whether the demand profile has been clearly articulated and by whom, if there are institutional stimuli for market formation or if institutional change is needed” (Bergek et al., 2008a, p.416).
v. Legitimation: the formation of a new TIS is not possible without legitimacy. Functional analysis draws a picture of the social acceptance and desirability of a given TIS in the eyes of the agents and stakeholders. In addition, it investigates actions that are influential in increasing the legitimacy of the system. This is particularly important for those emerging TISs that face a strong competition from powerful established innovation systems (for example, renewable energies versus fossil fuels).
vi. Resource mobilization: a TIS needs different types of resources including competence/human capital (technological experts, entrepreneurs, managers, etc.), financial capital (seed and venture capital, diversifying firms, etc.) and complementary assets (complementary products, services, network infrastructures, etch). This function shows the ability of a TIS in mobilizing these resources.
vii. Development of positive externalities: as a TIS develops and new actors enter it, the aforementioned functions will be fulfilled increasingly. This strengthening of the functional dynamics by the new entrants benefits the other members in the form of positive externalities. For instance, new entrants decrease the uncertainties related to markets and hence strengthen the “market formation” function. Or, they increase the political power of the system and thus improve its legitimacy. This, in turn, brings about positive changes in such functions as “resource mobilization”, “influence on the direction of search”, “market formation” and “entrepreneurial experimentation”. Therefore, this function is “not independent but works through strengthening the other six functions [and can] be seen as an indicator of the overall dynamics of the system” (Bergek et al., 2008a, p.418).
With the help of the definitions and the criteria explained till now, it is felt that an analyst can obtain the achieved functional pattern of particular TI which is to show how the system is functioning. A fruitful analysis must provide evaluation as well and indicate the relative goodness of the pattern it has discovered. By evaluating the functional pattern, its weaknesses and strengths are revealed. In other words, its distance from a desired pattern that creates successful technology diffusion is better understood. In order to move the TIS under study toward this targeted functionality, the analyst should identify the “blocking mechanisms” and also the “inducement mechanisms” that affect the development of the TIS. Examples of the former include poor linkages between the actors, weak articulation of demand from the customers, strong incumbent TISs and so on. Examples of inducement mechanisms include supportive government policies, entry of new firms and so on.
Finally, in its last step, this framework shows how to improve a TIS by creating inducement mechanisms or amplifying the strength of the available ones, and also through weakening or eliminating blocking mechanisms. By doing so, the actors and policy makers will be able to reinforce the functions that are not served properly. The result is a TIS successful in the diffusion and utilisation of the technology it promotes.
3.3 Innovation System ? Functional Analysis Extensions
It is pertinent to note that beside the functional approach (Bergek et al., 2008a) introduced above, there is another framework in this school of thought which is quite close to it. This approach, proposed by Hekkert et al. (2007), expands some of the insights that the previous one offers more in depth. As these two perspectives complement each other in certain ways, we will employ both of them in this study. Similar to Bergek et al. (2008a), Hekkert et al. (2007) suggest seven functions that should be used in mapping the activities of a TIS. They have labelled these seven functions as follows:
F1 Entrepreneurial activities
F2 Knowledge development
F3 Knowledge diffusion through networks
F4 Guidance of the search
F5 Market formation
F6 Resources mobilization
F7 Creation of legitimacy/counteract resistance to change
The main difference between this set of functions and the previous one is in the “development of positive externalities”. Hekkert et al. (2007) have addressed only one source of external economies - namely, “knowledge diffusion through networks” - as a separate function. Bergek et al. (2008a) have included this aspect of externalities in their first function (“knowledge development and diffusion”) and have dedicated a separate function to a broader concept of positive externalities. The rest of the functions are basically identical with minor differences in word choice in some of the functions (for example, creation of legitimacy instead of legitimation, or guidance of the search instead of influence on the direction of search).
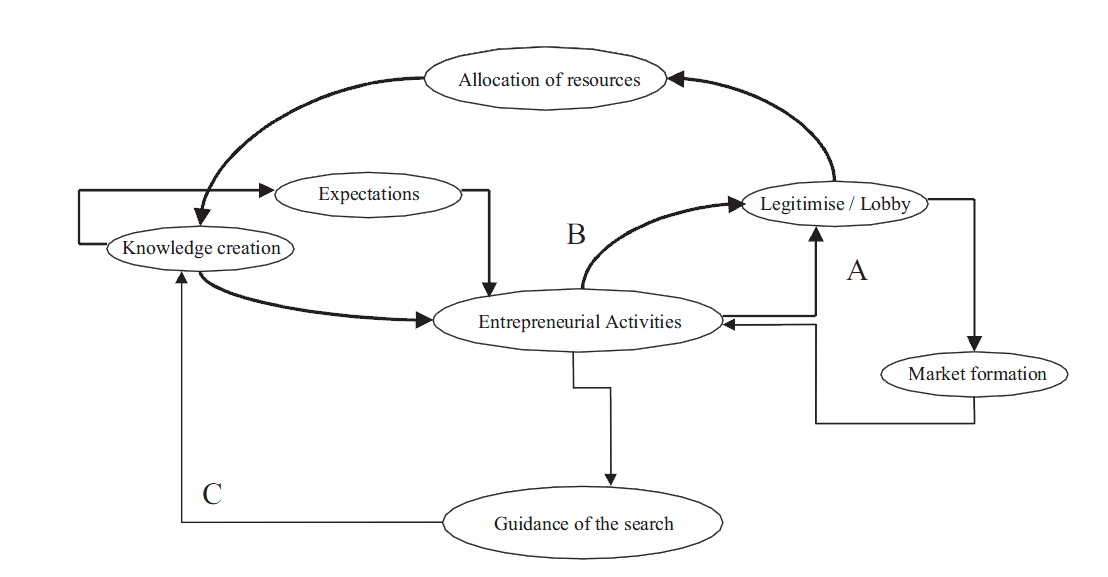
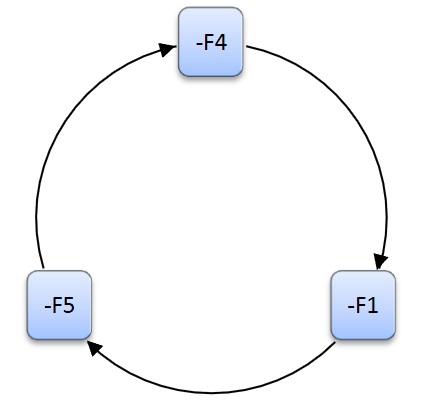
The significant point about this second methodology lies in the way it analyzes the functional patterns. The focus of this approach is on demonstrating “how function X influences technology development and at the same time all the other functions” (Hekkert et al., 2007, p.427). Proponents of this approach argue, “both the individual fulfilment of each system function and the interaction dynamics between them are of importance” (Hekkert & Negro, 2009). Positive reinforcements between the functions create virtuous cycles that lead to the diffusion of a technology (some of the typical virtuous cycles observed in different empirical studies are depicted in Figure 2). Contrarily, obstacles hindering the fulfilment of a specific function might reduce the activities that serve other functions. This situation, known as a vicious cycle, slows down the development of a TIS or may even result in its destruction.
Therefore, what an analyst should first do is to collect the events related to a TIS (events are defined as “what the central subjects do or what happens to them” (Hekkert et al., 2007, p.427)). In the next step, these events are allocated to either one of the functions explained above. After that, the analyst is able to identify the level of individual functions fulfilments and also the virtuous or vicious cycles present in the system.
As a source of renewable energy that has to compete with the powerful incumbent technology of fossil fuels, it is felt that the biofuel industry of Malaysia can be studied utilising this trend in the innovation systems approach. Based on the background literature, it is felt that combining the two approaches proposed by Bergek et al. and Hekkert et al. would provide a complete framework for the analysis of the Malaysian biofuel industry. In the following sections, this combined approach is applied to analyse the biodiesel industry of Malaysia as an innovation system and findings are presented.
1 In the literature, TIS is widely used instead of technological systems to avoid confusion between its different definitions (Hekkert et al, 2007).
The main aim of this paper is to explore and analyse what are the institutions and their role in the development of the Biofuel sector of an emerging economy like Malaysia. The sub objectives are this:
1. To investigate the development of the sector through a historical functional analysis of the biofuel innovation system of Malaysia
2. To analyse the blocking and enabling mechanisms of the biofuel innovation system of Malaysia
The data for this study will be mostly secondary data from different sources including websites of the relevant organisations, articles from daily’s, business magazines and annual reports etc. will be used. In addition this information will be complemented by primary data collected from interviews of stakeholders from business organisations, R&D organisations and other organisations relevant to the sector. A functional analysis using the approach developed by Bergek et al. (2008) and Hekkert et al. (2007) will be done in order to achieve the objectives set.
As it was mentioned in the literature, Hekkert et al. (2007) advises the employment of “event history analysis”, or to be more precise “process approach” or “sequence analysis”, in the functional study of TISs. Inspired by the ideas presented by Poole et al. (2000), they argue that in order to obtain a better understanding of what really happens within TISs, we need to grasp the dynamics of innovation systems because technological change is a dynamic process itself.
The first step in this approach is data gathering. As Hekkert et al. (2007) have emphasized, “the data collection in this case is not so much focused on following all the individual agents or innovation projects in the system, but on events that are
Moreover, it is important to note that this type of analysis is always under the threat of “personal bias” because although “[t]he construction of the event sequences and the narrative is done as ‘objectively’ as possible based on empirical sources […] the interpretation of the researcher is a crucial factor” that still remains and should be minimized (Suurs & Hekkert, 2009b, p.1008). For this reason, the narrative must be verified using feedback from interviews and also informal conversations (Suurs & Hekkert, 2009a). In this regard, a few industry players were contacted and we have used the data obtained through our interviews and informal conversations to verify the event history we have prepared.
After data gathering, each of the events that comprise the history of the biofuel industry in Malaysia should be associated with either one of the seven functions introduced in Literature Review. Among the two function sets available, namely the one proposed by Bergek et al. (2008a) and the one proposed by Hekkert et al. (2007), we have chosen the former because of its comprehensiveness. Therefore, while the analysis framework, that is event history analysis, comes from Hekkert et al. (2007), the function set belongs to Bergek et al. (2008a). In order to make this study comparable with other event history analyses, the order of the functions conforms to that of the former school. Hence, in the event history analysis that follows, the functions are labelled as F1, F2 and so on and refer to:
F1 Entrepreneurial experimentation
F2 Knowledge development and diffusion
F3 Development of positive externalities
F4 Influence on the direction of search
F5 Market formation
F6 Resource mobilization
F7 Legitimation
If an event has positively contributed to the fulfilment of a function, the symbol of that function is presented in a square bracket, for instance [F1]. On the other hand, the negative effect of an event on the fulfilment of a function is indicated by using a minus sign before the symbol of that function, for example, [F3].
In order to determine the best function match for each of the events, besides the general definitions of the functions in the literature, we have used the classification of event types presented by Suurs & Hekkert (2009a). This typology is as follows:
F1 projects with a commercial aim, demonstrations and portfolio expansions.
F2 studies, lab trials, pilots, research programmes, conferences, workshops and alliances between actors.
F3 Suurs & Hekkert (2009a) do not use this function (see Literature Review).
F4 expectations, promises, policy targets, standards and research outcomes.
F5 market regulations, tax exemptions and events constituting niche markets.
F6 subsidy programmes.
F7 lobbies and advice.
A trend is noted based on biodiesel sales in different periods of time. In this regards, three separate phases were discernible:
Phase I in which no production and therefore no sales took place. (1982-2000)
Phase II in which biodiesel sales grew positively each year. (2001-2009)
Phase III in which the biofuel sales decreased year after year. (2010-2012)
In what follows, the development of the biofuel TIS in Malaysia is analysed by three different phases as mentioned above.
The history of the Malaysian biodiesel goes back to 1982, when the Malaysian Palm Oil Board (MPOB) launched its laboratory scale biodiesel project [F2] (Lim & Teong, 2010). In 1983, the Ministry of Plantation Industries and Commodities (at that time, known as Ministry for Primary Industries) formed the Palm Diesel Steering Committee [F4] (Chin, 2011). The successful results of the laboratory project [F4] led to further investments [F6] and the establishment of a pilot plant with a capacity of 3000 metric tonnes of biodiesel per year in 1984 [F2] (Lim & Teong, 2010). On the whole, the period between 1984 and 2000 was dedicated to “extensive laboratory research and field trials” [F2] but no major breakthrough could be observed in this sector, “mostly due to weak industrial demand [F5] and inconsistent political support [F4]” (Lim & Teong, 2010, p.941).
In 2001, the government of Malaysia published the Eighth Malaysian Plan and in it emphasized its interest in palm diesel “as a viable potential fuel for the transport sector” [F4] (Economic Planning Unit, 2001, p.334). Accordingly, after extensive consultations with different stakeholders [F7], the government introduced the National Biofuel Policy in 2005 [F4] (Abdullah et al, 2009).
In this policy, the priority is given to biofuel for transport [F4]. In addition, it covers other areas including biofuel for industry (for instance, as the fuel for boilers), export and cleaner environment as well as biofuel technologies [F4]. The policy also provides a range of objectives, from short to medium and long-term [F4]. Short-term goals include the establishment of standard specifications for this product [F4], trials with the fleets of selected government departments [F4], regular promotional awareness programs [F4] and collaboration with volunteer users [F4].
Mid-term implementation strategies add the export market to this agenda [F4]. Furthermore, engine manufacturers should be convinced to extend their warranties to cover the utilisation of the biodiesel as well [F4]. The third point would be passing legislation to mandate the use of biofuel [F4]. Ultimately, the government would encourage the private sector to found biodiesel plants [F4].
Finally, in the long run, increasing the percentage of palm biodiesel in the blend to levels higher than 5% should be pursued [F4]2. We can see the government’s serious attention to biofuel in the clearer representation from the general and vague statement quoted above from the Eighth Plan found in the Ninth Malaysian Plan [F4]:
Efforts to promote the development of biofuel using palm oil as a renewable source of energy will be undertaken during the Plan period in line with the initiative to make the country a world leader and hub for palm oil. Designated pump stations, mainly in the Klang Valley, to supply diesel blended with 5.0 per cent palm olein are expected to commence operation in 2006. For the initial phase, the blended diesel will be utilised by vehicles of selected Government agencies. Regulations for the blending of petroleum diesel and palm olein will be formulated. Efforts will also be undertaken to promote the export of palm-based diesel (Economic Planning Unit, 2006, p.408).
In August 2006, Malaysia’s and actually the world’s first palm biodiesel plant started its operations in Pasir Gudang in Johor [F1] (Abdullah et al, 2009). In the same year, the government introduced its plans for utilising Envo Diesel, initially in its own vehicles and then gradually developing its usage to the whole transport sector of the country [F4] (Lim & Teong, 2010). Unlike the conventional mixture of fossil diesel and palm oil methyl ester, Envo Diesel is comprised of palm oil itself and petroleum diesel.
As one of the interviewees pointed out, the year 2006 was the year of biodiesel “hype”. In that time, 52 biodiesel licenses with a total capacity of more than 5.26 million tonnes per year were approved [F7] (Abdullah et al, 2009). At the end of 2006, 54,981 metric tonnes of biodiesel was produced out of which 47,986 metric tonnes (more than 87%) was exported [F5] (Ministry of Plantation Industries and Commodities Malaysia, 2011). The growth in enthusiasm for biodiesel continued in 2007. By September, the number of approved licenses increased to 92 with a combined capacity of more than 10.2 million tonnes per year [F7] (Chin, 2011).
Another important event in 2007 was the enactment of the Malaysian Biofuel Industry Act 2007 (Act 666) by the Parliament of Malaysia. It provides “for the mandatory use of biofuel, licensing of activities relating to biofuel and for matters connected therewith and incidental thereto” [F4] (Act 666, p.7).
In parallel, the government continued to manifest its positive stance toward this industry. In December 2007, the Deputy Prime Minister attended the opening ceremony of the biofuel plant of Mission Biotechnologies Sdn Bhd in person. He emphasized that the government believes “the demand for biodiesel is expected to explode” and for this reason, the economy of the country is expected to grow faster [F4] (Bernama, 2007). On the whole, in 2007 biodiesel production grew more than 136% and reached 129,706 metric tonnes. The major part of this production, that is 95,013 metric tonnes (more than 73%), was exported [F5] (Ministry of Plantation Industries and Commodities Malaysia, 2011).
It should be noted that the encouraging events mentioned above were not the sole elements impacting the biofuel sector at that time. The most significant issue that cast a shadow over the future of this sector was the skyrocketing of the crude palm oil (CPO) price. While, according to Plantation Industries and Commodities Minister, the proper CPO price for the biodiesel producers should be between RM2300 and RM2600, the CPO future contracts crossed RM3000 on 26 November 2007 [F4] (Daily Express, 2007). This crucial factor made some investors suspend their plans in 2007 and later on in 2008 [F1] (Abdullah et al., 2009). In fact, since then this problem has stayed on and still is one of the main obstacles against the development of this industry [F5].
Despite this fact, the industry was still growing then, though quite slowly. By May 2008, the number of completed projects reached 14, out of which 12 were in operation with a capacity equal to one million tonnes a year [F1] (Bernama, 2008). In contrast to the considerable growth in production in 2007 (equal to 136%), the output of the biodiesel industry grew about 32% in 2008. To be more precise, 171,555 metric tonnes of biodiesel was produced and 182,108 metric tonnes was exported [F5] (Ministry of Plantation Industries and Commodities Malaysia, 2011). The fact that the exported amount is more than the production amount indicates that the difference was supplied through the inventory left from the preceding years. In other words, it depicts that the domestic consumption of biodiesel was even less than what the difference between production and export values implies.
In the same year, the government announced its interest in replacing palm oil with jatropha oil [F4] (Bernama, 2008). This could resolve the problems associated with using CPO as the raw material for producing biodiesel [F5]. However, this idea was still in an experimental nascent state [F2] and the industry players were not sure if it could boost the biofuel sector (Lim & Teong, 2010).
In that year, Kuala Lumpur City Hall (DBKL) declared that 66 of its vehicles had been using Envo Diesel for two years without any problems [F2] (The Star Online, 2008). Nevertheless, the government decided to put an end to its Envo Diesel project and replace this product with B5, a blend of 95% fossil diesel and 5% palm oil methyl ester [F4] (Ong et al, 2012). The main reason for this decision could be the different obstacles the commercialization of Envo Diesel had faced; particularly its solidification in lower temperatures and the resistance shown by the diesel engine manufacturers against it (Lim & Teong, 2010).
First of February 2009 was the date that Malaysia commenced this new B5 programme in DBKL and the armed forces [F2] (Business Times, 2009). In addition, Plantation Industries and Commodities Minister asserted that this programme will be fully implemented by early 2010 [F4] (Business Times, 2009). In comparison to 2008, biodiesel production growth slightly decreased from 32% to about 30%. Biodiesel production was equal to 222,217 metric tonnes and its export was equal to 227,457 metric tonnes [F5] (Ministry of Plantation Industries and Commodities Malaysia, 2011). Again notice that the amount exported was more than the amount produced.
In January 2010, the number of the firms in operation decreased to seven, utilising only 10% of the installed capacity [-F1] (The Star Online, 2010). Moreover, the planned implementation of the mandatory biodiesel blend programme was deferred to the next year that is 2011 [F4]. The year 2010 was the first year in which biodiesel production experienced negative growth. It was reduced more than 47% and reached 117,173 metric tonnes. Accordingly, biodiesel export decreased drastically and reached 89,609 metric tonnes [F5] (Ministry of Plantation Industries and Commodities Malaysia, 2011).
The implementation plan mentioned above actually materialized on 1 June 2011 in Putrajaya [F5]. It was extended to Malacca on 1 July, then to Negri Sembilan on 1 August and Kuala Lumpur on 6 October. Finally, on 1 November 2011, it was launched in Selangor at Caltex pump station in Taman Kinara in Puchong and it was announced that 634 pump stations in Selangor would be involved in this programme in the future [F5] (Ministry of Plantation Industries and Commodities, 2011). Although biodiesel production experienced once more positive growth of 45% in 20113 [F1], biodiesel export continued its decline and reached 49,999 metric tonnes [F5] (MPOB, 2012).
In 2012, at the time of accomplishing this management project, the biodiesel industry is not in a promising state. Most of the industry players I contacted reminded me the fact that their plants are left idle or they have already switched to making other products such as cooking oil, glycerine and so on [F1].
Before presenting the analysis of the innovation system ? the different functions of the TIS are presented again below for ease of reference.
F1 Entrepreneurial experimentation
F2 Knowledge development and diffusion
F3 Development of positive externalities
F4 Influence on the direction of search
F5 Market formation
F6 Resource mobilization
F7 Legitimation
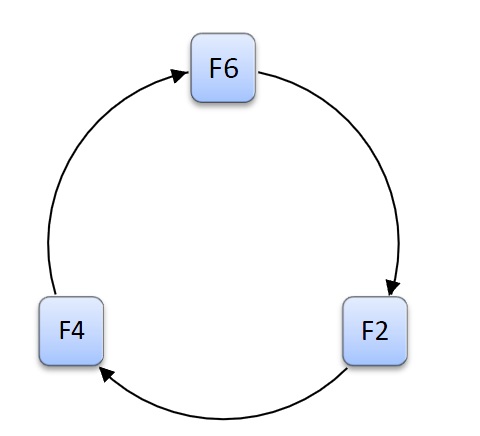
The first prominent fact about the initial phase is the absence of the majority of the necessary functions in the biofuel TIS of Malaysia during that period. As the above episode demonstrates, only three functions - F2, F4 and F6 - were fulfilled in Phase I. However, a simple virtuous cycle that was formed in the TIS prevented its total failure. This cycle emerged in the system through the interactions between these three functions (Figure 3). MPOB dedicated funds to the laboratory experiments [F6] that developed the knowledge in the system [F2]. The successful results were encouraging [F4] and guided the decision makers to invest more in the biofuel technology [F6]. As a result, more experiments in bigger scales (from lab to pilot plant) were carried out [F2]. However, due to the absence of the majority of the functions, the biodiesel technology was not commercialised yet. This happened in the next phase when the TIS became more complex.
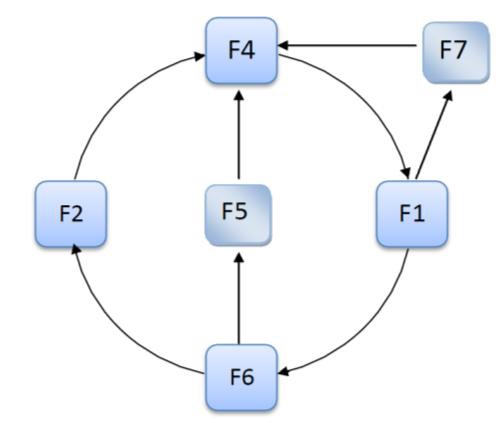
What differentiates Phase II from its preceding phase is the appearance of the events that fulfil new functions. For the first time, three new functions - F1, F5 and F7 - were present in the biofuel TIS. The reason can be partly found in the fact that the “inconsistent political support” in the first phase pointed out by Lim & Teong (2010) gave its place to a clear manifestation of the government’s attention to this industry [F4]. The most significant outcome of this turn in the government’s attitude was the huge attractiveness the biodiesel found in the eyes of investors. Accordingly, entrepreneurs joined this TIS [F1] and this industry started to enjoy a kind of legitimacy for the first time [F7]. They directed their resources to commercial projects [F6] and export markets appeared for the first time in this phase [F5]. As Figure 4 illustrates, the interactions of the functions reached a more complex status in Phase II. This level of functionality shows that F3 was fulfilled to a certain degree as well.
Nevertheless, the events that were positively contributing to the growth of the biodiesel TIS and the resulting virtuous cycles of functions were not the only observable influential phenomena in Phase II. A simple but extremely significant vicious cycle also came to the stage in this period (Figure 5).
The major event that triggered this vicious cycle was the unexpected increase in the prices of CPO and also the price reduction of crude oil [F4] (see next section). In Phase III, the implementation of RED in Europe and RFS2 in the US were added to the negative contributors to F4 (see Introduction). As a result, the above vicious circle has become so strong that at the present, the biofuel TIS severely lacks most of the functions and is extremely weak.
2 I have identified all of these objectives as examples of F4 because at that stage they were nothing but a set of plans on the paper. In this form, they could only attract supply-side actors to this TIS and by definition were examples of influence on the direction of search (Bergek et al., 2008b). There is no need to say that as actual events, they would have been associated with different functions. For example, “trials with the fleets of selected government departments” would fulfil F2 or “adding the export market” would fulfil F5.
3 The available official statistics published by Ministry of Plantation Industries and Commodities (2011) provides the data related to the biodiesel production from January to September. The reference for 45% growth (from 117,173 metric tonnes in 2010 to 170,000 metric tonnes in 2011) is The Edge (2012).
6. Analysis and Evaluation of the Malaysian Biofuel Innovation System
The functional pattern above helps us in identifying the weaknesses and the strengths of the TIS we are studying. We need to perform such an evaluation so that we can provide recommendations for improving this TIS. We start with the function that looks to be more significant than the rest here that is F4.
6.1 Influence on the Direction of Search
The event history analysis above clearly reflects the vital importance of this function in the Malaysian biofuel TIS. It is a key function in all of the virtuous cycles that made this TIS grow (Figures 3 and 4) as well as the critical vicious cycle that has led to its decline (Figure 5). There are different factors that reflect the level of this function in a TIS, like growth outlook, price incentives, regulatory pressures and articulation of demand from powerful customers (Bergek et al, 2008a). In the case of the TIS studied here the last three are more prominent:
6.1.1 Regulatory pressures: besides the inclusion of the biofuels in the Eighth and Ninth Malaysian Plans, there are exclusive regulations for them in Malaysia, namely National Biofuel Policy and the Malaysian Biofuel Industry Act (Act 666). We saw how these regulations attracted the investors into this industry in Phase II. However, the pace of the implementation of the same directives has been one of the main reasons for the decline of this industry in Phase III. As an example, the B5 programme which was commenced in 2008 was not implemented till 2011, and this is done only partially as it covers merely the central region. This repeated deferment is one of the main complaints of the biodiesel firms, emphasized in the interviews we did and also those reflected in the media (see for example, The Edge (2012)). The slow pace of implementation can have different causes but the main reason seems to be the issue of factor prices. This leads us to the next element affecting F4 that is price incentives.
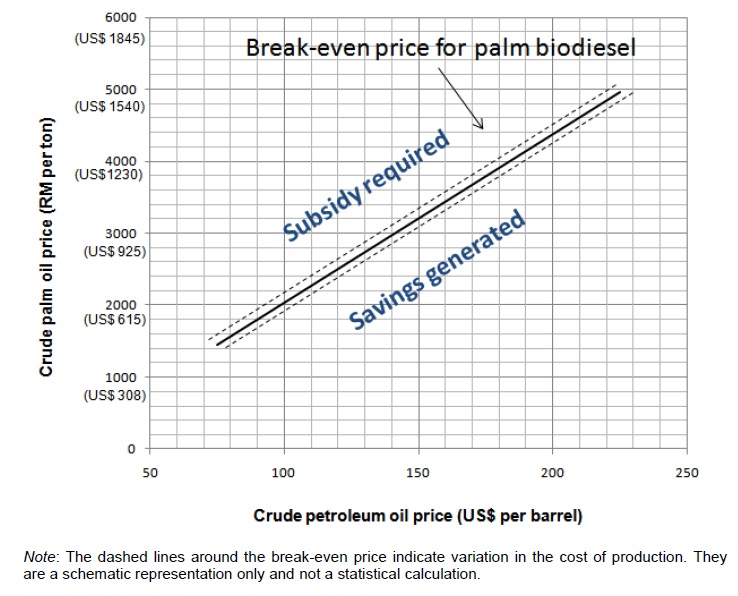
6.1.2 Price incentives: as any other goods, profitability of biodiesel depends on both its own price and the price of its substitute which is petroleum diesel. The major elements that determine the production costs of palm biodiesel and petroleum diesel are CPO and crude oil respectively (Lopez & Laan, 2008). Therefore, it is possible to estimate the break-even prices for biodiesel at different CPO and crude oil prices (Figure 6).
As the diagram above demonstrates, producing palm biodiesel makes sense economically when the crude oil price is high and the CPO price is low. Nevertheless, as the experience of the past years illustrates this is very unlikely to happen. A simple economic justification based on the very definition of substitute goods is that when the price of one of the pairs of goods that are alternative to each other increases, the demand and consequently the price of the other one goes up too (Sloman et al, 2010). When the price of crude oil goes up, petroleum diesel becomes more expensive. Hence, the demand for biodiesel increases and this will increase the price of its main raw material which in this case is CPO.
However, the situation is not as simple as this. In fact, the above argument is closely related to what comprises the heart of a crucial dispute concerning the biofuels in general, called “the food versus fuel debate”. The gist of this argument is that using edible oils in the production of biofuels leads to a supply deficit which in turn increases the prices of these major nutrients. While the underlying logic of this idea makes sense, actual data do not absolutely verify it. In the case of palm oil, Lam et al. (2009) believe that the ending stock of palm oil can be used as an indicator for assessing the sufficiency of the supply of this oil to meet the existing demand. As biodiesel production and closing stock of palm oil have both increased from 2006 to 2007, they have concluded that converting palm oil into biofuel does not cause edible oil shortage.
However, by extending their idea to the following years it can be seen that establishing a clear relation between biodiesel production and palm oil supply is not possible. Table 2 shows that from 2007 to 2008, contrary to what the food versus fuel argument dictates, these two indicators have increased in parallel. From 2008 to 2009 increase in biodiesel production is accompanied by decrease in closing stock of palm oil, this time confirming that argument. Finally, from 2009 to 2010, a considerable drop in biodiesel production (47.27%) has occurred next to a minor increase (3.42%) in the closing stock of palm oil.
[Table 2] Biodiesel production and ending stock of palm oil in Malaysia
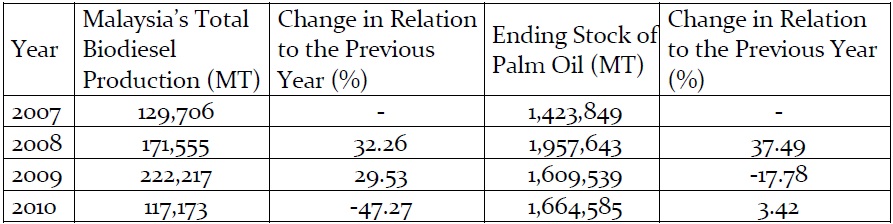
Biodiesel production and ending stock of palm oil in Malaysia
On the whole, the food versus fuel debate does not seem to resolve easily. Despite the attempts of different researchers who have tried to show that so far, biodiesel production has had no significant impact on food prices (see for example, Ajanovic (2011)), biodiesels based on edible plants have strong opponents like the International Food Policy Research Institute who can threat this industry seriously in the future (Zhou & Thomson, 2009).
6.1.3 Demand from powerful customers: this is the most important factor that contributes to F4. To use Carlsson & Jacobsson’s (1994) words, “if the users do not demand new technology, or if for some reason they are incapable of using it […] it matters little how the system is organized” (p.242).
The biodiesel industry of Malaysia clearly reflects this fact. In Phase II, the demand from such powerful customers as the United States and the EU was strongly fulfilling F4 and it resulted in the appearance of other significant functions, particularly entrepreneurial experimentation [F1] and market formation [F5]. On the other hand, as the new regulations eliminated the demand from these two customers in Phase III, the whole TIS deteriorated.
All the points mentioned above are examples of inducement or blocking mechanisms. While in the past some inducement mechanisms (like local regulations, foreign demand and so on) were influencing the biofuel TIS of Malaysia, at the present a set of blocking mechanisms (slow implementation of B5 programme, foreign regulations, high factor prices and so on) are casting dark shadows on it. It is the task of policy to remove or weaken blocking mechanisms and also add or strengthen inducement mechanisms (Bergek et al., 2008a). To achieve this objective, the main strengths of the system should be known too. The next section deals with what in our opinion is the winning card of this TIS.
6.2 Knowledge Development and Diffusion
Knowledge is one of the key concepts, or even the key concept, in the paradigm of innovation systems. As one of the forefathers of this school of thought, Lundvall (2010), has indicated, the neo-classical framework that rules over the science of economics addresses only some of the aspects of the economic system. In his view, this problem is inherent to all theories in the social sciences. These theories act like “focusing devices” that shed light solely on some aspects of the real world and make us forget the other aspects that are sometimes quite significant in their own right.
By focusing on concepts like scarcity, allocation and exchange, the neo-classical paradigm has overlooked what the founders of the innovation systems theory believe is “the most fundamental resource in the modern economy” (Lundvall, 2010, p.1) and that is nothing but knowledge. This is why for these thinkers learning is the most important process. To put it differently, the knowledge development and diffusion function lies at the heart of a TIS (Bergek et al., 2008a).
The event history analysis shows that the main contributor to the fulfilment of this function has been the government and particularly MPOB. This is not surprising as this government agency’s vision is “to become the premiere Nobel Laureate-producing research and development institution, providing leadership and impetus for the development of a highly diversified, value added, globally competitive and sustainable oil palm industry” (The official portal of MPOB). Accordingly it has set its mission as enhancing “the well-being of the Malaysian oil palm industry through research, development and excellent service” (The Official Portal of MPOB).
The relation between the public sector and development of knowledge and its diffusion has been one of the focal points of interest in the realm of innovation systems. This relation has been studied in two different ways: public sector as user of R&D (Gregersen, 2010) and public sector as producer of R&D (Freeman, 2010). The case of MPOB and biofuel technology is more related to the latter. In fact, this institute confirms Freeman’s (2010) claim that government research institutes have played a key role in the technological development of our world. MPOB shows that the government has been, and still is, “the main source of funds for fundamental research and for a significant proportion of civil applied research as well” (Freeman, 2010, p.184).
It should be noted that this function is comprised of two separate elements: development of knowledge and its diffusion. The latter is, if not more important than, as significant as the former. A classic example is Britain’s loss of technological leadership in the 1880’s and 1890’s to Germany and the United States. This happened not because scientific discoveries and innovations became rare in Britain at that time. On the contrary, scientists were quite active there, but the problem was the inability of British institutions in diffusing their innovations (Freeman, 2010).
In summary the functional analysis of the Malaysian biofuel as a technological innovation system reveal three key aspects affecting this industry ? technology related, market related and policy related. They are also categorised into ‘controllable’ and uncontrollable factors. What is interesting is that technology development is not the blocking mechanism in the industry and also this function in the TIS is under one actor ? a government research institution. The analysis seems to indicate the need for policy support, crucial ? for incentives in the industry or for developing the market (national rollout of the B5 project).
[Table 3] Mechanisms affecting the Malaysian biofuel technological innovation system
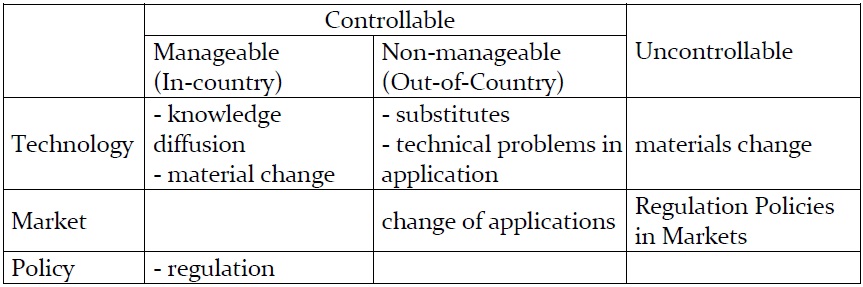
Mechanisms affecting the Malaysian biofuel technological innovation system
The functional pattern of the biodiesel TIS in Malaysia shows that knowledge development and diffusion both have been successfully fulfilled by MPOB. It carried out the critical experimental and scaling-up stages in the earlier phases of this TIS and could diffuse this technology among a number of firms as well. MPOB continues this practise today and is a leading institute in research and development activities related to biofuels. It is believed that in its efforts to remove the blocking mechanisms, a successful policy should benefit from this ability properly. Some possible ways of doing so are proposed in the next section.
The blocking mechanisms that are currently at work imply that the critical problems of biodiesel industry of Malaysia can be solved by three different strategies: 1) subsidization, 2) change of raw material, 3) change of application.
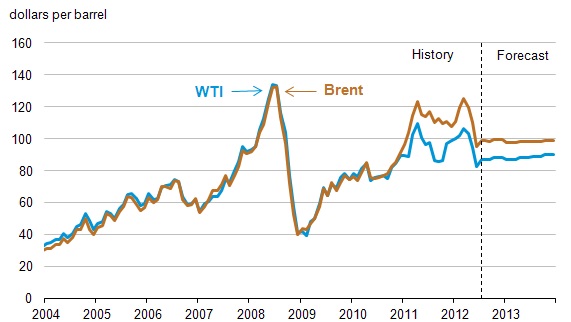
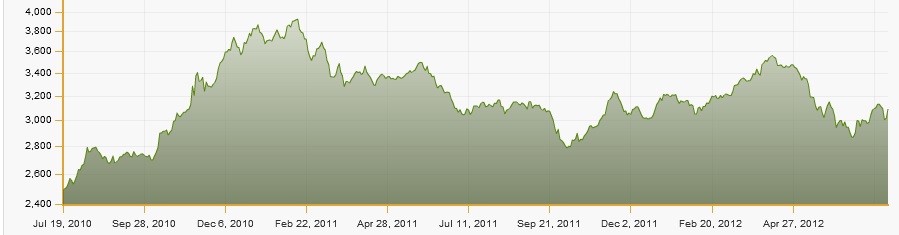
6.3.1 Subsidization: at the present, the government of Malaysia subsidizes petroleum diesel. Therefore, if subsidization is to be used for protecting biodiesel, it has to cost the government at least the same as petroleum diesel subsidization. Lopez & Laan (2008) estimate that with an average CPO price equal to RM 3000 per metric tonne, the B5 mandate would reduce subsidi-zation cost only if the crude oil price passes USD 150 per barrel. Thus, considering the present and forecasted price levels of these commodities (Figures 7 and 8), subsidizing biodiesel looks like wasting the tax payers money.
6.3.2 Change of raw material: basically, there are two types of resources that can free biodiesel from its dependence on palm oil or any other edible oil: inedible oils and waste cooking oil. An example of the former is the plant called jatropha curcas. Composition analysis of the samples of this oil seed which were cultivated in Malaysia has shown that it is suitable for biodiesel production (Akbar et al, 2009). The government of Malaysia has already expressed its interest in this resource (see the event analysis above) and at least one firm, named Biofuel Bionas Sdn. Bhd., is active in this field in Malaysia. However, it cannot be considered as a well-established technology as it still needs further investigations.
Commercializing jatropha biodiesel (which can be used purely or mixed with palm oil biodiesel (Sarin et al, 2007)) or waste cooking oil biodiesel (Zhang et al, 2003) reduces the power of suppliers (one of the Porter forces) and will weaken influential blocking mechanisms such as food versus fuel argument or edible oil price fluctuations.
6.3.3 Change of application: biodiesel is not the only application of palm oil esters. For instance, they can be used as drilling fluids (Caen & Chillingar, 1996). By adding new categories of markets, this product will be competing with substitutes other than diesel as well. This diversification of end users will reduce the pressure of the two Porter forces discussed in the Introduction, namely power of substitutes and power of buyers.
The last two solutions proposed above, change of raw materials and change of application, depend heavily on the fulfilment of knowledge develop-ment and diffusion function. Fortunately, MPOB has already proven its competence in positively contributing to this function. In other words, if this research institute starts to explore these new fields, the impact of the present crucial blocking mechanisms will decrease significantly. As a result, a situation similar to Phase II will appear in which all the functions are more or less fulfilled but this time without the vicious cycle deteriorating this TIS. As the functional approach predicts, such a TIS has a great chance of success.
After a short-lived promising start, the biodiesel industry of Malaysia is facing a crisis now. Instead of using the neo-classical approach and proposing policy interventions based on traditional market failure rationale (Bergek et al., 2008a), we chose to analyze the situation under a different framework. This paradigm, known as the functional analysis of technological innovation systems is adopted to help reveal the strengths and weaknesses of an industry in terms of its fulfilment of seven critical functions which are necessary for the generation and commercialization of a product, in other words innovation performance. Further functional analysis is done to understand the inducement and blocking mechanisms affecting the Malaysian biofuel TIS, the more knowledge is revealed to improve poor functionality through enforcing/ creating inducement mechanisms and weakening/omitting blocking mechanisms. Our analysis shows that different blocking mechanisms have created a fragile functional pattern in the biodiesel TIS of Malaysia. However, the very same functional pattern opens new ways for the future. The following table summarises the discussion so far.
This TIS has been particularly useful in performing the function of knowledge development and diffusion. Relying on this strength and focusing on raw material change or application change will weaken the important blocking mechanisms that are hampering its development. This will enable the biofuel TIS to achieve proper functionality and save the huge investments that have been dedicated to this industry.
The paper contributes in that it adopts a framework (Functional Analysis) developed in the developed country context for analysing the biofuel sector as a technological system in an emerging economy i.e. Malaysia. It has been possible to see the role of actors and functional aspects in the development of the industry. The study shows the inter-relatedness of different functions of a Technology Innovation System in an emerging economy. The findings show several ‘controllable’ and ‘uncontrollable’ factors that affect the industry and there is a great role that the government can play in terms of developing policy to review or support the development of this industry.
The study helps to identify or even highlight the role of government related actors and policy at two important faces of the development of the technological innovation system in an emerging economy like Malaysia ? firstly in the critical role of government actors in F1 Entrepreneurial experimentation and also F2 Knowledge development and diffusion. The government research institution is a key in developing the technology and policy for resource mobilisation to support the development of the industry. The role of the government is also crucial as an agent to help in “legitimisation” [F7]. While the private sector or the entrepreneurs are the actors that are in between the knowledge creation agents and the market ? they are not able to have a strong role in market formation or creation in this arena. The role of the government in terms of policy is crucial for “market formation. This is evident in terms of the implementation of the B5 programme (B5 stands for the % of palm methyl ester in the fuel) in some parts of the country to help in the development of this innovation, which is not being considered for expansion around the country.
The study also shows different innovation system dynamics and different functional aspects at play in different phases of the TIS i.e. such as the changing importance of different elements of innovation systems in different phases of industry development. One might even argue for a need for combining industry life cycles / product-technology life cycles with innovation systems. Finally, we do acknowledge that this study is in the context of biofuel in an emerging economy like Malaysia. Studies need to be conducted to see some patterns in functions and their influences across industries for more generalisability.