This paper proposes a method for identification of harmful video images based on the degree of harmfulness in the video content. To extract harmful candidate frames from the video effectively, we used a video color extraction method applying a projection map. The procedure for identifying the harmful video has five steps, first, extract the I-frames from the video and map them onto projection map. Next, calculate the similarity and select the potentially harmful, then identify the harmful images by comparing the similarity measurement value. The method estimates similarity between the extracted frames and normative images using the critical value of the projection map. Based on our experimental test, we propose how the harmful candidate frames are extracted and compared with normative images. The various experimental data proved that the image identification method based on the 2-dimensional projection map is superior to using the color histogram technique in harmful image detection performance.
How to block objectionable images on the Internet that have adverse effects on people is a major problem. Many approaches to solving the problem have been developed [1]. However, most of them are unrealistic to apply to a large volume of unstructured video images. Most research has been limited to video clips [2].
Early studies used text processing technology, followed by image and video processing technology later in accordance with the development of the Internet [3,4]. It is expected that multimodal technology using multimedia information such as texts and images [5] will be developed in the future.
The existing systems discriminate between harmful and non-harmful images through the input of the still image value. In order to apply the existing discrimination system to the videos, the system would need to process 30 frames per second in consecutive order, which is not possible within its limitations. Since videos contain a huge amount of information, extensive processing time and memory spaces are needed to identify harmful videos [6,7].
Though there are small differences depending on the structure of the video, if the harmful videos are evaluated by the existing representative frame selection method [8-10]. Because the method determines the harmfulness by comparing all of the frames of the video clip to each other, it requires a great deal of time and massive memory.
Therefore, it is clear that the frame selection method of existing discrimination systems is not effective. In this study, potentially harmful frames are selected using a new color characterization method, a projection map [11], which is a technique for the extraction of video color characteristics instead of using a color histogram to analyze the color characteristics [12].
Frames will be classified as containing harmful images if they meet the criteria of harmfulness after comparing the measurement of the similarity with the standard images, and if they do not meet the criteria, they will be classified as containing harmless images.
In this study, a harmful image discrimination method and system will be proposed in which the similarity of harmful images are compared to standard harmful images.
II. TECHNIQUES FOR IDENTIFYING OBJECTIONABLE IMAGES
There are many objectionable images discrimination techniques that can determine harmfulness by using the image characteristics extracted from the harmful image extraction technique as the input value. The objectionable information discrimination technology was developed from text processing technology and now is being developed as image and video processing technology, and it is expected to be developed into multimodal discrimination technology [5] in the future.
III. RESEARCH MODEL AND DISCRIMINATION TECHNIQUE
>
A. Featuring the Target System and Its Harmfulness Discrimination Model
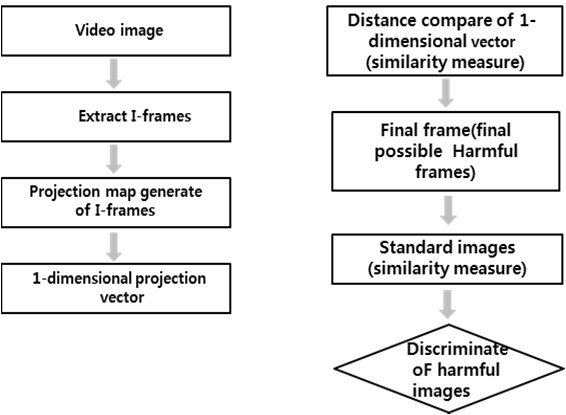
The representative frames from the I-frame that is to be used as the input value for the harmfulness discrimination will be selected as the potentially objectionable frames. The I-frame is used as the representative one because it will be used as the input value for the harmfulness. We use it as space compression instead of temporal compression. Also, the I-frame contains image information that can minimize calculation, a random approach is possible. Fig. 1 is a model procedure for analyzing the harmfulness of video.
The procedure for identifying the degree of harmfulness of video, first, extract the I-frames from the video and map them onto the 3-dimensional (3D) space, and then convert them to a 2D projection map. Change them to a 1D vector to calculate the similarity of the converted projection map. Next, select the potentially harmful frames in order from the greatest similarity. Finally, identify the harmful images by
comparing the similarity measurement value with the standard harmful image values.
1) Extracting the Possible Primary Frames (I-Frames)
The first step for identifying the harmful frames in the video is the selection of the potentially harmful frames. Normal videos consisted of 3 kinds of frames (I, B, and P). The primary possible I-frames can be extracted by parsing the group of pictures (GOP) of the Moving Picture Experts Group (MPEG) stream. This is because I-frames, unlike the other types, can contain individual unit images.
Step 1: Descramble the I-frames by parsing the GOP of the MPEG stream. Store the I-frames in unit space and the primary possible frames become the secondary possible frames. The extracted primary possible frames are classified as harmful or harmless images. Next, perform the color histogram and 2D projection map generation process to select the secondary possible frames from the extracted primary possible frames. The secondary possible frames will be determined by comparing the similarity between the generated histogram and projection map.
Step 2: Generate the histogram and projection map from the primary possible frames.
Step 3: Calculate the similarity from the I-frames and extract the final possible harmful frames.
Step 4: Discriminate the harmfulness by comparing the similarity between the standard images and the final possible harmful frames.
2) Harmfulness Discrimination Technique
Measure the similarity between the frames of the I-frames after extracting the I-frames from the video. Designate the first I-frame as the standard frame and then calculate the similarity of the next frames. If it does not meet the threshold, that is, if there is no similarity between the first frame and the frame compared to it, the first frame will become the final possible frame and designate the first frame as the standard frame and repeat the same procedure. Designate the representative frame finally generated as the possible harmful frame and generate the 2D projection map for the possible harmful frame.
During this process, in order to generate the 2D projection map, map the finally generated frames on the 3D space and convert the color information to a 2D projection map. Since the 2D projection map includes the distribution and the location information of the colors, the harmful images that contain the part of the images with changing characteristics can be determined as similar frames. Therefore, the 2D projection map will be selected as containing the possible harmful images by converting it to a 1D binary vector.
The frames will be identified as harmful images if they meet the harmfulness criteria by comparing the measurement of the similarity with the standard images, and if they do not meet the criteria, they will be identified as harmless images.
>
B. Similarity Measuring Algorithm
1) Generation of the 1D Vector
In order to convert the 2D projection map to the final characteristic information, generate the binary matrix by nominating 1 for the case in which there are colors within the 2D map as in formula (1) and nominate 0 for the case in which there is no color.
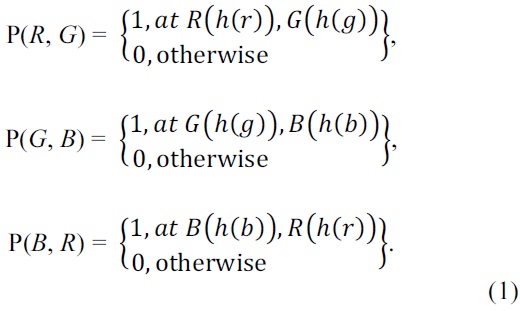
Though all of the colors within the 2D map have a brightness, in order to obtain the location information and to convert them to 1D vectors, only the colors that have a brightness of 1?255 were deemed to have color information. This range can be determined properly according to the test or application area. For instance, since the entire frames of natural sunset images will include reddish colors, brightness of 128?255 can be expected as the recognizable value of the color information. This converted binary matrix information will be converted to 1D binary vector against as shown in formula (2) to calculate the similarity more easily.
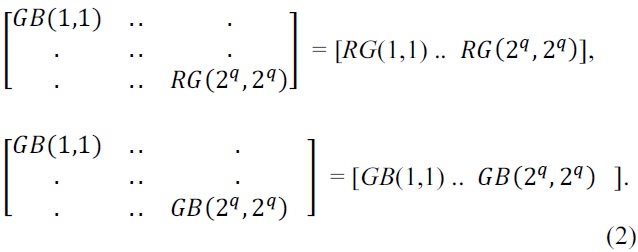
The 1D projection vectors formed by connecting the 1D binary vectors are shown as formula (3). The I is the 1D projection vector.
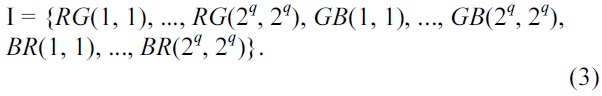
The number of bins of the 1D projection vector can be obtained from the formula (4).

N2dm is the number of bins of the 1D projection vector and q is the bit number of quantization per cell. If q = 5, the total number of bins generated from the 1D projection vector would be 3,072 (i.e., 25 × 25 × 3). This shows that the processing speed can be approx 10.7 (i.e., 32,768/3,072) times improved over a RGB color histogram for 5-bit quantization cases.
2) Selection of Secondary Possible Frame Using a Projection Map
In order to select the secondary possible frames using 1D vector information, the similarity needs to be compared. The similarity can be measured using a distance calculation formula (5).
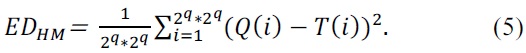
2 is each projection vector of the number of bins.
Q(i) is initial images of the no. of bin numbers.
T(i) is afterward image of the no. of bin numbers.
It measures the similarity of possible primary frames against the initial one and if it is within the threshold, they will be deemed as similar frames, but excluded from the possible secondary frames if they are above the threshold. The frames that are out of range will be deemed as different from the selected frame and selected as possible secondary frames.
>
C. Discrimination and Analysis of Harmful Images
1) Measurement and Analysis with the Standard Harmful Images.
In this study, nude images with a great deal of skin exposure are used as the standard images. Harmfulness can differ by the standard of the images, and in this research, video frames containing generally objectionable images were selected as the standard ones.
Step 1: In order to identify the harmful images from among potentially harmful frames, select 5 potentially harmful images using projection mapping. Select the potentially harmful frames using a projection map with the color space characteristics extraction technique of learning-based discrimination technology. Next identify the harmful frames after measuring the similarity between the selected possible harmful frames and standard images.
Step 2: Measure the similarity by calculating the distance between standard images and possible harmful frames.
2) Discrimination of Harmful Images
In order to identify the harmful images, obtain the threshold by measuring the similarity between the standard images and potentially harmful frames. If the video has closer similarity to the standard images and has continuity, it will be identified as a harmful video. In order to set up a similarity threshold between the standard images and possible harmful frames, 50 harmful and 50 harmless frames were extracted from 10 videos, and a threshold that is close to similarity was set up as 0.80000 (critical value) and higher through the tested data. If 0.80000 and higher frames are shown more than 5 times successively, it will be identified as a harmful video that has close similarity to the standard images.
>
A. Test Environment and Implementation
The computer used for the test had a 2.0 GHz dual core CPU, 1 GB RAM, and 160 GB HDD and the OS was Windows XP. We used JavaScript to implement the test system (prototype). The system includes the algorithms to analyze the image characteristics such as color histogram, 3D space map, 2D projection map, 1D projection vector, etc.
>
B. Extraction of Standard Harmful Images and Potentially Harmful Images
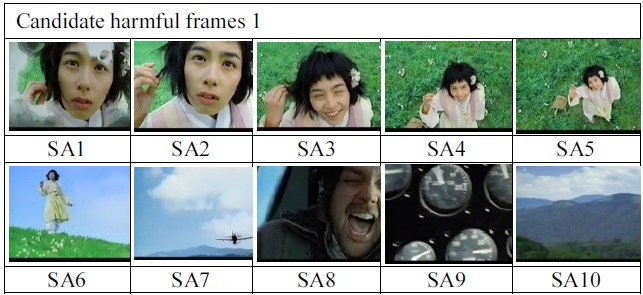
In order to analyze and determine the harmfulness of videos, the potentially harmful frames were extracted from 5 harmful and 5 harmless videos. As described in the previous section, 10 possible frames were extracted from each video clip using the color space characteristics extraction technique, and a projection map, which showed better similarity than a color histogram. Also, in order to identify the harmfulness of potentially harmful frames, 5 frames from the standard images were selected.
>
C. Measurement and Analysis of Similarity
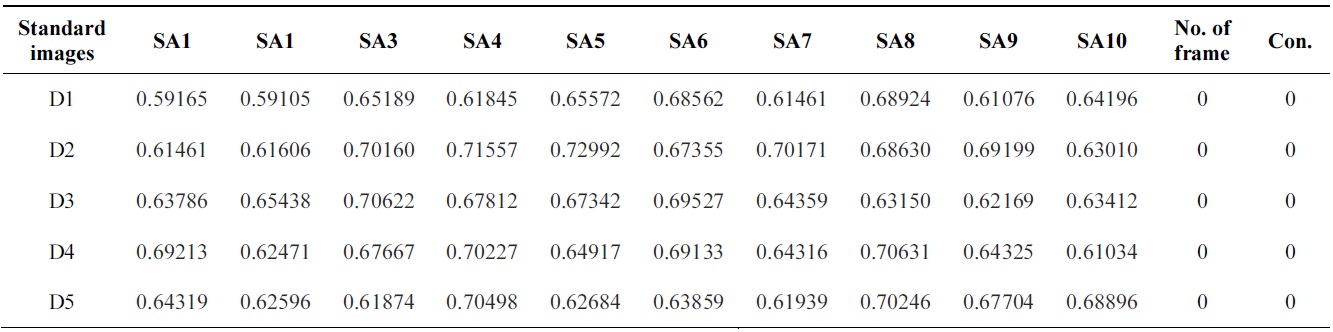
First, we calculated the similarity between the standard images and each of the extracted potentially harmful and harmless frames (Fig. 2). Next, we set the value of the standard image as 1 and measured the similarity of the comparison frames. We could identify the harmful frames by determining the number of possible harmful frames that exceeded the threshold and the continuity of the possible harmful frames that had close similarity to the standard images.
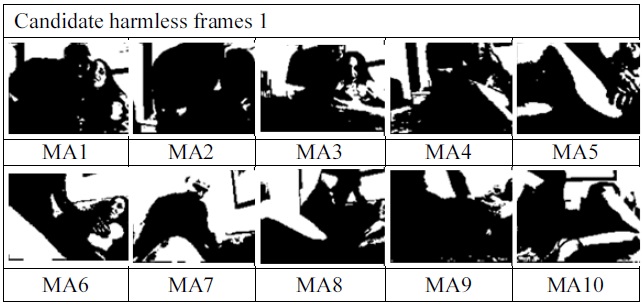
Test data in Tables 1 and 2 shows the result of the measurement and analysis of the harmful (1?5) and harmless (6? 10) frames (Fig. 3).
[Table 1.] The similarity values of candidate harmful video image frame no. 1
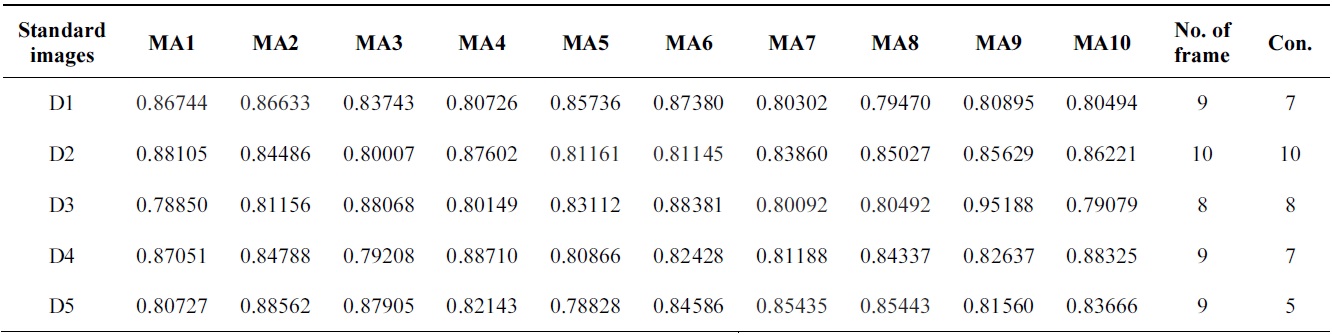
The similarity values of candidate harmful video image frame no. 1
[Table 2.] The similarity values of candidate harmful video image frame no. 6

The similarity values of candidate harmful video image frame no. 6
>
D. Discrimination of Harmfulness of Video
The Euclidean distance, i.e. degree of difference between potentially harmful and harmless images was calculated by measuring the similarity. Based on the comparison with the threshold value (critical value), the result of analysis of the continuity and number of the possible harmful frames among all of the frames are classified as harmful and harmless images. As we can see from the test, the projection map showed better test results than the color histogram, and the harmful images also showed a much higher similarity than harmless images, which made it possible to discriminate the harmful images more easily. The video will be identified as harmful if the measured similarity value of a frame is higher than 0.80000 and continues for more than 5 frames.
The results were classified as either harmful or harmless images. Harmful images may be identified as harmless and vice versa, but this can be varied depending on the threshold and weight.
Table 3 shows the discrimination result in which most of the harmful frames show similarity values of 0.80000 or higher, which are higher than the threshold and they have more than 7 frames of continuity. All of the harmless frames show similarity values lower than 0.80000, which is less than the threshold, which means they are harmless images.
[Table 3.] The result values of discrimination of harmful/harmless video clips
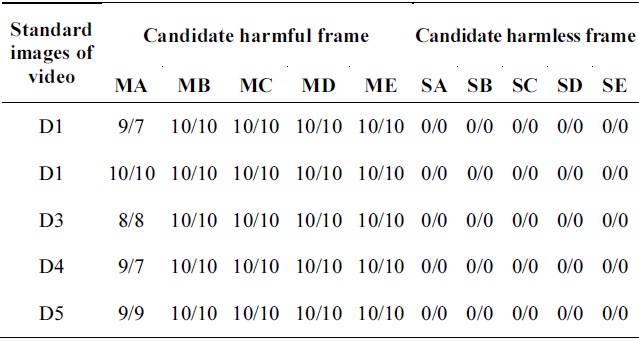
The result values of discrimination of harmful/harmless video clips
The system and model for discriminating video harmfulness proposed in this paper selects potentially harmful images and measures the similarity between potentially harmful frames and standard harmful images. This paper shows that the similarity measurement technique using projection mapping can improve the speed of color information calculation compared to using a color histogram. Moreover, since it discriminates among similar images more effectively when selecting potentially harmful frames, frame optimization could be accomplished more easily. While a histogram expresses the color characteristics with frequency only, projection mapping has characteristics that express not only the frequencies but also the location information of the colors. Because of this, it shows excellent performance in measuring the similarity when selecting the representative frames of video.
From the test, in this paper, each of the possible harmful and harmless frames was extracted from the harmful and harmless images and they were evaluated by measuring their similarity to the standard harmful images. As we can see from the results of the test, most harmful frames are identified as harmful images and harmless frames are identified as harmless images. Table 1 shows the test results of potentially harmful frame 1. Note that although it was identified as a harmful image, some of the similarity measurement values were less than 0.80000 and also had lower continuity. In this case, reddish colors existed in the corresponding harmful images but the potentially harmful frame 1 includes a little bit of the color black as well. Therefore, in order to increase the video harmfulness discrimination performance, optimization techniques would be required by adjusting the weight depending on the threshold and frame using the test data of many videos.