Infrared focal plane array (IRFPA) technology has recently undergone significant progress. However, the non-uniform response of IRFPA remains a serious issue as it significantly reduces the quality of acquired images and degrades the temperature resolvability of the imaging system. Thus, non-uniformity correction technology is a necessary preprocess in infrared imagery [1-3]. Moreover, external conditions such as surrounding temperature and variation in transistor bias voltage cause the spatial non-uniformity to drift slowly in time, thus requiring repeated compensation for the nonuniformity during sensor operation. Two kinds of non-uniformity correction (NUC) are traditionally used for infrared imaging: the calibration-based correction and scene-based correction methods. The calibration-based NUC includes the one-, two-, and multi-point methods. Although simple and convenient, the calibration effect is ineffective in complicated applications, such as cases with a large dynamic range of target radiation. Meanwhile, such calibration has to be repeated once surroundings change or when surrounding stability problems arise [2]. Compared with the calibration-based correction technique, the scene-based NUC technique does not require a blackbody radiation source for calibration. The estimated parameters of calibration are updated in concurrence with the imaging process. These NUCs adapt the slow characteristic drift of the detector over a period of time. However, these algorithms require the movement of the scene. Given that complex calculation is a significant load, new algorithms need to be developed to improve efficiency and to meet the demand for further high-speed treatment [4]. The binary nonlinearity non-uniformity model, which considers both the environmental radiation influence on the signal output of IRFPA and the nonlinearity of a large dynamic range of radiation temperature, is introduced in this study. According to this theoretical model, a novel NUC algorithm based on surrounding temperature compensation was proposed. The correction quality is evaluated both through qualitative and quantitative methods. The correction performance of the proposed technique is compared with that of conventional NUC methods.
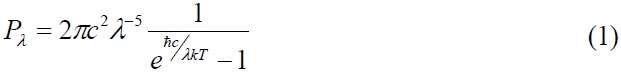
According to Planck’ law, infrared radiation power is expressed as a function of temperature
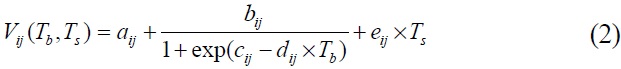
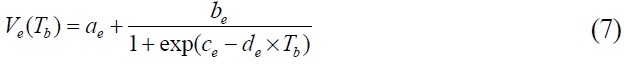
Based on this theory, the binary nonlinear non-uniformity model proposes that the response signal of the IRFPA detector is a binary function of target infrared radiation temperature
where
Based on the foregoing theoretical model, IRFPA is mainly affected by two factors: target radiation and surrounding radiation temperature. Thus, target radiation and environmental influence must be considered and corrected to improve the correction accuracy and extend the application range of the NUC algorithm.
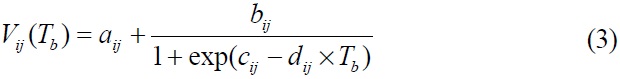
Assuming that the surrounding temperature
where coefficient (
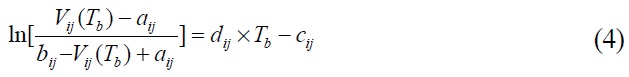

Equation (4) is simplified to a linearity function:

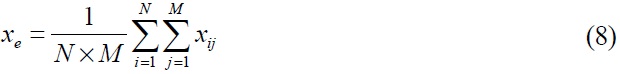
By measuring the voltage
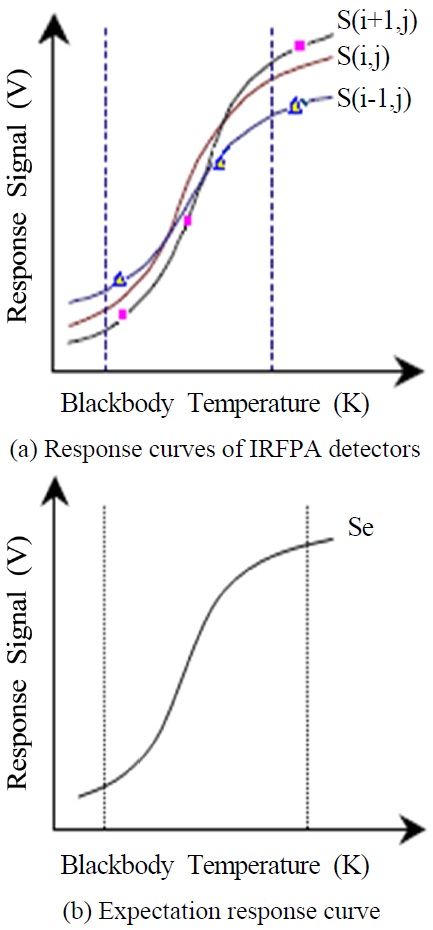
Figure 1(a) shows that the response curves
The nonlinearity coefficient (
where
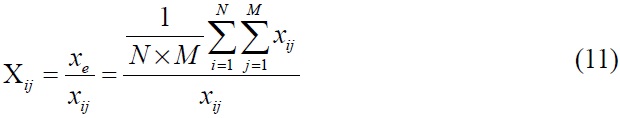
The mapping relationship between original pixel response curves

where

is the correction coefficient matrix vector.

By solving equations (8), (9), and (10), the non-uniformity correction coefficient matrix (
where
The foregoing non-uniformity coefficient matrixes (
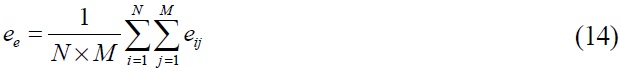
Assuming that target radiation temperature remains constant, the effect of ambient radiation is considered in this section. According to the binary nonlinear model, the effect of environment radiation on the non-uniform response is expressed as Equation (12).

where non-uniformity coefficient matrix

where
A mapping relationship between actual non-uniformity and the uniformity expectation responsive curve

where

is the compensation coefficient matrix vector. The compensation coefficient matrix
where coefficient matrix
In summary, non-uniformity correction based on surrounding temperature compensation comprises seven procedures. The foregoing six procedures are focused on calibration and coefficient calculation. Despite the numerous calculation loads, these procedures do not require prolonged correction time because they are processed offline before the correction. After calibration and calculation, the non-uniformity correction coefficients (
III. EXPERIMENT RESULTS AND ANALYSIS
The performance of the proposed approach was studied using real infrared imagery. Image quality correction and correction accuracy were evaluated and compared with those of the traditional correction method. The data were collected from two different cameras. The first camera was a 320×240 long-wave infrared uncooled microbolometer detector (UL 01 01 1, ULIS). The device was sensitive to radiation within an 8 μm to 14 μm spectral region. The second camera was a medium-wave infrared Cadmium Mercury Telluride cooled detector with 640×512 format (E3701 Hawk, SELEX) which was sensitive to radiation within the 3.7 μm to 4.95 μm spectral range. The data on these two cameras were digitized to 14-bit.
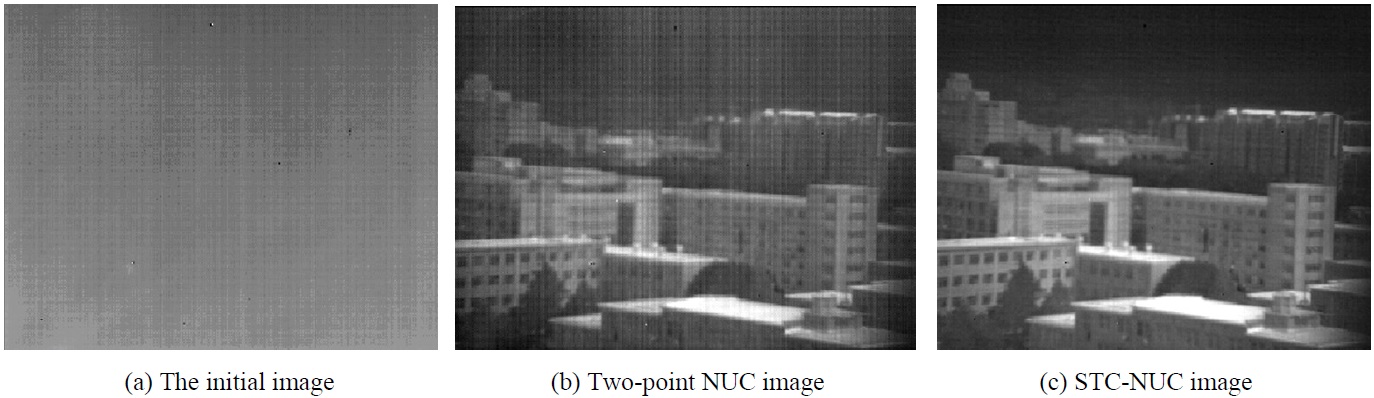
Imaging qualitative evaluation was first performed. Infrared imagery was corrected through two-point correction (TPC) and the proposed surrounding temperature compensation non-uniformity correction (STC-NUC). The captured image framed by the first camera is shown in Fig. 2(a), (b), and (c). Fig. 2(a) shows the initial image without non-uniformity correction. Fig. 2(b) shows the TPC image with outdoor correction under an environmental temperature of 308 K. The two calibration points were 288 and 338 K. Correction
coefficients were obtained at 296 K under lab environmental conditions. The severe non-uniformity of raw data was evidently eliminated by TPC, as shown in Fig. 2(b). However, stripe non-uniformity remained in the image because the correction coefficients used were obtained from an ambient temperature different from the environment. The quality of the corrected image was degraded by these remaining stripes. Fig. 2(c) shows an outdoor imaging result of STC-NUC. The image quality in Fig. 2(c) is clearer and better than that of Fig. 2(b) because of stripe elimination.
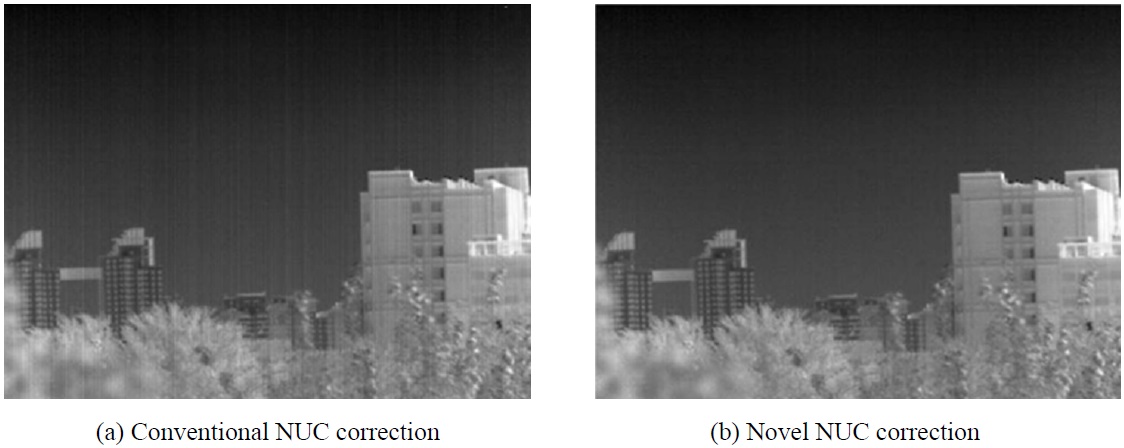
Qualitative evaluation and comparison were applied to a different scene and sensor (640×512). The results of the second camera are shown in Fig. 3(a) and (b). Fig. 3(b) indicates that the novel correction is better than the conventional NUC correction shown in Fig. 3(a). In conclusion, the conventional NUC is unsuitable for a varied environmental situation. This drawback limits its application field to a stable environment temperature condition. However, the STC-NUC is adapted for surrounding temperature variation.
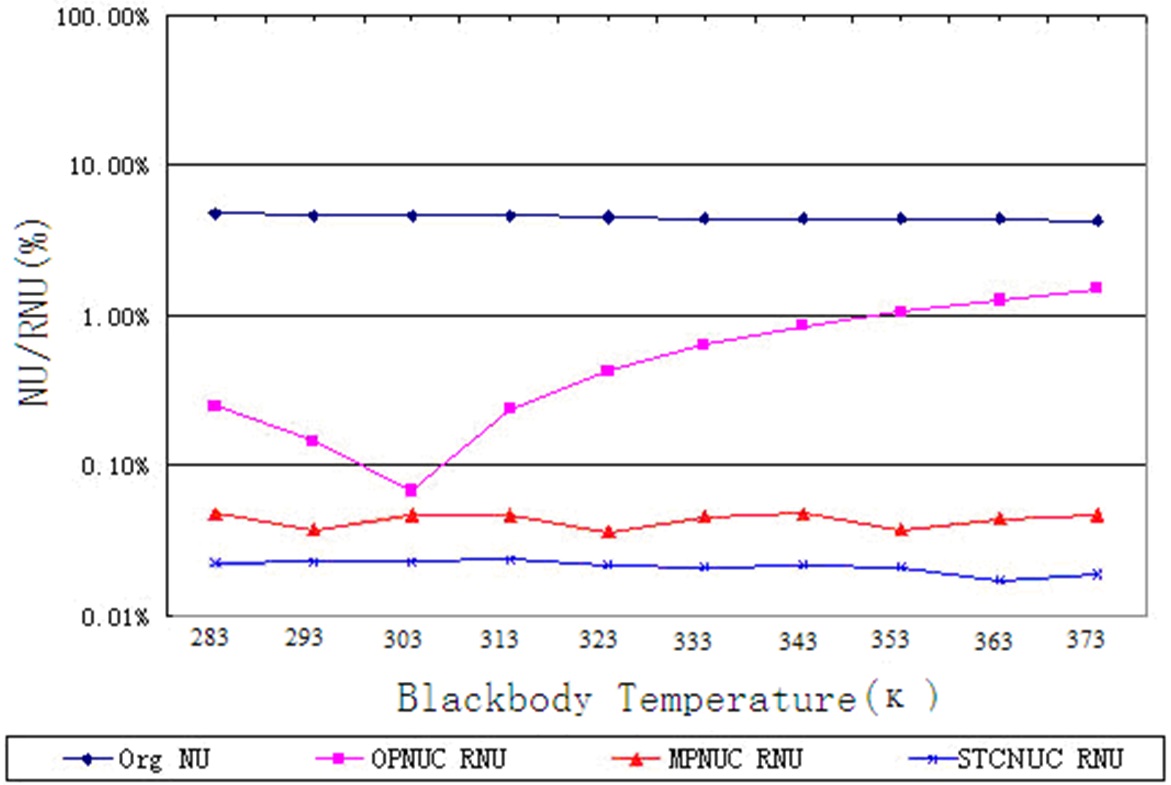
Quantitative evaluation of STC-NUC was also performed. The NUC quality was characterized in terms of residual non-uniformity (RNU) magnitude. The RNU of the first camera was measured by the infrared imagery test system called METS-11300. The original infrared image non-uniformity, one-point non-uniformity correction (OP-NUC) infrared image RNU, multipoint non-uniformity correction (MP-NUC) infrared image RNU, and STC-NUC infrared image RNU were measured and compared. The calibration point of OP-NUC was 303 K. The calibration points of MP-NUC were 293, 323, and 353 K. The test target for this experiment was uniformity extended blackbody. The experimental environment temperature was 296 K. The extended blackbody temperature ranged from 283 K to 373 K, with each 10 K as a test point. For the direct comparison of the three approaches, their test data are illustrated in a trend chart shown in Fig. 4. The y-axis of this figure is a logarithm coordinate.
The test results show that multipoint correction accuracy is higher than one-point correction. The average RNU of OP-NUC was ten times higher than that of MP-NUC. However, the correction accuracy of STC-NUC was better than both OP-NUC and MP-NUC. The RNU of STP-NUC was only half of MP-NUC. Although the RNU of OP-NUC kept low within a narrow range neighboring the calibration point, it is widely used for normal application since this correction method is simple and convenient. This method stores one coefficient matrix in imagery memory. MP-NUC possesses high correction accuracy. Furthermore, this method is suitable for a wide range of dynamic target temperature. However, three-point correction, which is the simplest method, needs to store five correction coefficient matrixes. This method requires more hardware resources, and needs complicated calculation during the correction. Moreover, MP-NUC, same as OP-NUC, is unsuitable for application in a varying surrounding temperature. The correction coefficients need to be frequently updated along with ambient temperature variation. STC-NUC is suitable for a wide range of dynamic target temperature and varying environment temperature situations. Moreover, the correction accuracy of STC-NUC is higher than that of the traditional algorithms even though the calculation procedure of the correction coefficients is complex. The lowest RNU corrected by STC-NUC in this experimental test is 0.017 percentage points. The RNU corrected by the proposed method is steady approximately 0.02 percentage points within the target temperature range of 283 K to 373 K. This RNU level is better than the 0.04 percentage point level of the same type of detector reported in the most recent literature [7,8].
Figure 4 shows that the RNU trend chart of OP-NUC presents a “V” shape curve, while the infrared imagery tested with different temperature extended blackbody. The lowest RNU value presents at the 303 K calibration point. The difference of the target temperature from the calibration point corresponds to higher RNU value, which shows that the correction accuracy lowers down when the target temperature moves farther from the calibration point. MP-NUC shows the same situation. The lowest RNU values present at the three calibration points of 293 K, 323 K, and 353 K. RNU goes up when the target temperature moves farther from the calibration point. Considering gain correction, the RNU fluctuation of MP-NUC is smoother than that of OP-NUC. The RNU trend chart of MP-NUC shows a “W” shaped curve. These experimental results of OP-NUC and MP-NUC are consistent with the theory analysis results reported by Abraham F., Isaac G., E.Gurevich, and A.Fein [8]. Moreover, STC-NUC possesses the lowest RNU among these three approaches. The RNU trend chart of STC-NUC is constantly stable and smooth in the test temperature range. The correction accuracy does not change along with the target temperature fluctuation. Considering surrounding temperature compensation, STC-NUC does not need to update the correction coefficient in an unstable environment. Hence, the proposed STC-NUC is an effective approach that meets the relatively wide target temperature range and surrounding variation application situation. The correction accuracy is stable even when the target and environment temperature change.
A novel NUC approach was proposed in this study. The method is not only suitable for the nonlinear condition of IRFPA response, but also compensates for the shift of non-uniformity with surrounding temperature variation. This approach solved the problem of degradation of corrected image quality along with the surrounding variation. Experimental results and evaluation show that the RNU, which was corrected by the proposed method, is steady at approximately 0.02 percentage points within the target temperature range of 283 K to 373 K. The experimental results are consistent with theoretical analysis. This proposed technique improves correction accuracy and infrared imaging quality better than the traditional techniques. Consequently, this technique is applied and employed in a wider application field and environment. However, the temperature range test is limited by the extended blackbody used in this study.