We present a comparative experimental analysis of the thermal spectroscopic characteristics of a phosphosilicate (P)-based ytterbium-doped fiber (YDF) against an aluminosilicate (Al)-based YDF in the temperature range of 25 to 150℃. We also characterize the fibers as gain media in a cladding-pumped amplifier configuration. While both fibers exhibit comparable trends in their thermal characteristics, there are noticeable distinctions in the fluorescence lifetime reduction rate and the spectral dependence of the transition cross-sections. The P- and Al-based YDFs present thermal lifetime reduction rates of 0.012%/℃ and 0.026%/℃, respectively. In particular, in the spectral region at ~940 nm, the absorption cross-section of the P-based YDF undergoes significantly less thermal change compared to that of the Al-YDF. In the cladding-pumped amplifier configuration operating at a total gain of 10 dB, the Al-based YDF generally performs betters than the P-based YDF in the temperature range of 25 to 75℃. However, it is highlighted that in the high temperature range of over 75℃, the latter shows a less gain reduction rate than the former, thereby yielding higher relative output power by 3.3% for a 1060-nm signal, for example.
Ytterbium (Yb) has been an outstanding choice as a doping material for rare-earth-doped fibers because of its exceptional spectroscopic properties, such as simple electronic states and small quantum defect, which in fact facilitate the power extraction from the gain medium with high efficiency [1-3]. However, thermal aspects with Yb-doped fibers (YDFs) cannot be simply overlooked if they operate in highpower regimes because their thermal properties are invariably linked to their long-term reliability as well as their overall efficiency [4-11]. For example, the efficiency of an YDF as a gain medium is dependent on the spectroscopy of Yb3+ ions that changes with temperature [5-7], and, in particular, photo-darkening (PD) effects are significantly affected with temperature [8-11]. Consequently, thermal characteristics, together with nonlinear scattering characteristics, can eventually be limiting factors to the performance of an YDF [12-13]. Thus, they have been intensively investigated from various prospects [4-11]. However, most of the related results have been limited to aluminosilicate (Al)-based YDFs [6,7] since they have predominantly been utilized in many high-power applications [1-3]. One of the reasons must be that they present higher transition cross-sections around the 1-μm region compared to those of YDFs based on other host materials like phosphosilicate [14-16] as well as offering relatively low refractive core indices [1]. However, a main problem with Al-based YDFs is their vulnerability to PD [8-11,16-18], particularly in fibers of high doping concentrations of Yb3+ ions [18]. Therefore, other types of YDFs have been considered as a replacement for Al-based YDFs [15,19,20]. Among the alternatives, phosphosilicate (P)-based YDFs have received a lot of attention since they can offer a superior property to Al-based YDFs in terms of PD resilience [19,21]. Although there were some reports limited to the general spectroscopic characteristics of P-based YDFs [14,16], to the best of our knowledge, there has been no detailed report on their thermal characteristics as gain fibers in high-power regimes. Here, building on our previous investigations [7], we present a comprehensive, comparative experimental analysis on the thermal characteristics of a P-based YDF against an Al-based YDF, including their spectroscopic properties, Stark energy levels, and gain characteristics in a cladding-pumped amplifier configuration. Finally, we discuss all the distinctive thermal characteristics between them.
In addition to the Al-based YDF (YDF2/Al) previously studied in Ref. 7, a P-based YDF (YDF1/P) was newly fabricated by the modified chemical-vapor deposition and solution doping technique. Its core had a diameter of 6.1 μm and a numerical aperture (NA) of 0.14. Its inner cladding was square-shaped with a side of ~130 μm and had a claddingabsorption rate of ~1.8 dB/m at 974 nm. YDF2/Al had a core diameter of 6.6 μm with an NA of 0.12. Its inner cladding was hexagon-shaped with a diagonal of ~130 μm and had a cladding absorption rate of ~2.4 dB/m at 976 nm. In both fibers the inner cladding NA was higher than 0.45. In addition, it should be noted that all the experimental measurements were done based on the methods and procedures introduced in our previous study unless stated otherwise (see Ref. 7 for details). We used a temperaturecontrolled oven to vary the fiber temperature from 25℃ to 150℃. It is noteworthy that the maximum temperature was limited by the thermal damage of the outer cladding material of the fiber that was made of low-index polymer [12].
Apart from other commonly used rare-earth ions, such as erbium (Er3+), neodymium (Nd3+), and thulium (Tm3+) ions, the energy-level structure of Yb3+ ions has only two manifolds, the ground state 2
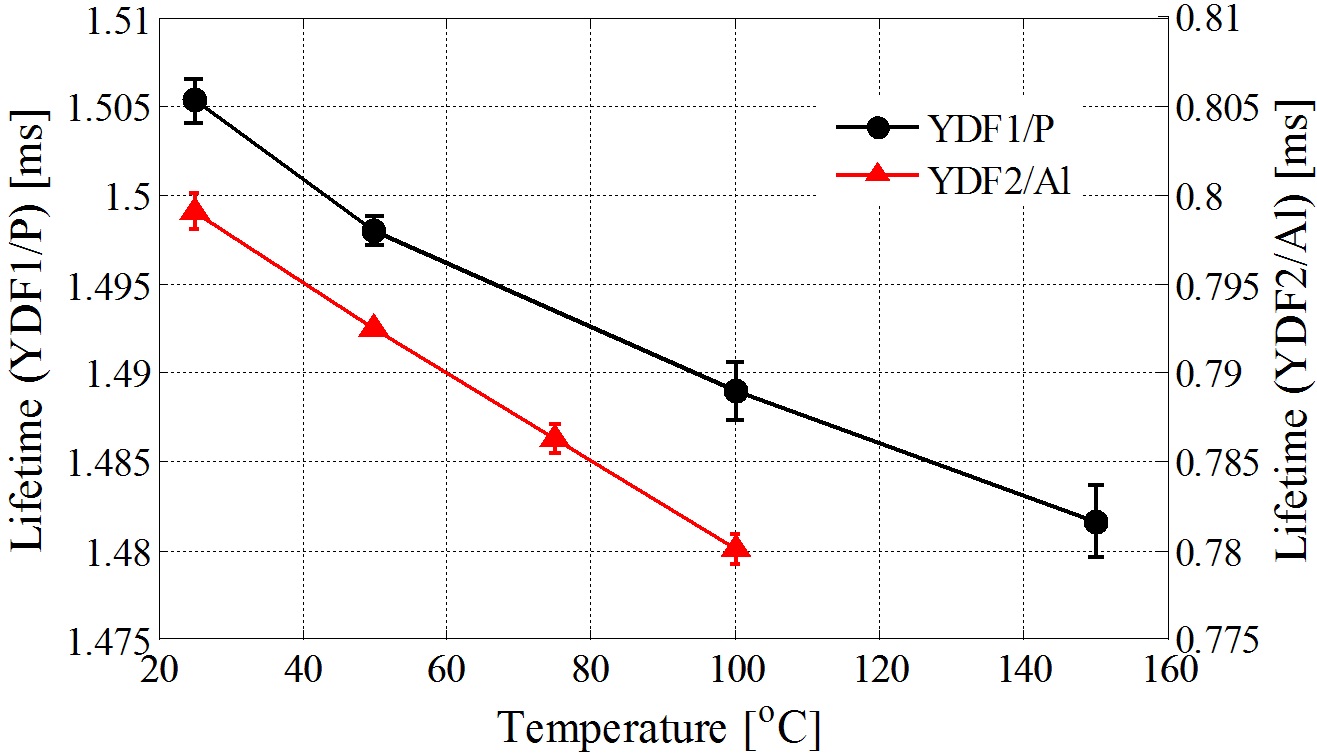
In order to determine the fluorescence lifetime, a 915-nm laser diode driven in pulse mode was used to pump a short piece of YDF1/P, exciting the Yb3+ ions doped in the core. Fig. 1 shows the measured fluorescence lifetime
of YDF1/P together with that of YDF1/Al [7]. In particular, one can see that the measured fluorescence lifetime of YDF1/P was reduced from 1.505 ms at 25℃ to 1.482 ms at 150℃. The slight reduction of 1.53% in the fluorescence lifetime for the temperature difference (
As described above, the lifetime reduction along with temperature variation resulted from the change of the population distribution among the Stark sublevels of Yb3+ ions, which would subsequently give rise to modifications to their absorption and emissions cross-sections. In general, the absorption cross-section can readily be calculated via the following relation [7,23]:
where
where
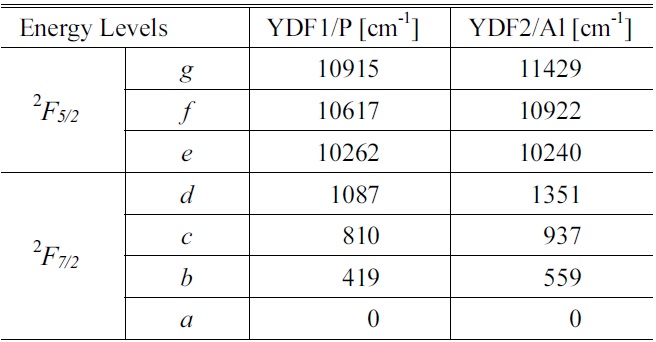
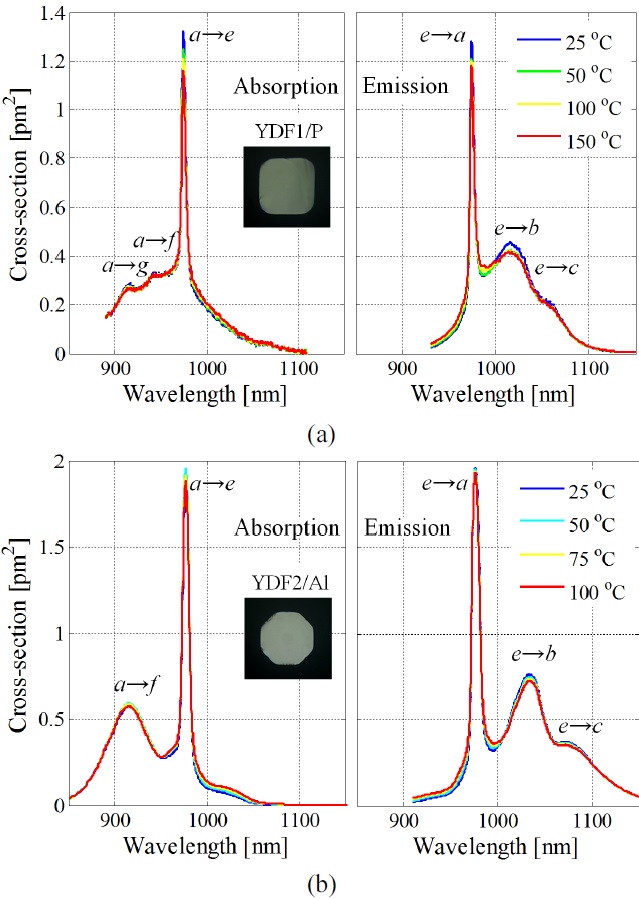
Figure 2 represents all the calculated absorption and emission cross-sections of YDF1/P and YDF2/Al based on our experimental measurements for different temperature conditions. The inset figures the fiber facet images of YDF1/P and YDF2/Al, respectively. It is noteworthy that the noticeable peaks and valleys of the cross-section curves are due to the different combinatorial transitions among the Stark sublevels. In addition, the specific energies of the individual Stark sublevels are summarized in Table 1, which
[TABLE 1.] The Stark energy-levels of YDF1/P and YDF2/Al

The Stark energy-levels of YDF1/P and YDF2/Al
were determined based on the emission and absorption spectra as well as their differential changes with temperature [14,16]. Actually, the estimated energies both for YDF1/P and YDF2/Al result in similar trends with other YDFs of the previous results [14,16] while there are a bit of differences due to the detailed compositional variations.
In Fig. 2(a), the peaks of the absorption cross-section of YDF1/P, which are observed from 915 nm to 950 nm, indicate the transitions of
The transition cross-sections of YDF2/Al are also shown in Fig. 2(b). While they presented similar trends to those of YDF1/P to some extent, a clear noticeable difference between YDF1/P and YDF2/Al is the behavior in the region around 940 nm. That is, the absorption cross-section of YDF1/P in that spectral band underwent significantly less thermal change compared to that of YDF2/Al. It should be noted that in that spectral region, YDF1/P and YDF2/Al form a plateau and a valley, respectively. As for the emission cross-sections, YDF1/P and YDF2/Al represent very similar behaviors, apart from the fact that the locations of the two main emission peaks in wavelengths above 1000 nm are substantially different: The two emission peaks of YDF1/P are located at much shorter wavelengths than those of YDF2/Al.
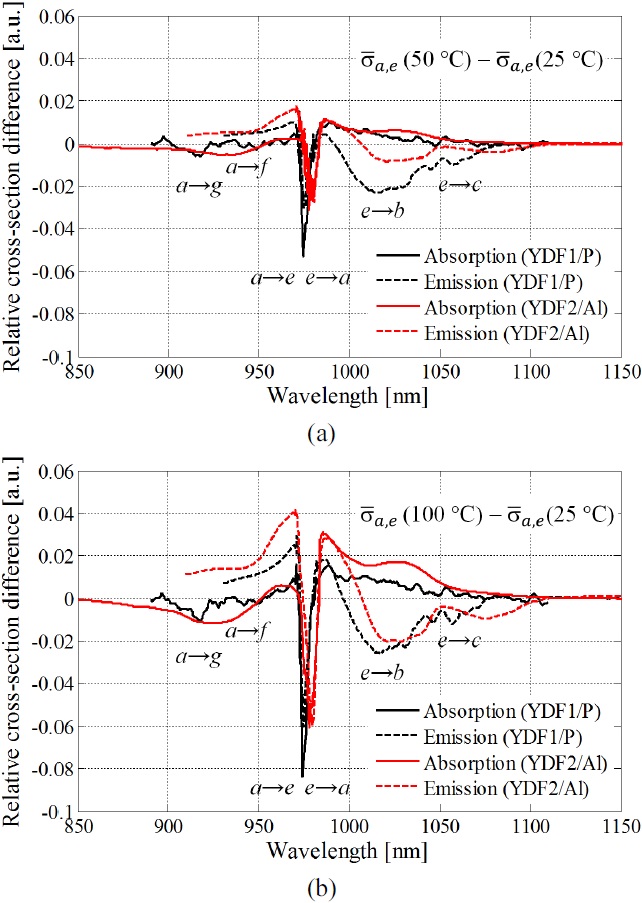
In addition, there are two significant, general trends in the changes of the transition cross-sections with temperature: One is that all the peaks related with the transitions to and from the lowest Stark sublevel, “
of the transition cross-sections at 50 and 100℃ against those at 25℃, which are normalized by their maximum values at 25℃ in order to make a fair comparison between them.
As for

there were clear indications of increasing quantities with temperature in the negative direction at around 920, 940, and 974 nm for YDF1/P, whereas at around 915 and 978 nm for YDF2/Al. These dips with negative quantities correspond to the transitions of
As for

, the positive deviation is due mainly to the increase in the population in the upper Stark sublevels, such as, “
for YDF1/P becomes comparable or relatively smaller than that of YDF2/Al at the high temperature of 100℃ whereas the former is significantly larger than the latter at the intermediate temperature of 50℃. This feature is more significantly seen in the wavelength range above ~1060 nm. In fact, such changes in the spectroscopic properties will lead to gain reductions with temperature because the signals at those wavelengths will undergo more absorption but will acquire less emission. It should be noted that the gain is primarily determined by the transition cross-sections as well as the inversion ratio, fluorescence lifetime, etc [22,23]. Thus, one can expect that YDF1/P should perform better than YDF2/Al in high temperature conditions because the thermal variations of the former’s transition cross-sections tend to become less in comparison with those of the latter. Hence, we further investigated the temperature-dependent gain characteristics of YDF1/P and YDF2/Al when they were used as gain fibers in a cladding-pumped amplifier configuration in the following. In particular, the amplifier configuration was chosen rather than a laser configuration because its gain is directly related with the spectroscopic properties of the gain fiber, including the transition cross-sections as well as the fluorescence lifetime [22,23].
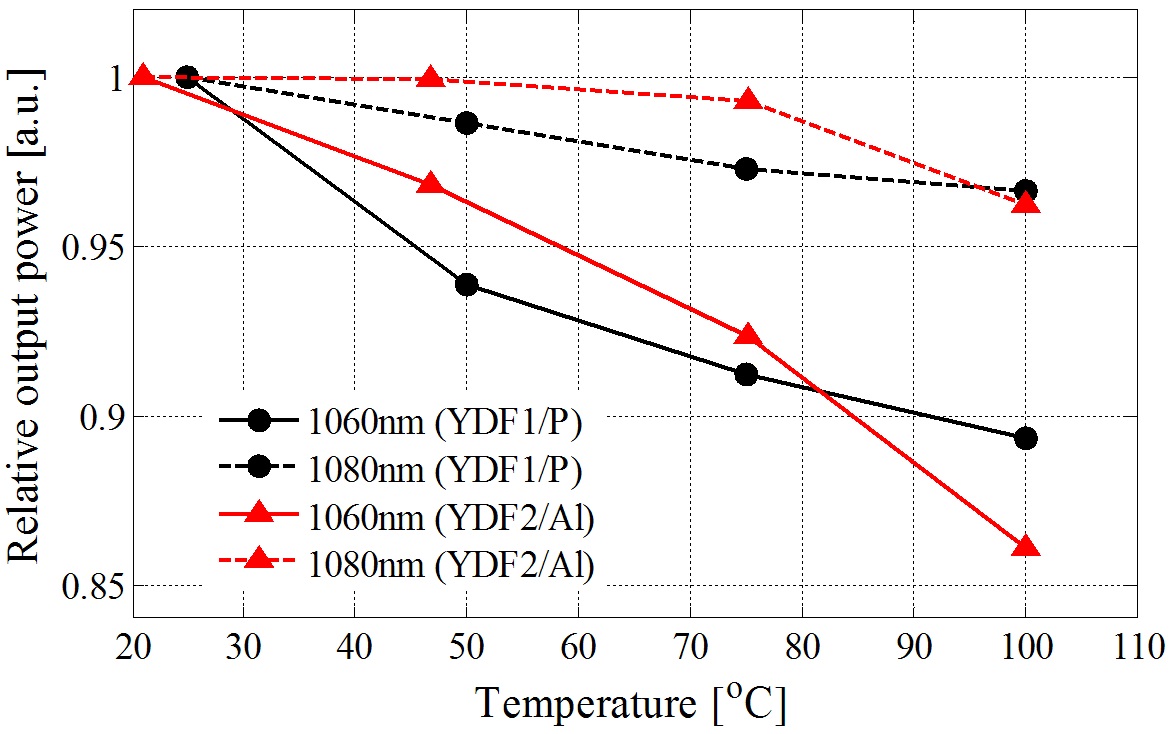
We newly set up a tunable seed fiber laser and a cladding-pumped amplifier based on YDF1/P. This was in an identical format with our previous arrangement for YDF2/Al [7] except for the pumping wavelength: YDF1/P was pumped at 940 nm whereas YDF2/Al was pumped at 915 nm. The gain fiber of YDF1/P used in the amplifier was 23-m long and was placed in the temperature-controlled oven. It should be noted that in a free-running laser configuration both fibers presented >70% of slope efficiencies with respect to absorbed pump power. Two different signal wavelengths of 1060 and 1080 nm were investigated for the temperature range of 25 to 100℃. The seed power to the amplifier was fixed to 150 mW during the whole measurements, and then, the amplifier was pumped to yield ~10-dB gain, i.e., the output power of ~1.5 W, which was exactly the same condition as our previous arrangement for YDF2/Al [7]. It is noteworthy that we restricted the maximum temperature to 100℃, which is well below the thermal damage threshold of the outer polymer material [12]. This was done in order to screen out any side effects due to the thermal degradation of the outer polymer material.
The gain characteristics of YDF1/P and YDF2/Al with temperature are shown in Fig. 4. It should be noted that
the output powers were normalized by their maximum values measured at ~25℃ in order to make a fair comparison between them. One can see a similar overall trend of decreasing output power with temperature, which is basically determined by the thermal changes of the spectroscopic properties of the fibers as discussed above. Since Yb3+ ions behave much like a quasi-three-level system owing to the Stark split of 2
We have measured and analyzed thermal characteristics of a P-based YDF (YDF1/P) in comparison with an Al-based YDF (YDF2/Al), including their spectroscopic properties and gain characteristics in the temperature range of 25 to 100℃. While both fibers exhibited similar and comparable trends in their thermal characteristics, we could see several noticeable distinctions in terms of the fluorescence lifetime reduction rate, the spectral dependence of the transition cross-sections, and the gain reduction rate. In particular, the fluorescence lifetime of YDF1/P was much longer (~1.5 ms) than that of YDF2/Al (~0.8 ms), which implies that the lineshape broadening of the Yb3+ ions of the former must be smaller than that of the latter [22]. This can readily be seen in Fig. 3 or in Table 1. This, in fact, led to significantly less thermal lifetime reduction rate for YDF1/P (0.012%/℃) than that for YDF2/Al (0.026%/℃) [22]. Because of the narrower lineshape broadening of YDF1/P, the thermal changes of their transition cross-sections were more rapidly saturated in comparison with YDF2/Al. In addition, the absorption change of YDF1/P at 940 nm (pump wavelength) with temperature was nearly negligible. In result, YDF1/P exhibited better thermal resilience than YDF2/Al in terms of gain reduction, particularly, at higher temperatures over 80℃ when they were used as gain fibers in a cladding-pumped amplifier configuration. In this light the shortcomings of the quasithree- level nature of Yb3+ ions were better rectified in YDF1/P than in YDF2/Al in high-temperature conditions, which makes P-based YDFs attractive for stable, high-power operation, in particular, for operation at 1060 nm. A P-based YDF has also demonstrated sufficiently high thermal damage resilience for high-power operation: In Ref. 21, a record power extraction of 1.17 kW/m was successfully demonstrated, yielding the core temperature of well over 100℃ [4,12]. Therefore, we conclude that P-based YDFs must be a good replacement of Al-based YDFs, considering their thermally stable characteristics as well as their substantially high PD resilience [15,19,21]. Our comprehensive experimental data and comparative analysis on YDF1/P and YDF2/Al could be further utilized in rigorous modeling on YDFs.